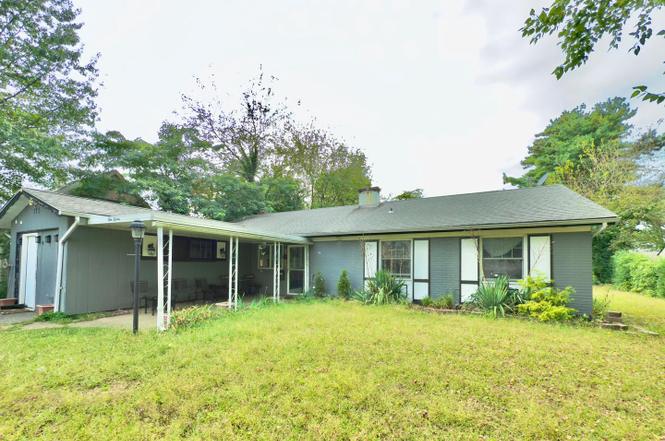
115 Sheffield Dr · Burlington, NJ
Flood risk 6/10 · Moderate
- FEMA flood zone
- X (unshaded)
- Chance of flooding over 30 yrs
- 0.73%
- Est. flood insurance / yr
- $507 – $1,088
Fire risk 1/10 · Minimal
- Est. fire insurance / yr
- $526 – $976
Heat risk 6/10 · Moderate
- Hot days now (above 103°F)
- 7 days/yr
- Hot days in 30 yrs
- 15 days/yr
Wind risk 6/10 · Moderate
- Chance of severe wind over 30 yrs
- 27.0%
Air-quality risk 5/10 · Moderate
- Unhealthy air days now
- 6 days/yr
- Unhealthy air days in 30 yrs
- 8 days/yr
Risk factors via First Street. Map © Google.
Why this score? — see what drove the C- grade
The composite is a weighted blend of 9 inputs, each scored 0–100. Each bar is that input's sub-score; the figure is the points it added to the 100-point composite (weight × sub-score).
- Cash flow +16.3/30.0
- ARV discount +15.0/15.0
- DSCR +5.1/10.0
- 1% rule +5.0/10.0
- Livability +3.9/5.0
- Rent growth +2.5/5.0
- Condition / age +2.5/5.0
- Schools +1.7/10.0
- Appreciation +0.0/10.0
$290,000
🖨 Deal sheet (PDF) 📄 Offer letter ✓ Due diligence
Listing remarks MLS
This fabulous rancher has been newly renovated. Newer appliances in the bright & airy, eat-in kitchen. New carpet and neutral paint throughout. This property is move-in ready, just waiting for you to make it home!!! Spacious rooms throughout. A brick fireplace is the focal point of the living room. The bank is asking for HIGHEST AND BEST BY 5PM SUNDAY
Key facts
- Covered porch
- Eat in kitchen
- Large yard
Tags
Property features AI
Finance
- Other: Finished above-grade area reported (per assessor)
- Financial info: Ownership: Fee simple
Exterior
- Parking: Front-entry attached garage (1 space); Driveway parking
- Utilities: Public water; Public sewer; Natural gas hot water
- Home design: Detached single-family home; Frame construction; Slab foundation
- Construction: Frame construction; Slab foundation; Above-grade and below-grade structures noted
- Exterior features: Lot dimensions approximately 65 x 100; No tidal water
Interior
- Kitchen: No kitchen appliance details provided
- Bedrooms: Three bedrooms on the main level
- Bathrooms: Two full bathrooms (both on the main level)
- Heating & cooling: Radiant heating; Other heating type; Heating fuel: natural gas and wood; Window air conditioning units (electric)
- Interior features: Two or more access exits; Wood-burning fireplace (1)
- Laundry & utility: Main floor laundry
Neighborhood map
What this means for you Summary
Snapshot
- This is a 3-bed/2.0-bath single-family listed at $290k.
Deal economics
- At list price, monthly cash flow is $160 ($2k/yr) — positive.
- The deal already cash-flows at list — no discount required.
- To meet the 1% rule (rent ≥ 1% of price), the offer needs to be $290k (0.0% below list).
- Recommended offer: $273k (6.0% below list) — sets the bar for market timing.
- Cap rate 7.0% vs local median 4.9% in Burlington — top-decile yield for the area; either an underpriced asset or a hidden risk that comps aren't pricing in. Stress-test before assuming the spread holds.
Location & tenants
- Location reads 78/100 on livability (#89 in NJ, #2,359 nationally) — a middle-class / working-renter tenant base. Strengths: housing A+, health & safety A+, cost of living A-; Watch: amenities F.
- Willingboro Public School District (suburban): math 5% / reading 30% proficiency, ranked #433 of 472 in NJ (top 92%) — low school quality limits family demand, transient renter base, plan for 1-2y turnover.
- Zoned schools: Willingboro Memorial Middle School (math 5% / reading 34%, grade F, #398 of 431 statewide, top 93%, 600 students, 8% FRL); Willingboro High School (math 2% / reading 37%, grade F, #354 of 399 statewide, top 89%, 842 students, 0% FRL) — zoned schools average 4% FRL vs 48% district-wide (44 pts lower); this property's tenant base skews higher-income than the district average.
- Market conditions: 155 active listings in the ZIP; 21 comparable units currently listed for rent nearby; rentals leasing fast (median 0d on market — plan ~1-2 weeks tenant-placement turnaround); solid renter incomes; 2,161 units permitted in Burlington County in 2024 (988 in 5+ unit buildings).
- This rent runs 35% of the median local income ($98k/yr) — at the standard rent-burdened threshold; future hikes will face affordability resistance.
Forward outlook
- Local home prices are declining (-3.0%/yr); year-one equity from $2k of loan paydown is wiped out by about $9k of value loss. Plan a longer hold.
- Burlington County population projected to shrink 5% by 2050 — rents likely to lag national; underwrite the cash flow, not the appreciation.
Negotiation context
- It's been on market 85 days — a 6% lower offer ($273k) is reasonable based on typical stale-listing flexibility.
- 9 sale attempts since 26y ago with the ask held roughly flat each time — persistent listings suggest the price (not the market) is what's stuck; bring a comps-based counter.
- Current owner paid $85k; list at $290k implies a 241% gain — meaningful room to come down on a strong offer.
Risks & watch-outs
- Watch-outs: built in 1958 — expect roof / HVAC / electrical / plumbing capex.
- Climate carrying-cost: major flood risk; major wind risk, 27% chance of damaging wind over 30y; extreme-heat days projected 7→15/yr by 2055 (HVAC capex compounding) — expect insurance premiums to compound above CPI over the hold.
Questions for the listing agent
- It's been on market 85 days. Have you received any prior offers? Is the seller open to a 6% concession, seller financing, or rate buy-down credit?
- Built in 1958 — when were the roof, HVAC, electrical panel, plumbing, and water heater last replaced?
- Why hasn't it sold? Are there any deal-killer items the seller is aware of (foundation, flood, title, zoning, code violations)?
- Is there a deadline driving the sale (1031 exchange, divorce, estate, relocation)? That informs how much negotiation room exists.
- What's the average days-on-market for RENTAL listings here right now (not sales)? A rising rental-DOM trend means longer vacancies and softer asking-rent achievability than the comps imply.
- What's the recent tenant-quality profile in this submarket — average credit score on applications, eviction rate, late-payment / NSF rate, and stable-employment percentage? A property-management company in the area should have these aggregated.
- How much new for-sale + rental construction is in the pipeline within 1–3 miles? Heavy new supply typically softens prices + rents 12–24 months out; constrained supply supports both.
Investment metrics
- 1% rule
- 1.00% ✗
- Cap rate
- 6.96%
- Cash-on-cash
- 2.37%
- DSCR
- 1.11
- GRM
- 8.3
CMA / ARV
- ARV (on-the-fly)
- $366,180
- Comps found
- 12
Show comp detail 12 sales within ~0.75 mi
| Address | Dist | Beds/Ba | Sqft | Sold | Price | $/sf | Match |
|---|---|---|---|---|---|---|---|
| 60 Sheffield Dr | 0.18mi | 4/2.0 (+1) | 1,372 (-4%) | 2mo | $350,000 | $255 | 78 |
| 12 Bloomfield Ln | 0.39mi | 3/2.0 | 1,452 (+1%) | 6mo | $356,000 | $245 | 75 |
| 11 Birdseye Ln | 0.50mi | 4/2.0 (+1) | 1,372 (-4%) | 1mo | $400,000 | $292 | 64 |
| 14 Buttercup Ln | 0.43mi | 4/2.0 (+1) | 1,372 (-4%) | 5mo | $315,000 | $230 | 63 |
| 25 Blackwell Ln | 0.51mi | 4/2.0 (+1) | 1,372 (-4%) | 1mo | $340,000 | $248 | 63 |
| 26 Buttercup Ln | 0.43mi | 4/2.0 (+1) | 1,372 (-4%) | 6mo | $370,000 | $270 | 62 |
| 71 Shawmont Ln | 0.10mi | 4/1.0 (+1) | 1,624 (+13%) | 3mo | $260,000 | $160 | 62 |
| 30 Beechfern Ln | 0.57mi | 4/2.0 (+1) | 1,372 (-4%) | 1mo | $360,000 | $262 | 60 |
| 42 Bucknell Ln | 0.70mi | 3/2.0 | 1,384 (-4%) | 2mo | $365,000 | $264 | 60 |
| 11 Buxmont Ln | 0.58mi | 4/2.0 (+1) | 1,372 (-4%) | 3mo | $340,000 | $248 | 58 |
| 39 Babbitt Ln | 0.45mi | 3/2.0 | 1,273 (-11%) | 5mo | $357,000 | $280 | 56 |
| 21 Stafford Ln | 0.71mi | 4/2.0 (+1) | 1,572 (+10%) | 2mo | $369,000 | $235 | 44 |
Match score weights: distance 35% · size 25% · config 20% · recency 20%. Top-matched comps best support the ARV.
Projected returns pro-forma
-3.0% appreciation · 3.0% rent growth · sell at horizon
- IRR
- -12.5%
- Equity multiple
- 0.55×
- Total profit
- $-36,654
- Equity at exit
- $43,240
- IRR
- -3.4%
- Equity multiple
- 0.78×
- Total profit
- $-18,270
- Equity at exit
- $25,074
Cash invested: $81,200 (down + closing). Projections, not guarantees.
Landlord ↔ Tenant lean methodology
- Overall (STATE)
- 21 Tenant-Leaning
- State New Jersey
- 21 Tenant-Leaning · D+6
- County
- — inherits STATE
- City
- — inherits STATE
ZIP-level market 08046
- Active inventory
- 155
- Price-to-rent
- 8.3×
Monthly cashflow live
- Estimated rent
- $2,899 high interval (Pro) →
- Mortgage (P&I)
- −$1,521
- Tax from tax record
- −$488 /mo · $5,859/yr
- Insurance
- −$121
- HOA
- −$0
- Vacancy / Maint / Mgmt
- −$609
- Net cashflow
- $160
Break-even live
Sensitivity live
| Price | -10% $325 | -5% $243 | +0% $160 | +5% $78 | +10% $-4 |
|---|---|---|---|---|---|
| Rent | -10% $-69 | -5% $46 | +0% $160 | +5% $275 | +10% $389 |
| Rate | -1.0pp $306 | -0.5pp $234 | base $160 | +0.5pp $85 | +1.0pp $9 |
UW: 25.0% down · 7.5% · 30yr · 1.5% tax · 5.0% vac · 8.0% maint · 8.0% mgmt
Financing live
Cash to close
- Down payment
- $72,500
- Closing costs
- $8,700
- Reserves months
- —
- Total cash needed
- —
Loan-product check · same deal, 3 products live
Conventional
25% down · 7.5% · 30yr
- Down + closing
- —
- Monthly P&I
- —
- Monthly cashflow
- —
- DSCR
- —
- Eligible?
- —
Personal DTI + credit; lowest rate.
DSCR
20% down · 8.5% · 30yr
- Down + closing
- —
- Monthly P&I
- —
- Monthly cashflow
- —
- DSCR
- —
- Eligible?
- —
No personal income docs; deal must DSCR.
Hard money
10% down · 12.0% · 12mo
- Down + closing
- —
- Monthly P&I
- —
- Monthly cashflow
- —
- DSCR
- —
- Eligible?
- —
Short-term bridge; refi at stabilization.
Rent comps 21 comps
| Address | Beds | Baths | Sqft | Rent | $/sqft | DOM | Units | Dist |
|---|---|---|---|---|---|---|---|---|
| 17 Snowdon Ln Willingboro, NJ | 3.0 | 2.0 | 1200 | $2,700 | $2.25 | 0d | 1 | 0.11mi |
| 6 Sherwood Ln Willingboro, NJ | 4.0 | 2.0 | 1372 | $3,200 | $2.33 | 0d | 1 | 0.27mi |
| 1000 Ivorie Ct Burlington, NJ | 1.0–2.0 | 1.0 | 1025 | $2,075 | $2.02 | 26d | 1 | 0.39mi |
| 20 Sussex Dr Unit Sfh Willingboro, NJ | 4.0 | 2.0 | 1000 | $2,850 | $2.85 | 0d | 1 | 0.44mi |
| 1020 Jardin Ct Burlington, NJ | 2.0 | 1.0 | 1024 | $1,800 | $1.76 | 7d | 1 | 0.48mi |
| 1020 Woodlane Rd Beverly, NJ | 2.0 | 1.0–1.5 | 1515 | $2,054 | $1.36 | 0d | 14 | 0.59mi |
| 28 Palmer Sq Beverly, NJ | 2.0 | 1.5 | 1096 | $2,450 | $2.24 | 0d | 1 | 0.65mi |
| 48 Sandstone Ln Willingboro, NJ | 4.0 | 2.0 | 1372 | $2,700 | $1.97 | 0d | 1 | 0.78mi |
| 29 Hinsdale Ln Willingboro, NJ | 4.0 | 2.0 | 1570 | $3,750 | $2.39 | 0d | 1 | 0.83mi |
| 52 Creekside Way Burlington, NJ | 3.0 | 3.5 | 1764 | $3,100 | $1.76 | 0d | 1 | 0.91mi |
| 34 Hopkins Ln Willingboro, NJ | 3.0 | 2.0 | 1696 | $3,200 | $1.89 | 0d | 1 | 0.93mi |
| 17 Bonnie Ln Willingboro, NJ | 4.0 | 2.5 | 1797 | $2,890 | $1.61 | 26d | 1 | 1.04mi |
| 89 Hampshire Ln Willingboro, NJ | 4.0 | 2.0 | 1562 | $3,400 | $2.18 | 12d | 1 | 1.21mi |
| 4236 Route 130 Willingboro, NJ | 1.0–3.0 | 1.0–2.5 | 1278 | $2,710 | $2.12 | 0d | 1 | 1.29mi |
| 200 Delanco Rd Beverly, NJ | 1.0–2.0 | 1.0–2.0 | 1054 | $2,235 | $2.12 | 0d | 7 | 1.33mi |
| 120 Elm St Beverly, NJ | 1.0–2.0 | 1.0–1.5 | 967 | $1,995 | $2.06 | 0d | 5 | 1.34mi |
| 129 Green St Beverly, NJ | 3.0 | 1.0 | 1008 | $2,800 | $2.78 | 45d | 1 | 1.35mi |
| 74 Plumtree Ln Willingboro, NJ | 4.0 | 2.0 | 1624 | $3,000 | $1.85 | 0d | 1 | 1.40mi |
| 20 Mosshill Ln Unit 4BR Willingboro, NJ | 4.0 | 1.5 | 1000 | $2,900 | $2.90 | 26d | 1 | 1.43mi |
| 10 Melville Ln Willingboro, NJ | 4.0 | 2.5 | 1797 | $3,000 | $1.67 | 17d | 1 | 1.46mi |
| 23 Raleigh Pl Willingboro, NJ | 3.0 | 2.0 | 1430 | $2,600 | $1.82 | 45d | 1 | 1.47mi |
Listing history 42 events
-
2026-06-21days on market $290,000 Active 85 DOM
-
2026-06-18days on market $290,000 Active 82 DOM
-
2026-06-17days on market $290,000 Active 81 DOM
-
2026-06-16days on market $290,000 Active 80 DOM
-
2026-06-15days on market $290,000 Active 79 DOM
-
2026-06-13days on market $290,000 Active 77 DOM
-
2026-06-13days on market $290,000 Active 76 DOM
-
2026-06-09days on market $290,000 Active 73 DOM
-
2026-06-08days on market $290,000 Active 72 DOM
-
2026-06-07days on market $290,000 Active 71 DOM
-
2026-06-04days on market $290,000 Active 68 DOM
-
2026-06-03days on market $290,000 Active 67 DOM
-
2026-06-02days on market $290,000 Active 66 DOM
-
2026-06-01days on market $290,000 Active 65 DOM
-
2026-05-31days on market $290,000 Active 64 DOM
-
2026-03-10historical Active Under Contract
-
2026-02-15status Active
-
2026-02-09historical Active Under Contract
-
2026-02-01price $290,000
-
2026-01-03$300,000 Active
-
2025-12-31historical
-
2025-11-24price $300,000
-
2025-10-21price $310,000
-
2025-09-26$315,000 Active
-
2015-07-30soldstatus $85,000 Sold 357-char remark
Show marketing remark (357 chars)
This fabulous rancher has been newly renovated. Newer appliances in the bright & airy, eat-in kitchen. New carpet and neutral paint throughout. This property is move-in ready, just waiting for you to make it home!!! Spacious rooms throughout. A brick fireplace is the focal point of the living room. The bank is asking for HIGHEST AND BEST BY 5PM SUNDAY
-
2015-07-30soldstatus $85,000
Show marketing remark (357 chars)
This fabulous rancher has been newly renovated. Newer appliances in the bright & airy, eat-in kitchen. New carpet and neutral paint throughout. This property is move-in ready, just waiting for you to make it home!!! Spacious rooms throughout. A brick fireplace is the focal point of the living room. The bank is asking for HIGHEST AND BEST BY 5PM SUNDAY
-
2015-06-16status Under Contract 357-char remark
Show marketing remark (357 chars)
This fabulous rancher has been newly renovated. Newer appliances in the bright & airy, eat-in kitchen. New carpet and neutral paint throughout. This property is move-in ready, just waiting for you to make it home!!! Spacious rooms throughout. A brick fireplace is the focal point of the living room. The bank is asking for HIGHEST AND BEST BY 5PM SUNDAY
-
2015-06-15soldstatus $85,000 Sold 357-char remark
Show marketing remark (357 chars)
This fabulous rancher has been newly renovated. Newer appliances in the bright & airy, eat-in kitchen. New carpet and neutral paint throughout. This property is move-in ready, just waiting for you to make it home!!! Spacious rooms throughout. A brick fireplace is the focal point of the living room. The bank is asking for HIGHEST AND BEST BY 5PM SUNDAY
-
2015-06-02status Under Contract 357-char remark
Show marketing remark (357 chars)
This fabulous rancher has been newly renovated. Newer appliances in the bright & airy, eat-in kitchen. New carpet and neutral paint throughout. This property is move-in ready, just waiting for you to make it home!!! Spacious rooms throughout. A brick fireplace is the focal point of the living room. The bank is asking for HIGHEST AND BEST BY 5PM SUNDAY
-
2015-05-05historical
-
2015-04-28$85,000 Active 357-char remark
Show marketing remark (357 chars)
This fabulous rancher has been newly renovated. Newer appliances in the bright & airy, eat-in kitchen. New carpet and neutral paint throughout. This property is move-in ready, just waiting for you to make it home!!! Spacious rooms throughout. A brick fireplace is the focal point of the living room. The bank is asking for HIGHEST AND BEST BY 5PM SUNDAY
-
2015-04-27$85,000
-
2015-04-27historical
-
2015-01-07$90,000
-
2015-01-07historical
-
2014-12-05$105,000
-
2014-12-05historical
-
2014-11-05$119,500
-
2000-12-07soldstatus $80,000
-
2000-11-22soldstatus $80,000
-
2000-10-11historical
-
2000-07-24$80,000
ⓘ Source: listings_history table (triggers on properties + properties_extension) + one-shot
backfill from property_details.listing_events for pre-trigger history.
Tax reassessment forecast NJ · Partial reset (capped growth)
- Current annual tax
- $5,859 · $488/mo
- Projected year-2 tax
- $6,540 · $545/mo
- Expected delta
- +$681/yr (+$57/mo · 11.6%)
ⓘ Screening estimate from a state-policy table — verify with the county assessor before closing.
Climate risk First Street
- Flood 6/10 Major FEMA zone X (unshaded) · 73% chance over 30 yrs
- Wildfire 1/10 Low
- Heat 6/10 Major 7 d/yr ≥103°F today · 15 d/yr by 30 yrs out
- Wind 6/10 Major 27% chance of damaging wind over 30 yrs
- Air quality 5/10 Major 6 unhealthy d/yr today · 8 by 30 yrs out
Nearby sold comps map
Loading sold comps map…
Walkable amenities ~0.75 mi
Loading nearby amenities…
Taxation est. · year 1
- Rental income
- $34,789
- − Mortgage interest
- −$16,245
- − Property taxes
- −$5,859
- − Insurance
- −$1,450
- − Repairs & maintenance
- −$2,783
- − Management
- −$2,783
- − Depreciation
- −$8,436
- Taxable loss
- −$2,767
- Est. tax savings @ 24.0%
- +$664
- After-tax cash flow
- $2,589/yr
For passive investors: Depreciation is non-cash, so a rental often shows a tax loss while cash-flowing — sheltering income. Rental losses are passive: they offset passive income freely, and up to $25,000/yr can offset ordinary (W-2) income if you actively participate and your MAGI is under $100k (phasing out to $0 by $150k); unused losses carry forward. On sale, claimed depreciation is recaptured at up to 25%, and gains may owe capital-gains tax (a 1031 exchange can defer both). Figures are a year-1 estimate at your 24.0% rate — not tax advice; consult a CPA.
Schools (NCES district)
- District
- Willingboro Public School District
- NCES district ID
- 3418000
- Math proficiency
- 5% ▼ -11.00%
- Reading proficiency
- 30% ▼ -1.00%
- Median HH income
- $67,064
- Composite
- 17.37/100
- National rank
- #9074
- State rank
- #433 of 472 in NJ
Livability — Burlington
- Score
- 78/100
- State rank
- #89
- US rank
- #2359
Category grades
Schools grade is shown separately in the Schools card above.
Census & demographics
- County
- Burlington County · 323,710 people
- Metro
- Philadelphia-Camden-Wilmington, PA-NJ-DE-MD
- Population (ZIP)
- 31,981
- Household income
- $98,178
- Rent vs Own
- Severe rent burden
- 342.0
Population outlook (Burlington County) Hauer SSP2
- Today (2025)
- 453,425 people
- By 2030
- 452,359 · -0.2%
- By 2040
- 445,033 · -1.9%
- By 2050
- 431,760 · -4.8%
- By 2075
- 406,277 · -10.4%
- By 2100
- 364,732 · -19.6%
Race, ethnicity, and origin ACS 2023
- Neighborhood character
- Predominantly Black (66%)
- Race & ethnicity
- Black 66% Hispanic / Latino 15% Two or more races 14% White 10%
- Hispanic origin (detail)
- Puerto Rican 9% Dominican 2%
- Common ancestry
- Swiss 4% Romanian 2% Hispanic 1%
- Foreign-born
- 15% · Canada, Jamaica
- Languages at home
- 82% English-only · Spanish 10% French/Haitian/Cajun 2% Other Indo-European 1%
Political lean MEDSL · Burlington
- 2024 margin
- D (+16.6) · D 57.6% · R 41.0% · Other 1.3%
- 2008→2024 swing
- -2.0pp toward R · 2008: 18.6pp · 2024: 16.6pp
- All cycles
- 2024: D+16.6 2020: D+19.5 2016: D+14.8 2012: D+18.7 2008: D+18.6
Not yet ingested
- Civics
- —
Market trends
- HPI YoY
- ▼ -273.52%
- Current HPI
- 348.3441
- Rent YoY
- —
- Metro
- Philadelphia-Camden-Wilmington, PA-NJ-DE-MD
- State GDP YoY
- ▲ 2.05%
- F500 in state
- 34
Industry mix (Fortune 500 HQ in NJ)
| Industry | F500 HQs | Revenue |
|---|---|---|
| Consumer Goods | 3 | $31B |
|
||
| Pharmaceuticals | 2 | $153B |
|
||
| Technology | 2 | $21B |
|
||
| Insurance | 2 | $20B |
|
||
| Healthcare | 2 | $19B |
|
||
| Financial Services | 1 | $70B |
|
||
Price history
+262.5% since first listed27 events — show timeline
- 2026-03-10 Contingent — BRIGHT MLS
- 2026-02-15 Relisted — BRIGHT MLS
- 2026-02-09 Contingent — BRIGHT MLS
- 2026-02-01 Price Changed $290,000 BRIGHT MLS
- 2026-01-03 Listed $300,000 BRIGHT MLS
- 2025-12-31 Listing Removed — BRIGHT MLS
- 2025-11-24 Price Changed $300,000 BRIGHT MLS
- 2025-10-21 Price Changed $310,000 BRIGHT MLS
- 2025-09-26 Listed $315,000 BRIGHT MLS
- 2015-07-30 Sold (MLS) $85,000 BRIGHT MLS
- 2015-07-30 Sold (MLS) $85,000 TREND
- 2015-06-16 Pending — TREND
- 2015-06-15 Sold (MLS) $85,000 TREND
- 2015-06-02 Pending — TREND
- 2015-05-05 Listing Removed — BRIGHT MLS
- 2015-04-28 Listed $85,000 TREND
- 2015-04-27 Listing Removed — BRIGHT MLS
- 2015-04-27 Listed $85,000 BRIGHT MLS
- 2015-01-07 Listing Removed — BRIGHT MLS
- 2015-01-07 Listed $90,000 BRIGHT MLS
- 2014-12-05 Listing Removed — BRIGHT MLS
- 2014-12-05 Listed $105,000 BRIGHT MLS
- 2014-11-05 Listed $119,500 BRIGHT MLS
- 2000-12-07 Sold (Public Records) $80,000 Public Records
- 2000-11-22 Sold (MLS) $80,000 BRIGHT MLS
- 2000-10-11 Listing Removed — BRIGHT MLS
- 2000-07-24 Listed $80,000 BRIGHT MLS
Property tax history
+2.5%/yrLatest (2025): $5,859 · +2.0% YoY. Source: county tax records.
Cash-flow waterfall
monthlySold comps — $/sqft
last 12 mo · ≤1 miLoading sold comps…