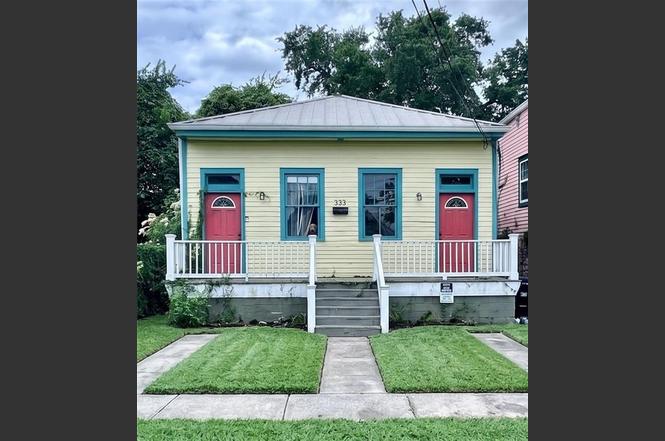
333 Homer St · New Orleans, LA
Flood risk 8/10 · Major
- FEMA flood zone
- X
- Chance of flooding over 30 yrs
- 0.6%
- Est. flood insurance / yr
- $507 – $1,088
Fire risk 1/10 · Minimal
- Est. fire insurance / yr
- $1,269 – $2,357
Heat risk 10/10 · Severe
- Hot days now (above 108°F)
- 7 days/yr
- Hot days in 30 yrs
- 21 days/yr
Wind risk 10/10 · Severe
- Chance of severe wind over 30 yrs
- 99.0%
Air-quality risk 3/10 · Minor
- Unhealthy air days now
- 3 days/yr
- Unhealthy air days in 30 yrs
- 4 days/yr
Risk factors via First Street. Map © Google.
Why this score? — see what drove the B- grade
The composite is a weighted blend of 9 inputs, each scored 0–100. Each bar is that input's sub-score; the figure is the points it added to the 100-point composite (weight × sub-score).
- Cash flow +30.0/30.0
- DSCR +10.0/10.0
- 1% rule +8.4/10.0
- ARV discount +7.5/15.0
- Livability +4.0/5.0
- Condition / age +2.5/5.0
- Rent growth +2.3/5.0
- Schools +1.6/10.0
- Appreciation +0.0/10.0
$159,000
🖨 Deal sheet 📄 Offer letter ✓ Due diligence
Listing remarks MLS
Vibrant Algiers Point Charm Meets Endless Potential! Step onto the welcoming front porch of this colorful, New Orleans-style raised home, which was formerly a double and has been seamlessly converted into a single-family residence. This property offers an exceptional, low-cost entry point for homebuyers or savvy investors. Inside, an expansive living and dining layout flows into a fully equipped kitchen that includes a refrigerator, dishwasher, gas range oven with a vent hood, ceiling-hanging pot rack, and a stainless-steel prep table. The home features 2 bedrooms and 2 full baths, headlined by a massive primary suite that easily accommodates king-size furniture and a private seating area. This primary retreat also includes a large walk-in closet and an ensuite full bath with an amazing clawfoot tub. Guests will love the spacious second bedroom, which offers its own private entrance door for ultimate flexibility. The second full bathroom includes a stand-up shower and sits directly across from the inside laundry room. Combining peace of mind with ultimate convenience, the property comes with a durable metal roof, highly coveted off-street parking for 3 or more vehicles, and a location in an X flood zone where lender-required flood insurance is typically not necessary. Out back, the long, extensive yard includes a handy storage shed and, while needing a little TLC, provides a blank canvas with plenty of room to build a home addition or install a pool. Best of all, you are just a 7-minute walk to the Ferry, offering effortless access to the city alongside spectacular, daily views of the Mississippi River and the iconic New Orleans skyline. This historic Crescent City opportunity will not last, so schedule your private showing today and make it yours!
Key facts
- Ensuite full bath
- Large walk-in closet
- Clawfoot tub
Tags
Property features AI
Exterior
- Parking: Driveway; Off-street parking; Three or more parking spaces
- Utilities: Public water; Public sewer
- Home design: Single-story home; Raised foundation; HardiPlank exterior; Metal roof; Average condition
- Construction: HardiPlank-type siding; Metal roof; Raised foundation; Built with insulation and a water heater noted as energy-efficient features
- Exterior features: Fenced yard; Porch; Shed(s)
Interior
- Kitchen: Dishwasher; Oven; Range; Refrigerator
- Bedrooms: Total of 5 rooms (includes bedrooms and living spaces)
- Bathrooms: 2 full bathrooms
- Heating & cooling: Central heating; Central air conditioning
- Interior features: Ceiling fan(s); Carbon monoxide detector; Smoke detector(s)
Neighborhood map
What this means for you Summary
Snapshot
- This is a 4-bed/2.0-bath single-family listed at $159k.
Deal economics
- At list price, monthly cash flow is $552 ($7k/yr) — positive.
- The deal already cash-flows at list — no discount required.
- Meets the 1% rule at list price ($2k rent vs $159k).
- Cap rate 11.0% vs local median 4.4% in New Orleans — top-decile yield for the area; either an underpriced asset or a hidden risk that comps aren't pricing in. Stress-test before assuming the spread holds.
Location & tenants
- Location reads 81/100 on livability (#3 in LA, #1,383 nationally) — a professional / high-income tenant draw. Strengths: amenities A+, commute A+, health & safety A+; Watch: crime C-, employment D.
- Orleans Parish (urban): math 11% / reading 27% proficiency, ranked #69 of 98 in LA (top 70%) — low school quality limits family demand, transient renter base, plan for 1-2y turnover; 68% free/reduced lunch — lower-income household profile, screen leases tightly.
- Market conditions: Rents soft (-0.7%/yr); 265 active listings in the ZIP; 16 comparable units currently listed for rent nearby; rentals leasing fast (median 12d on market — plan ~1-2 weeks tenant-placement turnaround); lower-income renter base — watch delinquency; 710 units permitted in Orleans Parish in 2024 (244 in 5+ unit buildings).
- At $2,134/mo this rent would consume 59% of the median local household income ($43k/yr) (locally 2240% of renters already pay >50% of income on rent) — very limited rent-growth headroom before tenants either downsize or default.
Forward outlook
- Local home prices are declining (-3.0%/yr); year-one equity from $1k of loan paydown is wiped out by about $5k of value loss. Plan a longer hold.
- Orleans County population projected at +61% by 2050 — long-run rental-demand tailwind backs the buy-and-hold thesis.
Negotiation context
- Only 8 days on market — expect competitive offers; lowballing is unlikely to land.
- 7 sale attempts since 21y ago with the ask held roughly flat each time — persistent listings suggest the price (not the market) is what's stuck; bring a comps-based counter.
- Current owner paid $115k; 38% above their basis — modest negotiation headroom, anchor on the comps not their cost.
Risks & watch-outs
- Watch-outs: flood insurance adds $66/mo; built in 1930 — expect roof / HVAC / electrical / plumbing capex.
- Climate carrying-cost: severe flood risk; severe wind risk, 99% chance of damaging wind over 30y; extreme-heat days projected 7→21/yr by 2055 (HVAC capex compounding) — expect insurance premiums to compound above CPI over the hold.
Questions for the listing agent
- Built in 1930 — when were the roof, HVAC, electrical panel, plumbing, and water heater last replaced?
- What's the actual annual flood-insurance premium (NFIP or private), and is the property in a SFHA with mandatory coverage?
- Is there a deadline driving the sale (1031 exchange, divorce, estate, relocation)? That informs how much negotiation room exists.
- What's the average days-on-market for RENTAL listings here right now (not sales)? A rising rental-DOM trend means longer vacancies and softer asking-rent achievability than the comps imply.
- What's the recent tenant-quality profile in this submarket — average credit score on applications, eviction rate, late-payment / NSF rate, and stable-employment percentage? A property-management company in the area should have these aggregated.
- How much new for-sale + rental construction is in the pipeline within 1–3 miles? Heavy new supply typically softens prices + rents 12–24 months out; constrained supply supports both.
Investment metrics
- 1% rule
- 1.34% ✓
- Cap rate
- 10.96%
- Cash-on-cash
- 16.67%
- DSCR
- 1.74
- GRM
- 6.2
CMA / ARV
No comps found within radius.
Projected returns pro-forma
-3.0% appreciation · 0.0% rent growth · sell at horizon
- IRR
- 1.9%
- Equity multiple
- 1.07×
- Total profit
- $3,202
- Equity at exit
- $23,707
- IRR
- 8.3%
- Equity multiple
- 1.54×
- Total profit
- $24,120
- Equity at exit
- $13,747
Cash invested: $44,520 (down + closing). Projections, not guarantees.
Landlord ↔ Tenant lean methodology
- Overall (STATE)
- 90 Strongly Landlord-Friendly
- State Louisiana
- 90 Strongly Landlord-Friendly · R+12
- County
- — inherits STATE
- City
- — inherits STATE
ZIP-level market 70114
- Rents YoY
- -0.7%
- Active inventory
- 265
- Price-to-rent
- 6.2×
Monthly cashflow live
- Estimated rent
- $2,134 high interval (Pro) →
- Mortgage (P&I)
- −$834
- Tax from tax record
- −$167 /mo · $2,007/yr
- Insurance
- −$66
- Flood insurance flood zone
- −$66 /mo · $798/yr
- HOA
- −$0
- Vacancy / Maint / Mgmt
- −$448
- Net cashflow
- $552
Break-even live
UW: 25.0% down · 7.5% · 30yr · 1.5% tax · 5.0% vac · 8.0% maint · 8.0% mgmt
Financing live
Cash to close
- Down payment
- $39,750
- Closing costs
- $4,770
- Reserves months
- —
- Total cash needed
- —
Loan-product check · same deal, 3 products live
Conventional
25% down · 7.5% · 30yr
- Down + closing
- —
- Monthly P&I
- —
- Monthly cashflow
- —
- DSCR
- —
- Eligible?
- —
Personal DTI + credit; lowest rate.
DSCR
20% down · 8.5% · 30yr
- Down + closing
- —
- Monthly P&I
- —
- Monthly cashflow
- —
- DSCR
- —
- Eligible?
- —
No personal income docs; deal must DSCR.
Hard money
10% down · 12.0% · 12mo
- Down + closing
- —
- Monthly P&I
- —
- Monthly cashflow
- —
- DSCR
- —
- Eligible?
- —
Short-term bridge; refi at stabilization.
Rent comps 16 comps
| Address | Beds | Baths | Sqft | Rent | $/sqft | DOM | Units | Dist |
|---|---|---|---|---|---|---|---|---|
| 1136 Brooklyn Ave New Orleans, LA | 3.0 | 1.0 | 913 | $1,600 | $1.75 | 23d | 1 | 0.17mi |
| 1140 Teche St Apt B New Orleans, LA | 3.0 | 1.0 | 1100 | $1,850 | $1.68 | 23d | 1 | 0.18mi |
| 325 Elmira Ave Unit 325 New Orleans, LA | 3.0 | 1.5 | 1050 | $1,525 | $1.45 | 23d | 1 | 0.58mi |
| 1050 Annunciation St Unit 1272355P New Orleans, LA | 2.0–5.0 | 2.0–4.0 | 1544 | $3,489 | $2.26 | 3d | 3 | 0.95mi |
| 1421 Numa St Unit 1421 New Orleans, LA | 3.0 | 2.0 | 861 | $1,400 | $1.63 | 23d | 1 | 1.10mi |
| 800 Gravier St Unit 1272312P New Orleans, LA | 2.0–4.0 | 2.0–4.0 | 1673 | $6,169 | $3.69 | 14d | 2 | 1.11mi |
| 1421 23 Numa St New Orleans, LA | 3.0 | 2.0 | 861 | $1,400 | $1.63 | 14d | 1 | 1.12mi |
| 1421 23 Numa St New Orleans, LA | 3.0 | 2.0 | 861 | $1,400 | $1.63 | 1d | 1 | 1.12mi |
| 810 Bienville St New Orleans, LA | 1.0–3.0 | 1.0–2.0 | 995 | $2,688 | $2.70 | 3d | 9 | 1.17mi |
| 822 Perdido St Unit 1272370P New Orleans, LA | 1.0–5.0 | 1.0–5.0 | 1447 | $5,974 | $4.13 | 3d | 4 | 1.19mi |
| 1420 Annunciation St New Orleans, LA | 1.0–3.0 | 1.0–2.0 | 1019 | $2,390 | $2.35 | 1d | 78 | 1.19mi |
| 939 Iberville St New Orleans, LA | 1.0–3.0 | 1.0 | 1502 | $3,800 | $2.53 | 11d | 7 | 1.24mi |
| 822 Howard Ave Unit 1272354P New Orleans, LA | 1.0–5.0 | 1.0–4.0 | 1749 | $9,250 | $5.29 | 1d | 3 | 1.29mi |
| 1011 Canal St Unit 1513926P New Orleans, LA | 1.0–4.0 | 1.0–4.0 | 1016 | $12,077 | $11.88 | 1d | 2 | 1.30mi |
| 1625 Lauradale Dr New Orleans, LA | 3.0 | 2.0 | 1029 | $1,700 | $1.65 | 3d | 1 | 1.33mi |
| 882 Montegut St New Orleans, LA | 1.0–3.0 | 1.0–2.0 | 826 | $2,575 | $3.12 | 43d | 7 | 1.41mi |
Listing history 6 events
-
2026-06-18days on market $159,000 Active 8 DOM
-
2026-06-17days on market $159,000 Active 7 DOM
-
2026-06-16days on market $159,000 Active 6 DOM
-
2026-06-15days on market $159,000 Active 5 DOM
-
2026-06-13remarks 699-char remark
-
2026-06-13$159,000 Active 3 DOM
ⓘ Source: listings_history table (triggers on properties + properties_extension) + one-shot
backfill from property_details.listing_events for pre-trigger history.
Tax reassessment forecast LA · Resets to sale price
- Current annual tax
- $2,007 · $167/mo
- Projected year-2 tax
- $2,007 · $167/mo
- Expected delta
- $0/yr ($0/mo · 0.0%)
ⓘ Screening estimate from a state-policy table — verify with the county assessor before closing.
Climate risk First Street
- Flood 8/10 Severe FEMA zone X · 60% chance over 30 yrs
- Wildfire 1/10 Low
- Heat 10/10 Extreme 7 d/yr ≥108°F today · 21 d/yr by 30 yrs out
- Wind 10/10 Extreme 99% chance of damaging wind over 30 yrs
- Air quality 3/10 Moderate 3 unhealthy d/yr today · 4 by 30 yrs out
Nearby sold comps map
Loading sold comps map…
Walkable amenities ~0.75 mi
Loading nearby amenities…
Taxation est. · year 1
- Rental income
- $25,608
- − Mortgage interest
- −$8,906
- − Property taxes
- −$2,007
- − Insurance
- −$1,592
- − Repairs & maintenance
- −$2,049
- − Management
- −$2,049
- − Depreciation
- −$4,625
- Taxable income
- $4,380
- Est. tax owed @ 24.0%
- −$1,051
- After-tax cash flow
- $5,575/yr
For passive investors: Depreciation is non-cash, so a rental often shows a tax loss while cash-flowing — sheltering income. Rental losses are passive: they offset passive income freely, and up to $25,000/yr can offset ordinary (W-2) income if you actively participate and your MAGI is under $100k (phasing out to $0 by $150k); unused losses carry forward. On sale, claimed depreciation is recaptured at up to 25%, and gains may owe capital-gains tax (a 1031 exchange can defer both). Figures are a year-1 estimate at your 24.0% rate — not tax advice; consult a CPA.
Schools (NCES district)
- District
- Orleans Parish
- NCES district ID
- 2201170
- Math proficiency
- 11% ▼ -52.00%
- Reading proficiency
- 27% ▼ -46.00%
- Median HH income
- $37,011
- Composite
- 15.78/100
- National rank
- #9271
- State rank
- #69 of 98 in LA
Livability — New Orleans
- Score
- 81/100
- State rank
- #3
- US rank
- #1383
Category grades
Schools grade is shown separately in the Schools card above.
Census & demographics
- Census place
- New Orleans, LA
- County
- Orleans Parish · 338,817 people
- City population
- 338,817
- Metro
- New Orleans-Metairie, LA
- Population (ZIP)
- 22,659
- Household income
- $43,493
- Rent vs Own
- Severe rent burden
- 2240.0
Population outlook (Orleans County) Hauer SSP2
- Today (2025)
- 513,025 people
- By 2030
- 575,781 · +12.2%
- By 2040
- 700,174 · +36.5%
- By 2050
- 826,541 · +61.1%
- By 2075
- 1,123,374 · +119.0%
- By 2100
- 1,355,609 · +164.2%
Race, ethnicity, and origin ACS 2023
- Neighborhood character
- Predominantly Black (72%)
- Race & ethnicity
- Black 72% White 16% Hispanic / Latino 8% Two or more races 5%
- Hispanic origin (detail)
- Mexican 2% Puerto Rican 1%
- Common ancestry
- Lithuanian 3% Slovak 1% Italian 1%
- Foreign-born
- 5% · Canada
- Languages at home
- 91% English-only · Spanish 6% French/Haitian/Cajun 2% Other Indo-European 1%
Political lean MEDSL · Orleans
- 2024 margin
- Solid D (+67.0) · D 82.2% · R 15.2% · Other 2.7%
- 2008→2024 swing
- +6.7pp toward D · 2008: 60.3pp · 2024: 67.0pp
- All cycles
- 2024: D+67.0 2020: D+68.2 2016: D+66.2 2012: D+62.5 2008: D+60.3
Not yet ingested
- Civics
- —
Market trends
- HPI YoY
- ▼ -98.56%
- Current HPI
- 149.0172
- Rent YoY
- ▼ -0.72%
- Metro
- New Orleans-Metairie, LA
- State GDP YoY
- ▲ 3.29%
- F500 in state
- 10
Industry mix (Fortune 500 HQ in LA)
| Industry | F500 HQs | Revenue |
|---|---|---|
| Telecommunications | 2 | $23B |
|
||
| Utilities | 1 | $12B |
|
||
| Wholesale / Distribution | 1 | $5B |
|
||
| Advertising | 1 | $2B |
|
||
Price history
+2550.0% since first listed11 events — show timeline
- 2026-06-10 Listed $159,000 AcadianaMLS
- 2026-06-10 Listed $159,000 GSREIN
- 2023-08-18 Listed $229,000 AcadianaMLS
- 2007-05-04 Sold (Public Records) $114,900 Public Records
- 2007-05-03 Sold (MLS) $114,900 GSREIN
- 2006-10-04 Listed $114,900 GSREIN
- 2006-10-04 Listed $114,900 AcadianaMLS
- 2005-04-29 Sold (MLS) $80,000 GSREIN
- 2005-01-24 Listed $89,900 AcadianaMLS
- 2005-01-24 Listed $89,900 GSREIN
- 2000-10-13 Sold (Public Records) $6,000 Public Records
Property tax history
+21.5%/yrLatest (2026): $2,007 · +194.9% YoY. Source: county tax records.
Cash-flow waterfall
monthlySold comps — $/sqft
last 12 mo · ≤1 miLoading sold comps…