10201 N 99th Ave Unit 70b · Peoria, AZ
Flood risk 1/10 · Minimal
- FEMA flood zone
- X (shaded)
- Chance of flooding over 30 yrs
- 0.0%
- Est. flood insurance / yr
- $507 – $1,088
Fire risk 1/10 · Minimal
- Est. fire insurance / yr
- $610 – $1,132
Heat risk 9/10 · Severe
- Hot days now (above 113°F)
- 6 days/yr
- Hot days in 30 yrs
- 16 days/yr
Wind risk 1/10 · Minimal
- Chance of severe wind over 30 yrs
- —
Air-quality risk 2/10 · Minimal
- Unhealthy air days now
- 1 days/yr
- Unhealthy air days in 30 yrs
- 1 days/yr
Risk factors via First Street. Map © Google.
Why this score? — see what drove the C+ grade
The composite is a weighted blend of 9 inputs, each scored 0–100. Each bar is that input's sub-score; the figure is the points it added to the 100-point composite (weight × sub-score).
- Cash flow +30.0/30.0
- 1% rule +10.0/10.0
- DSCR +10.0/10.0
- Livability +3.8/5.0
- Schools +3.5/10.0
- ARV discount +2.8/15.0
- Rent growth +2.7/5.0
- Condition / age +2.2/5.0
- Appreciation +0.0/10.0
$70,000
🖨 Deal sheet 📄 Offer letter ✓ Due diligence
Listing remarks
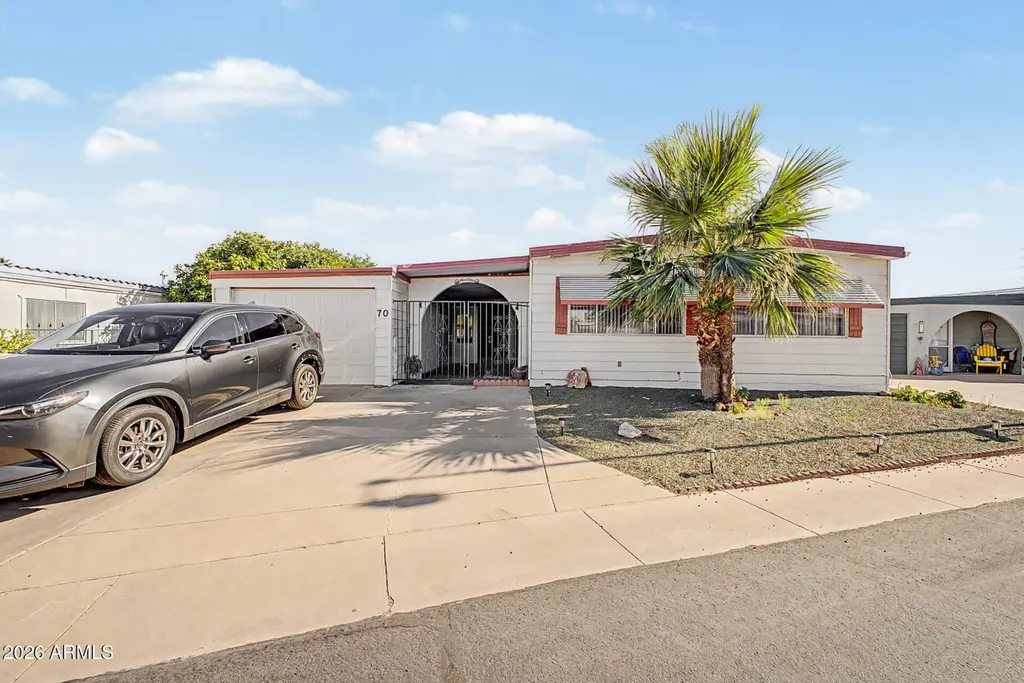
Welcome to this double-wide mobile home! Featuring a 1-car garage, extended concrete driveway, & a gated courtyard that adds to its inviting curb appeal. Enter to see a bright & airy interior enhanced by abundant natural light, neutral paint, & laminate/tile flooring throughout. The spacious living & dining room provides the perfect setting for entertaining! Beautiful eat-in kitchen offers white cabinetry, built-in appliances, & ample counter space. The generously sized main bedroom includes a spacious closet, its own bathroom, & sliding doors to the sun room. A fabulous sun room with beautiful flagstone flooring creates the ideal spot to enjoy morning coffee
Key facts
- Built-in appliances
- Bright airy interior
- Eat-in kitchen
Tags
Property features AI
Finance
- Other: Lot size not available (source indicates SqFt not available)
- HOA & community: Land lease (monthly); Monthly land lease: $980; Association covers ground maintenance, trash, and water; Community amenities: pool, heated community spa, pickleball, fitness center, biking/walking path, community media room
Exterior
- Parking: 2 open parking spaces; 1 covered space; Garage door opener with direct access; 1 garage space
- Security: Gated community
- Utilities: City water; Public sewer
- Home design: Leasehold property; Manufactured/mobile home
- Construction: Vinyl siding and wood frame construction; Painted exterior; Built-up roof
- Exterior features: Private yard; Wood fencing; Desert back yard; Gravel/stone front and back; Asphalt road access; Private maintained road
Interior
- Kitchen: Refrigerator; Dishwasher; Disposal; Built-in gas oven; Laminate counters
- Bedrooms: 2 possible bedrooms
- Flooring: Carpet; Laminate; Tile
- Bathrooms: 2 full bathrooms
- Heating & cooling: Heating present; Central air conditioning
- Interior features: High-speed internet; Eat-in kitchen; 9+ foot flat ceilings; No interior steps; Three-quarter master bathroom; Laminate countertops
- Laundry & utility: Inside laundry with washer/dryer hookups
Neighborhood map
What this means for you Summary
Snapshot
- This is a 2-bed/2.0-bath manufactured listed at $70k. Condition is rated fair.
Deal economics
- At list price, monthly cash flow is $904 ($11k/yr) — positive.
- The deal already cash-flows at list — no discount required.
- Meets the 1% rule at list price ($2k rent vs $70k).
- Recommended offer: $69k (1.5% below list) — sets the bar for market timing.
- Cap rate 21.8% vs local median 3.3% in Peoria — top-decile yield for the area; either an underpriced asset or a hidden risk that comps aren't pricing in. Stress-test before assuming the spread holds.
Location & tenants
- Location reads 76/100 on livability (#14 in AZ, #3,603 nationally) — a middle-class / working-renter tenant base. Strengths: housing A+, commute A, employment A; Watch: cost of living C-, amenities D, health & safety F.
- Peoria Unified School District (4237) (suburban): math 36% / reading 42% proficiency, ranked #64 of 249 in AZ (top 26%) — families likely to look elsewhere, expect single-tenant / working-renter base with shorter leases.
- Market conditions: Rents flat; 333 active listings in the ZIP; 26 comparable units currently listed for rent nearby; rentals at typical pace (median 24d on market — plan ~3-4 weeks tenant-placement turnaround); 36,011 units permitted in Maricopa County in 2024 (12,801 in 5+ unit buildings).
- This rent runs 31% of the median local income ($67k/yr) — at the standard rent-burdened threshold; future hikes will face affordability resistance.
Forward outlook
- Local home prices are declining (-3.0%/yr); year-one equity from $484 of loan paydown is wiped out by about $2k of value loss. Plan a longer hold.
- Maricopa County population projected at +38% by 2050 — long-run rental-demand tailwind backs the buy-and-hold thesis.
- At projected returns (-3.0% appreciation + 0.6% rent growth), your $20k cash investment doubles in ~3 years — after that, you're playing with house money.
Negotiation context
- It's been on market 30 days — a 2% lower offer ($69k) is reasonable based on typical stale-listing flexibility.
Risks & watch-outs
- Climate carrying-cost: extreme-heat days projected 6→16/yr by 2055 (HVAC capex compounding) — expect insurance premiums to compound above CPI over the hold.
Questions for the listing agent
- Have any recent inspections been done? Can we get a copy of the seller's disclosures and any deferred-maintenance estimates?
- Built in 1971 — when were the roof, HVAC, electrical panel, plumbing, and water heater last replaced?
- Is there a deadline driving the sale (1031 exchange, divorce, estate, relocation)? That informs how much negotiation room exists.
- Schools are B-rated — typically a magnet for longer-tenancy family renters. What's the average tenant stay here, and is there a school-zone premium baked into asking?
- What's the average days-on-market for RENTAL listings here right now (not sales)? A rising rental-DOM trend means longer vacancies and softer asking-rent achievability than the comps imply.
- What's the recent tenant-quality profile in this submarket — average credit score on applications, eviction rate, late-payment / NSF rate, and stable-employment percentage? A property-management company in the area should have these aggregated.
- How much new for-sale + rental construction is in the pipeline within 1–3 miles? Heavy new supply typically softens prices + rents 12–24 months out; constrained supply supports both.
Investment metrics
- 1% rule
- 2.51% ✓
- Cap rate
- 21.79%
- Cash-on-cash
- 55.35%
- DSCR
- 3.46
- GRM
- 3.3
CMA / ARV
- ARV (on-the-fly)
- $63,360
- Comps found
- 12
Show comp detail 12 sales within ~0.75 mi
| Address | Dist | Beds/Ba | Sqft | Sold | Price | $/sf | Match |
|---|---|---|---|---|---|---|---|
| 10201 N 99th Ave #166 | 0.06mi | 3/2.0 (+1) | 1,248 (+8%) | 8mo | $55,000 | $44 | 71 |
| 10201 N 99th Ave #127 | 0.06mi | 2/2.0 | 1,040 (-10%) | 12mo | $78,000 | $75 | 70 |
| 10701 N 99th Ave #254 | 0.46mi | 2/2.0 | 1,200 (+4%) | 12mo | $43,000 | $36 | 62 |
| 10701 N 99th Ave #231 | 0.46mi | 2/2.0 | 1,196 (+4%) | 14mo | $45,000 | $38 | 60 |
| 10701 N 99th Ave #159 | 0.46mi | 2/2.0 | 1,040 (-10%) | 3mo | $22,000 | $21 | 60 |
| 10701 N 99th Ave #136 | 0.46mi | 2/2.0 | 1,020 (-12%) | 6mo | $55,000 | $54 | 55 |
| 10701 N 99th Ave #124 | 0.46mi | 2/2.0 | 1,056 (-8%) | 13mo | $58,000 | $55 | 54 |
| 11275 N 99th Ave #215 | 0.61mi | 2/2.0 | 1,066 (-8%) | 7mo | $262,000 | $246 | 53 |
| 10701 N 99th Ave #224 | 0.46mi | 2/2.0 | 1,056 (-8%) | 15mo | $60,000 | $57 | 52 |
| 10701 N 99th Ave #115 | 0.46mi | 3/2.0 (+1) | 1,248 (+8%) | 11mo | $82,900 | $66 | 50 |
| 10701 N 99th Ave #63 | 0.54mi | 2/1.5 | 1,032 (-10%) | 7mo | $25,000 | $24 | 50 |
| 11275 N 99th Ave #118 | 0.70mi | 3/2.0 (+1) | 1,273 (+10%) | 2mo | $265,000 | $208 | 43 |
Match score weights: distance 35% · size 25% · config 20% · recency 20%. Top-matched comps best support the ARV.
Projected returns pro-forma
-3.0% appreciation · 0.62% rent growth · sell at horizon
- IRR
- 50.9%
- Equity multiple
- 3.15×
- Total profit
- $42,153
- Equity at exit
- $10,437
- IRR
- 55.4%
- Equity multiple
- 5.84×
- Total profit
- $94,880
- Equity at exit
- $6,052
Cash invested: $19,600 (down + closing). Projections, not guarantees.
Landlord ↔ Tenant lean methodology
- Overall (STATE)
- 87 Strongly Landlord-Friendly
- State Arizona
- 87 Strongly Landlord-Friendly · R+3
- County
- — inherits STATE
- City
- — inherits STATE
ZIP-level market 85345
- Home prices YoY
- -19.8%
- Rents YoY
- 0.6%
- Active inventory
- 333
- Price-to-rent
- 3.3×
Monthly cashflow live
- Estimated rent
- $1,757 high interval (Pro) →
- Mortgage (P&I)
- −$367
- Tax est. 1.5%
- −$88 /mo · $1,050/yr
- Insurance
- −$29
- HOA
- −$0
- Vacancy / Maint / Mgmt
- −$369
- Net cashflow
- $904
Break-even live
UW: 25.0% down · 7.5% · 30yr · 1.5% tax · 5.0% vac · 8.0% maint · 8.0% mgmt
Financing live
Cash to close
- Down payment
- $17,500
- Closing costs
- $2,100
- Reserves months
- —
- Total cash needed
- —
Loan-product check · same deal, 3 products live
Conventional
25% down · 7.5% · 30yr
- Down + closing
- —
- Monthly P&I
- —
- Monthly cashflow
- —
- DSCR
- —
- Eligible?
- —
Personal DTI + credit; lowest rate.
DSCR
20% down · 8.5% · 30yr
- Down + closing
- —
- Monthly P&I
- —
- Monthly cashflow
- —
- DSCR
- —
- Eligible?
- —
No personal income docs; deal must DSCR.
Hard money
10% down · 12.0% · 12mo
- Down + closing
- —
- Monthly P&I
- —
- Monthly cashflow
- —
- DSCR
- —
- Eligible?
- —
Short-term bridge; refi at stabilization.
Rent comps 26 comps
| Address | Beds | Baths | Sqft | Rent | $/sqft | DOM | Units | Dist |
|---|---|---|---|---|---|---|---|---|
| 10110 N 97th Dr Unit A Peoria, AZ | 2.0 | 1.5 | 1025 | $1,500 | $1.46 | 24d | 1 | 0.21mi |
| 10104 N 96th Dr Unit A Peoria, AZ | 2.0 | 2.0 | 1072 | $1,750 | $1.63 | 24d | 1 | 0.36mi |
| 9626 W Mountain View Rd Unit A Peoria, AZ | 2.0 | 2.0 | 1156 | $1,500 | $1.30 | 43d | 1 | 0.41mi |
| 10822 N Balboa Dr Sun City, AZ | 2.0 | 1.0 | 942 | $3,000 | $3.18 | 24d | 1 | 0.48mi |
| 10701 N 99th Ave Unit 230 Peoria, AZ | 2.0 | 2.0 | 784 | $1,099 | $1.40 | 20d | 1 | 0.49mi |
| 10316 N 94th Ln Peoria, AZ | 3.0 | 2.0 | 1352 | $2,000 | $1.48 | 24d | 1 | 0.50mi |
| 9426 W Monroe St Peoria, AZ | 3.0 | 3.5 | 1405 | $1,800 | $1.28 | 16d | 1 | 0.55mi |
| 10350 W Camden Ave Sun City, AZ | 2.0 | 2.0 | 1413 | $2,850 | $2.02 | 24d | 1 | 0.66mi |
| 9323 W Ironwood Dr Peoria, AZ | 3.0 | 2.0 | 1306 | $1,985 | $1.52 | 23d | 1 | 0.69mi |
| 9323 W Ironwood Dr Peoria, AZ | 3.0 | 2.0 | 1306 | $2,085 | $1.60 | 43d | 1 | 0.69mi |
| 9680 W Olive Ave Peoria, AZ | 1.0–3.0 | 1.0–2.0 | 850 | $1,540 | $1.81 | 1d | 9 | 0.72mi |
| 9625 W Olive Ave Peoria, AZ | 1.0–3.0 | 1.0–3.0 | 1485 | $2,136 | $1.44 | 5d | 7 | 0.89mi |
| 10101 N 91st Ave #109 Peoria, AZ | 2.0 | 2.5 | 1161 | $1,395 | $1.20 | 2d | 1 | 1.06mi |
| 9002 W Malapai Dr Peoria, AZ | 3.0 | 2.0 | 1270 | $2,040 | $1.61 | 19d | 1 | 1.10mi |
| 10421 W Puget Ave Peoria, AZ | 3.0 | 2.0 | 1424 | $1,750 | $1.23 | 24d | 1 | 1.13mi |
| 8930 W Monroe St Peoria, AZ | 3.0 | 2.0 | 1300 | $1,899 | $1.46 | 43d | 2 | 1.15mi |
| 8930 W Monroe St Peoria, AZ | 3.0 | 2.0 | 1300 | $2,099 | $1.61 | 23d | 1 | 1.15mi |
| 11411 N 91st Ave Unit 134 Peoria, AZ | 3.0 | 2.0 | 1310 | $1,599 | $1.22 | 43d | 1 | 1.27mi |
| 11411 N 91st Ave Unit 213 Peoria, AZ | 2.0 | 2.0 | 858 | $1,399 | $1.63 | 24d | 1 | 1.28mi |
| 8940 W Olive Ave Peoria, AZ | 2.0 | 2.0 | 1446 | $1,600 | $1.11 | 43d | 1 | 1.30mi |
| 8940 W Olive Ave Peoria, AZ | 2.0 | 2.0 | 897 | $1,400 | $1.56 | 16d | 1 | 1.30mi |
| 8834 W Purdue Ave Peoria, AZ | 3.0 | 2.0 | 1319 | $1,800 | $1.36 | 2d | 1 | 1.30mi |
| 8821 W Sahuaro Dr Peoria, AZ | 3.0 | 2.0 | 1074 | $1,595 | $1.49 | 24d | 1 | 1.38mi |
| 8821 W Sahuaro Dr Peoria, AZ | 3.0 | 2.0 | 1074 | $1,595 | $1.49 | 2d | 1 | 1.38mi |
| 10221 N 87th Ln Peoria, AZ | 3.0 | 2.0 | 1232 | $2,059 | $1.67 | 43d | 1 | 1.39mi |
| 9514 W El Caminito Dr Peoria, AZ | 3.0 | 2.0 | 1382 | $1,850 | $1.34 | 43d | 1 | 1.42mi |
Listing history 15 events
-
2026-06-18days on market $70,000 Active 30 DOM
-
2026-06-17days on market $70,000 Active 29 DOM
-
2026-06-16days on market $70,000 Active 28 DOM
-
2026-06-15days on market $70,000 Active 27 DOM
-
2026-06-13days on market $70,000 Active 25 DOM
-
2026-06-13days on market $70,000 Active 24 DOM
-
2026-06-09days on market $70,000 Active 21 DOM
-
2026-06-08days on market $70,000 Active 20 DOM
-
2026-06-07days on market $70,000 Active 19 DOM
-
2026-06-04days on market $70,000 Active 16 DOM
-
2026-06-03days on market $70,000 Active 15 DOM
-
2026-06-02days on market $70,000 Active 14 DOM
-
2026-06-01days on market $70,000 Active 13 DOM
-
2026-05-31days on market $70,000 Active 12 DOM
-
2026-05-15$70,000 Active
ⓘ Source: listings_history table (triggers on properties + properties_extension) + one-shot
backfill from property_details.listing_events for pre-trigger history.
Climate risk First Street
- Flood 1/10 Low FEMA zone X (shaded) · 0% chance over 30 yrs
- Wildfire 1/10 Low
- Heat 9/10 Extreme 6 d/yr ≥113°F today · 16 d/yr by 30 yrs out
- Wind 1/10 Low
- Air quality 2/10 Low 1 unhealthy d/yr today · 1 by 30 yrs out
Nearby sold comps map
Loading sold comps map…
Walkable amenities ~0.75 mi
Loading nearby amenities…
Taxation est. · year 1
- Rental income
- $21,081
- − Mortgage interest
- −$3,921
- − Property taxes
- −$1,050
- − Insurance
- −$350
- − Repairs & maintenance
- −$1,686
- − Management
- −$1,686
- − Depreciation
- −$2,036
- Taxable income
- $10,350
- Est. tax owed @ 24.0%
- −$2,484
- After-tax cash flow
- $8,365/yr
For passive investors: Depreciation is non-cash, so a rental often shows a tax loss while cash-flowing — sheltering income. Rental losses are passive: they offset passive income freely, and up to $25,000/yr can offset ordinary (W-2) income if you actively participate and your MAGI is under $100k (phasing out to $0 by $150k); unused losses carry forward. On sale, claimed depreciation is recaptured at up to 25%, and gains may owe capital-gains tax (a 1031 exchange can defer both). Figures are a year-1 estimate at your 24.0% rate — not tax advice; consult a CPA.
Condition & rehab AI · 27 photos
This double-wide mobile home requires moderate repairs and maintenance to improve its condition and value. Key areas for improvement include the exterior siding, interior paint, and worn carpet. Upgrades to the exterior and interior paint can significantly enhance the home's curb appeal and value.
Repairs flagged
- Major exterior siding — Significant weathering
- Minor interior paint — Some discoloration
- Minor kitchen countertops — Laminate wear
Value-add opportunities
- Resale Paint exterior siding — Enhances curb appeal
- Rental Replace worn carpet — Improves comfort and appearance
- Both Paint interior walls — Enhances appearance and value
Renovation cost estimate screening
| Repair item | Severity | Est. cost |
|---|---|---|
| exterior siding · Significant weathering | Major | $15,000–50,000 |
| interior paint · Some discoloration | Minor | $500–3,000 |
| kitchen countertops · Laminate wear | Minor | $500–3,000 |
| Total estimated repair cost · 3 items | $16,000–56,000 |
Value-add ROI direction
- Resale Paint exterior siding — Enhances curb appeal ↑
- Rental Replace worn carpet — Improves comfort and appearance ↑
- Both Paint interior walls — Enhances appearance and value ↑
ⓘ Cost ranges are severity-bucket heuristics (US national rule-of-thumb). Get contractor quotes + a written scope before underwriting a rehab budget.
Schools (NCES district)
- District
- Peoria Unified School District (4237)
- NCES district ID
- 0406250
- Math proficiency
- 36% ▼ -14.00%
- Reading proficiency
- 42% ▼ -8.00%
- Median HH income
- $60,171
- Composite
- 34.62/100
- National rank
- #5152
- State rank
- #64 of 249 in AZ
Livability — Peoria
- Score
- 76/100
- State rank
- #14
- US rank
- #3603
Category grades
Schools grade is shown separately in the Schools card above.
Census & demographics
- Census place
- Peoria, AZ
- County
- Maricopa County · 4,537,380 people
- City population
- 206,687
- Metro
- Phoenix-Mesa-Chandler, AZ
- Population (ZIP)
- 60,918
- Household income
- $67,380
- Rent vs Own
- Severe rent burden
- 1879.0
Population outlook (Maricopa County) Hauer SSP2
- Today (2025)
- 4,979,203 people
- By 2030
- 5,378,229 · +8.0%
- By 2040
- 6,156,598 · +23.6%
- By 2050
- 6,872,376 · +38.0%
- By 2075
- 8,401,270 · +68.7%
- By 2100
- 9,247,439 · +85.7%
Race, ethnicity, and origin ACS 2023
- Neighborhood character
- Diverse neighborhood (Simpson 0.62)
- Race & ethnicity
- White 51% Hispanic / Latino 34% Two or more races 14% Black 5% Asian 4% Native American 2%
- Hispanic origin (detail)
- Mexican 29%
- Common ancestry
- Romanian 2% Italian 2% Slovak 1%
- Foreign-born
- 13% · Canada, Vietnam
- Languages at home
- 76% English-only · Spanish 18% Other Indo-European 1% Vietnamese 1%
Political lean MEDSL · Maricopa
- 2024 margin
- Toss-up / Even · D 47.7% · R 51.2% · Other 1.1%
- 2008→2024 swing
- +7.1pp toward D · 2008: -10.6pp · 2024: -3.5pp
- All cycles
- 2024: R+3.5 2020: D+2.2 2016: R+3.5 2012: R+12.0 2008: R+10.6
Not yet ingested
- Civics
- —
Market trends
- HPI YoY
- ▼ -80.77%
- Current HPI
- 328.1069
- Rent YoY
- ▲ 0.62%
- Metro
- Phoenix-Mesa-Chandler, AZ
- State GDP YoY
- ▲ 4.54%
- F500 in state
- 20
Industry mix (Fortune 500 HQ in AZ)
| Industry | F500 HQs | Revenue |
|---|---|---|
| Technology | 2 | $13B |
|
||
| Mining / Metals | 1 | $23B |
|
||
| Environmental Services | 1 | $16B |
|
||
| Metals / Steel | 1 | $14B |
|
||
| Technology Distribution | 1 | $9B |
|
||
| Homebuilding | 1 | $8B |
|
||
Price history
1 event — show timeline
- 2026-05-15 Listed $70,000 ARMLS
Cash-flow waterfall
monthlySold comps — $/sqft
last 12 mo · ≤1 miLoading sold comps…