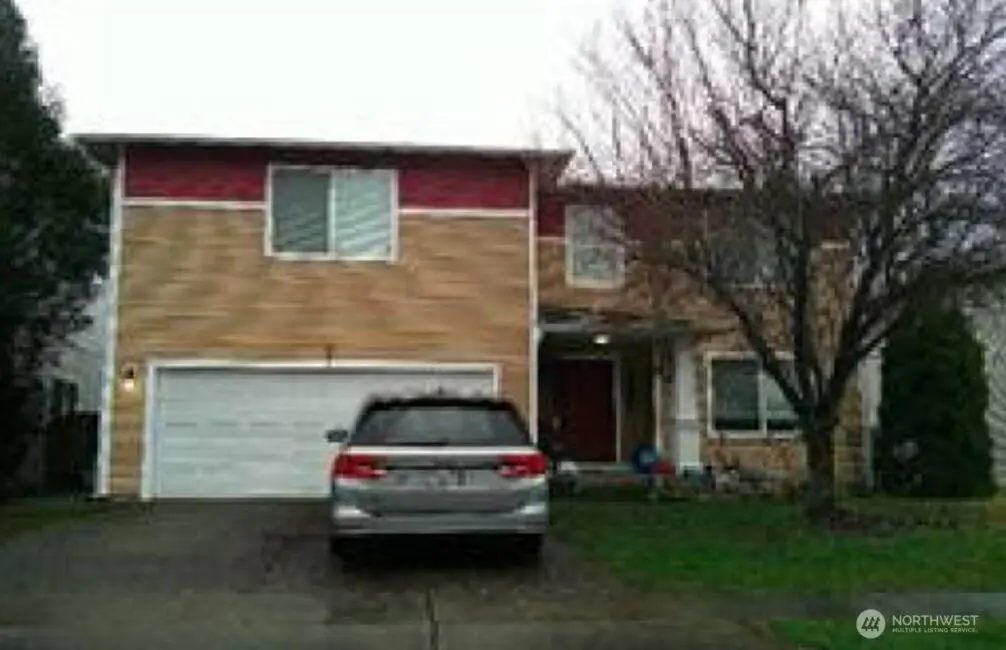
18529 94th Ave E · South Hill, WA
Flood risk 1/10 · Minimal
- FEMA flood zone
- X (unshaded)
- Chance of flooding over 30 yrs
- 0.0%
- Est. flood insurance / yr
- $507 – $1,088
Fire risk 1/10 · Minimal
- Est. fire insurance / yr
- $604 – $1,122
Heat risk 3/10 · Minor
- Hot days now (above 87°F)
- 7 days/yr
- Hot days in 30 yrs
- 15 days/yr
Wind risk 1/10 · Minimal
- Chance of severe wind over 30 yrs
- —
Air-quality risk 7/10 · Major
- Unhealthy air days now
- 10 days/yr
- Unhealthy air days in 30 yrs
- 10 days/yr
Risk factors via First Street. Map © Google.
Why this score? — see what drove the C- grade
The composite is a weighted blend of 9 inputs, each scored 0–100. Each bar is that input's sub-score; the figure is the points it added to the 100-point composite (weight × sub-score).
- ARV discount +15.0/15.0
- Cash flow +13.4/30.0
- Schools +5.4/10.0
- DSCR +4.0/10.0
- Livability +4.0/5.0
- 1% rule +3.7/10.0
- Rent growth +3.2/5.0
- Condition / age +2.5/5.0
- Appreciation +0.0/10.0
$384,800
🖨 Deal sheet 📄 Offer letter ✓ Due diligence
Listing remarks
5-bedroom, 2.5-bath home in Gen Heights. Bank owned. NO REPRESENTATION TO THE VALIDITY OF INFORMATION IS MADE, BUYER TO VERIFY ALL INFORMATION WHEREIN. Interior inspections are not available; do not trespass!
Key facts
- 4,665 sq ft lot
- Garage
- Built 2005
Neighborhood map
What this means for you Summary
Snapshot
- This is a 4-bed/3.0-bath single-family listed at $385k.
Deal economics
- At list price, monthly cash flow is $5 ($57/yr) — positive.
- The deal already cash-flows at list — no discount required.
- To meet the 1% rule (rent ≥ 1% of price), the offer needs to be $336k (12.6% below list).
- Recommended offer: $336k (12.6% below list) — sets the bar for 1% rule.
- Cap rate 6.3% vs local median 3.0% in South Hill — top-decile yield for the area; either an underpriced asset or a hidden risk that comps aren't pricing in. Stress-test before assuming the spread holds.
Location & tenants
- Location reads 80/100 on livability (#84 in WA, #1,620 nationally) — a professional / high-income tenant draw. Strengths: employment A+, housing A+, health & safety A+; Watch: crime C-, schools D+, cost of living F.
- Puyallup School District (suburban): math 53% / reading 66% proficiency, ranked #52 of 291 in WA (top 18%) — acceptable for families but not a draw, mixed tenant base, ~2y average lease.
- Market conditions: Rents rising (+2.8%/yr); 283 active listings in the ZIP; 25 comparable units currently listed for rent nearby; rentals at typical pace (median 20d on market — plan ~3-4 weeks tenant-placement turnaround); high-income renter base; 3,209 units permitted in Pierce County in 2024 (1,269 in 5+ unit buildings).
- This rent runs 34% of the median local income ($117k/yr) — at the standard rent-burdened threshold; future hikes will face affordability resistance.
Forward outlook
- Local home prices are declining (-3.0%/yr); year-one equity from $3k of loan paydown is wiped out by about $12k of value loss. Plan a longer hold.
- Pierce County population projected at +26% by 2050 — long-run rental-demand tailwind backs the buy-and-hold thesis.
Negotiation context
- It's been on market 62 days — a 6% lower offer ($362k) is reasonable based on typical stale-listing flexibility.
- 3 sale attempts since 21y ago with the ask held roughly flat each time — persistent listings suggest the price (not the market) is what's stuck; bring a comps-based counter.
Questions for the listing agent
- It's been on market 62 days. Have you received any prior offers? Is the seller open to a 13% concession, seller financing, or rate buy-down credit?
- What does the HOA fee cover, when was the last increase, and are there any pending special assessments or reserve-fund shortfalls?
- Why hasn't it sold? Are there any deal-killer items the seller is aware of (foundation, flood, title, zoning, code violations)?
- Is there a deadline driving the sale (1031 exchange, divorce, estate, relocation)? That informs how much negotiation room exists.
- Schools are D-rated, which usually means shorter tenancies and higher turnover. Who's the typical renter profile here, and what's been the actual vacancy rate?
- What's the average days-on-market for RENTAL listings here right now (not sales)? A rising rental-DOM trend means longer vacancies and softer asking-rent achievability than the comps imply.
- What's the recent tenant-quality profile in this submarket — average credit score on applications, eviction rate, late-payment / NSF rate, and stable-employment percentage? A property-management company in the area should have these aggregated.
- How much new for-sale + rental construction is in the pipeline within 1–3 miles? Heavy new supply typically softens prices + rents 12–24 months out; constrained supply supports both.
Investment metrics
- 1% rule
- 0.87% ✗
- Cap rate
- 6.31%
- Cash-on-cash
- 0.05%
- DSCR
- 1.00
- GRM
- 9.5
CMA / ARV
- ARV (median comp)
- $560,714
- List price
- $384,800
- Delta
- -31.37%
- Verdict
- UNDERPRICED
- Comps
- 20 within 1.0 mi
Show comp detail 12 sales within ~0.75 mi
| Address | Dist | Beds/Ba | Sqft | Sold | Price | $/sf | Match |
|---|---|---|---|---|---|---|---|
| 18114 97th Ave E | 0.29mi | 4/2.5 | 2,300 (+0%) | 2mo | $520,000 | $226 | 83 |
| 8709 188th Street Ct E | 0.41mi | 4/3.0 | 2,304 (+0%) | 1mo | $530,000 | $230 | 79 |
| 18551 E 96th Ave | 0.26mi | 4/2.5 | 2,166 (-6%) | 1mo | $499,950 | $231 | 76 |
| 18428 97th Avenue Ct E | 0.30mi | 3/2.5 (-1) | 2,164 (-6%) | 0mo | $545,000 | $252 | 69 |
| 17422 90th Ave E | 0.62mi | 4/2.5 | 2,304 (+0%) | 1mo | $565,000 | $245 | 67 |
| 18521 97th Ave E | 0.29mi | 3/2.5 (-1) | 2,104 (-8%) | 1mo | $537,500 | $255 | 65 |
| 9006 178th Street Ct E | 0.42mi | 3/2.5 (-1) | 2,172 (-5%) | 2mo | $575,000 | $265 | 63 |
| 8925 179th St E | 0.36mi | 4/2.5 | 2,054 (-10%) | 2mo | $580,000 | $282 | 62 |
| 8805 182nd St E | 0.36mi | 5/3.0 (+1) | 2,564 (+12%) | 2mo | $735,000 | $287 | 57 |
| 17317 94th Avenue Ct E | 0.65mi | 3/2.5 (-1) | 2,184 (-5%) | 0mo | $510,000 | $234 | 54 |
| 19623 90th Avenue Ct E | 0.75mi | 4/2.5 | 2,066 (-10%) | 2mo | $555,000 | $269 | 45 |
| 19632 91st Ave E | 0.74mi | 5/3.5 (+1) | 2,524 (+10%) | 1mo | $544,000 | $216 | 41 |
Match score weights: distance 35% · size 25% · config 20% · recency 20%. Top-matched comps best support the ARV.
Projected returns pro-forma
-3.0% appreciation · 2.79% rent growth · sell at horizon
- IRR
- -16.4%
- Equity multiple
- 0.42×
- Total profit
- $-62,714
- Equity at exit
- $57,375
- IRR
- -8.5%
- Equity multiple
- 0.47×
- Total profit
- $-56,930
- Equity at exit
- $33,270
Cash invested: $107,744 (down + closing). Projections, not guarantees.
Landlord ↔ Tenant lean methodology
- Overall (STATE)
- 28 Tenant-Leaning
- State Washington
- 28 Tenant-Leaning · D+8
- County
- — inherits STATE
- City
- — inherits STATE
ZIP-level market 98375
- Rents YoY
- 2.8%
- Active inventory
- 283
- Price-to-rent
- 9.5×
Monthly cashflow live
- Estimated rent
- $3,363 high interval (Pro) →
- Mortgage (P&I)
- −$2,018
- Tax from tax record
- −$444 /mo · $5,329/yr
- Insurance
- −$160
- HOA
- −$30
- Vacancy / Maint / Mgmt
- −$706
- Net cashflow
- $5
Break-even live
UW: 25.0% down · 7.5% · 30yr · 1.5% tax · 5.0% vac · 8.0% maint · 8.0% mgmt
Financing live
Cash to close
- Down payment
- $96,200
- Closing costs
- $11,544
- Reserves months
- —
- Total cash needed
- —
Loan-product check · same deal, 3 products live
Conventional
25% down · 7.5% · 30yr
- Down + closing
- —
- Monthly P&I
- —
- Monthly cashflow
- —
- DSCR
- —
- Eligible?
- —
Personal DTI + credit; lowest rate.
DSCR
20% down · 8.5% · 30yr
- Down + closing
- —
- Monthly P&I
- —
- Monthly cashflow
- —
- DSCR
- —
- Eligible?
- —
No personal income docs; deal must DSCR.
Hard money
10% down · 12.0% · 12mo
- Down + closing
- —
- Monthly P&I
- —
- Monthly cashflow
- —
- DSCR
- —
- Eligible?
- —
Short-term bridge; refi at stabilization.
Rent comps 25 comps
| Address | Beds | Baths | Sqft | Rent | $/sqft | DOM | Units | Dist |
|---|---|---|---|---|---|---|---|---|
| 18402 96th Ave E South Hill, WA | 4.0 | 2.5 | 2300 | $1,700 | $0.74 | 11d | 1 | 0.20mi |
| 18402 96th Ave E South Hill, WA | 4.0 | 2.5 | 2307 | $1,400 | $0.61 | 12d | 1 | 0.20mi |
| 18317 96th Ave E Puyallup, WA | 4.0 | 2.5 | 2150 | $5,500 | $2.56 | 43d | 1 | 0.22mi |
| 18511 97th Ave E Puyallup, WA | 3.0 | 2.5 | 2104 | $2,895 | $1.38 | 17d | 1 | 0.28mi |
| 17904 97th Ln E Puyallup, WA | 4.0 | 2.5 | 2995 | $3,150 | $1.05 | 1d | 1 | 0.37mi |
| 9110 178th Street Ct E Puyallup, WA | 4.0 | 3.0 | 2321 | $3,195 | $1.38 | 14d | 1 | 0.39mi |
| 10110 184th St E Puyallup, WA | 3.0 | 2.5 | 1582 | $2,595 | $1.64 | 43d | 1 | 0.55mi |
| 19605 84th Ave E Spanaway, WA | 3.0 | 2.5 | 1916 | $3,050 | $1.59 | 24d | 1 | 0.89mi |
| 10715 187th Street Ct E Puyallup, WA | 5.0 | 2.5 | 2668 | $3,200 | $1.20 | 20d | 1 | 1.05mi |
| 10508 196th Street Ct E Graham, WA | 3.0 | 2.0 | 2364 | $2,689 | $1.14 | 2d | 1 | 1.07mi |
| 18702 108th Ave E Puyallup, WA | 4.0 | 2.5 | 1833 | $3,100 | $1.69 | 1d | 1 | 1.09mi |
| 18205 110th Ave E Puyallup, WA | 5.0 | 3.0 | 2886 | $3,200 | $1.11 | 43d | 1 | 1.12mi |
| 18709 107th Ln E Puyallup, WA | 4.0 | 2.5 | 2297 | $3,500 | $1.52 | 24d | 1 | 1.13mi |
| 18709 107th Ln E Puyallup, WA | 4.0 | 2.5 | 2305 | $3,600 | $1.56 | 20d | 1 | 1.13mi |
| 18709 107th Ln E Puyallup, WA | 4.0 | 2.5 | 2297 | $3,500 | $1.52 | 19d | 1 | 1.13mi |
| 18747 108th Ave E Puyallup, WA | 4.0 | 2.0 | 1900 | $3,200 | $1.68 | 1d | 1 | 1.14mi |
| 18744 110th Ave E Unit NA Puyallup, WA | 4.0 | 2.5 | 1824 | $3,189 | $1.75 | 23d | 1 | 1.16mi |
| 7513 177th Street Ct E Puyallup, WA | 1.0–4.0 | 1.0–2.5 | 1243 | $3,210 | $2.58 | 10d | 7 | 1.20mi |
| 18225 113th Ave E Puyallup, WA | 3.0 | 2.5 | 1770 | $2,675 | $1.51 | 14d | 1 | 1.27mi |
| 7343 177th St E Puyallup, WA | 3.0 | 3.0 | 1962 | $2,795 | $1.42 | 21d | 1 | 1.29mi |
| 17908 72nd Ave E Puyallup, WA | 3.0 | 2.5 | 1719 | $1,400 | $0.81 | 24d | 1 | 1.34mi |
| 18902 Liberty Ridge Ln E Puyallup, WA | 5.0 | 2.5 | 2335 | $3,200 | $1.37 | 16d | 1 | 1.38mi |
| 18914 Liberty Ridge Ln E Puyallup, WA | 5.0 | 3.0 | 2335 | $3,400 | $1.46 | 19d | 1 | 1.40mi |
| 18314 70th Avenue Ct E Puyallup, WA | 5.0 | 3.0 | 2382 | $3,200 | $1.34 | 24d | 1 | 1.40mi |
| 11328 185th St E Puyallup, WA | 4.0 | 2.0 | 2430 | $2,995 | $1.23 | 1d | 1 | 1.42mi |
HOA detail
- Monthly dues
- $30 · $360/yr
Listing history 23 events
-
2026-06-18days on market $384,800 Active 62 DOM
-
2026-06-17days on market $384,800 Active 61 DOM
-
2026-06-16days on market $384,800 Active 60 DOM
-
2026-06-15days on market $384,800 Active 59 DOM
-
2026-06-13days on market $384,800 Active 57 DOM
-
2026-06-13days on market $384,800 Active 56 DOM
-
2026-06-09days on market $384,800 Active 53 DOM
-
2026-06-08days on market $384,800 Active 52 DOM
-
2026-06-07days on market $384,800 Active 51 DOM
-
2026-06-04days on market $384,800 Active 48 DOM
-
2026-06-03days on market $384,800 Active 47 DOM
-
2026-06-02days on market $384,800 Active 46 DOM
-
2026-06-01days on market $384,800 Active 45 DOM
-
2026-05-31days on market $384,800 Active 44 DOM
-
2026-04-17$384,800 Active
-
2021-10-20soldstatus $500,000 Closed
-
2021-09-16status Pending
-
2021-09-05historical Active Under Contract
-
2021-08-26$465,000 Active
-
2020-08-10soldstatus $270,000
-
2005-06-27soldstatus $228,790
-
2005-01-24$219,500
-
2004-11-19soldstatus $10,732,004
ⓘ Source: listings_history table (triggers on properties + properties_extension) + one-shot
backfill from property_details.listing_events for pre-trigger history.
Tax reassessment forecast WA · Resets to sale price
- Current annual tax
- $5,329 · $444/mo
- Projected year-2 tax
- $5,329 · $444/mo
- Expected delta
- $0/yr ($0/mo · 0.0%)
ⓘ Screening estimate from a state-policy table — verify with the county assessor before closing.
Climate risk First Street
- Flood 1/10 Low FEMA zone X (unshaded) · 0% chance over 30 yrs
- Wildfire 1/10 Low
- Heat 3/10 Moderate 7 d/yr ≥87°F today · 15 d/yr by 30 yrs out
- Wind 1/10 Low
- Air quality 7/10 Severe 10 unhealthy d/yr today · 10 by 30 yrs out
Nearby sold comps map
Loading sold comps map…
Walkable amenities ~0.75 mi
Loading nearby amenities…
Taxation est. · year 1
- Rental income
- $40,362
- − Mortgage interest
- −$21,555
- − Property taxes
- −$5,329
- − Insurance
- −$1,924
- − Repairs & maintenance
- −$3,229
- − Management
- −$3,229
- − HOA
- −$360
- − Depreciation
- −$11,194
- Taxable loss
- −$6,459
- Est. tax savings @ 24.0%
- +$1,550
- After-tax cash flow
- $1,607/yr
For passive investors: Depreciation is non-cash, so a rental often shows a tax loss while cash-flowing — sheltering income. Rental losses are passive: they offset passive income freely, and up to $25,000/yr can offset ordinary (W-2) income if you actively participate and your MAGI is under $100k (phasing out to $0 by $150k); unused losses carry forward. On sale, claimed depreciation is recaptured at up to 25%, and gains may owe capital-gains tax (a 1031 exchange can defer both). Figures are a year-1 estimate at your 24.0% rate — not tax advice; consult a CPA.
Schools (NCES district)
- District
- Puyallup School District
- NCES district ID
- 5306960
- Math proficiency
- 53% ▬ 0.00%
- Reading proficiency
- 66% ▬ 0.00%
- Median HH income
- $68,291
- Composite
- 54.01/100
- National rank
- #3006
- State rank
- #52 of 291 in WA
Livability — South Hill
- Score
- 80/100
- State rank
- #84
- US rank
- #1620
Category grades
Schools grade is shown separately in the Schools card above.
Census & demographics
- Census place
- South Hill, WA
- County
- Pierce County · 788,257 people
- City population
- 76,707
- Metro
- Seattle-Tacoma-Bellevue, WA
- Population (ZIP)
- 31,187
- Household income
- $117,074
- Rent vs Own
- Severe rent burden
- 541.0
Population outlook (Pierce County) Hauer SSP2
- Today (2025)
- 956,648 people
- By 2030
- 1,010,862 · +5.7%
- By 2040
- 1,113,170 · +16.4%
- By 2050
- 1,206,524 · +26.1%
- By 2075
- 1,436,425 · +50.2%
- By 2100
- 1,563,654 · +63.5%
Race, ethnicity, and origin ACS 2023
- Neighborhood character
- Diverse neighborhood (Simpson 0.64)
- Race & ethnicity
- White 57% Two or more races 22% Hispanic / Latino 13% Black 8% Asian 6% Pacific Islander 1%
- Hispanic origin (detail)
- Mexican 10% Puerto Rican 1%
- Common ancestry
- Portuguese 3% Lithuanian 3% Italian 3%
- Foreign-born
- 11% · Canada, China, South Korea
- Languages at home
- 82% English-only · Spanish 8% Other Indo-European 2% Other Asian/Pacific 2%
Political lean MEDSL · Pierce
- 2024 margin
- D (+10.8) · D 53.9% · R 43.1% · Other 3.0%
- 2008→2024 swing
- -1.4pp toward R · 2008: 12.2pp · 2024: 10.8pp
- All cycles
- 2024: D+10.8 2020: D+11.2 2016: D+7.5 2012: D+11.0 2008: D+12.2
Not yet ingested
- Civics
- —
Market trends
- HPI YoY
- ▼ -189.98%
- Current HPI
- 285.0074
- Rent YoY
- ▲ 2.79%
- Metro
- Seattle-Tacoma-Bellevue, WA
- State GDP YoY
- ▲ 4.65%
- F500 in state
- 22
Industry mix (Fortune 500 HQ in WA)
| Industry | F500 HQs | Revenue |
|---|---|---|
| Retail | 2 | $269B |
|
||
| Technology / Retail | 1 | $638B |
|
||
| Technology | 1 | $245B |
|
||
| Telecommunications | 1 | $38B |
|
||
| Food / Beverage | 1 | $36B |
|
||
| Automotive / Trucks | 1 | $34B |
|
||
Price history
-96.4% since first listed9 events — show timeline
- 2026-04-17 Listed $384,800 NWMLS as Distributed by MLS Grid
- 2021-10-20 Sold (MLS) $500,000 NWMLS as Distributed by MLS Grid
- 2021-09-16 Pending — NWMLS as Distributed by MLS Grid
- 2021-09-05 Contingent — NWMLS as Distributed by MLS Grid
- 2021-08-26 Listed $465,000 NWMLS as Distributed by MLS Grid
- 2020-08-10 Sold (Public Records) $270,000 Public Records
- 2005-06-27 Sold (MLS) $228,790 NWMLS as Distributed by MLS Grid
- 2005-01-24 Listed $219,500 NWMLS as Distributed by MLS Grid
- 2004-11-19 Sold (Public Records) $10,732,004 Public Records
Property tax history
+3.4%/yrLatest (2026): $5,329 · +1.6% YoY. Source: county tax records.
Cash-flow waterfall
monthlySold comps — $/sqft
last 12 mo · ≤1 miLoading sold comps…