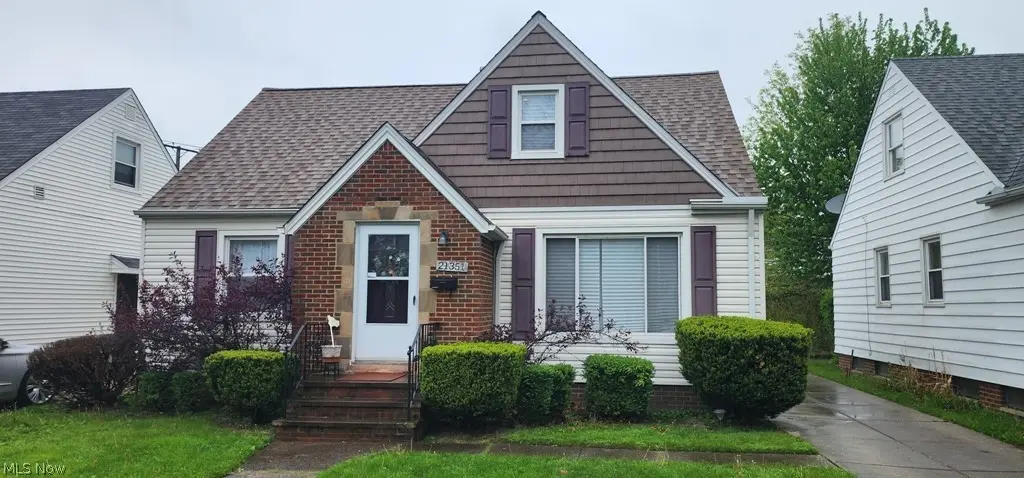
21351 Crystal Ave · Euclid, OH
Flood risk 1/10 · Minimal
- FEMA flood zone
- X (unshaded)
- Chance of flooding over 30 yrs
- 0.0%
- Est. flood insurance / yr
- $473 – $860
Fire risk 1/10 · Minimal
- Est. fire insurance / yr
- $713 – $1,323
Heat risk 3/10 · Minor
- Hot days now (above 94°F)
- 7 days/yr
- Hot days in 30 yrs
- 17 days/yr
Wind risk 1/10 · Minimal
- Chance of severe wind over 30 yrs
- —
Air-quality risk 3/10 · Minor
- Unhealthy air days now
- 3 days/yr
- Unhealthy air days in 30 yrs
- 4 days/yr
Risk factors via First Street. Map © Google.
Why this score? — see what drove the D+ grade
The composite is a weighted blend of 9 inputs, each scored 0–100. Each bar is that input's sub-score; the figure is the points it added to the 100-point composite (weight × sub-score).
- ARV discount +15.0/15.0
- Cash flow +13.2/30.0
- 1% rule +4.1/10.0
- DSCR +4.0/10.0
- Livability +3.9/5.0
- Rent growth +3.8/5.0
- Condition / age +2.5/5.0
- Schools +1.7/10.0
- Appreciation +0.0/10.0
$157,000
🖨 Deal sheet (PDF) 📄 Offer letter ✓ Due diligence
Listing remarks
Euclid, OH Cape Cod 3 bedroom 2 full baths off street parking 1 car garage. Home offers eat-in-kitchen, large living room with hardwood floors, 2 first floor bedrooms hardwood floors and full bath with ceramic tile , 2nd floor is full large bedroom with closets. Full basement with updated flooring. Laundry room and updated HVAC. Short distance to shopping and more. POS Compliant no city violations.
Key facts
- 4,948 sq ft lot
- Garage
- Built 1951
Property features AI
Exterior
- Parking: Detached paved garage (1 car)
- Utilities: Public water; Public sewer
- Home design: Two-story home; Faces south; Property listed in fixer condition
- Construction: Vinyl siding; Asphalt fiberglass roof
- Exterior features: Wood fencing; Lot dimensions approximately 45 x 110
Interior
- Bedrooms: Two main-level bedrooms
- Bathrooms: Two full bathrooms; One main-level bathroom
- Heating & cooling: Central air conditioning; Forced air gas heating
- Interior features: Full, partially finished basement; Fireplace (1)
Neighborhood map
What this means for you Summary
Snapshot
- This is a 3-bed/1.0-bath single-family listed at $157k.
Deal economics
- At list price, monthly cash flow is $-4 ($-43/yr) — negative.
- To cash-flow at today's rent, offer at most $156k (0.4% below list).
- To meet the 1% rule (rent ≥ 1% of price), the offer needs to be $143k (9.0% below list).
- Recommended offer: $143k (9.0% below list) — sets the bar for 1% rule.
Location & tenants
- Location reads 77/100 on livability (#204 in OH, #3,149 nationally) — a middle-class / working-renter tenant base. Strengths: cost of living A+, housing A+, crime B+; Watch: commute F, employment D-.
- Euclid City (suburban): math 14% / reading 28% proficiency, ranked #625 of 656 in OH (top 95%) — low school quality limits family demand, transient renter base, plan for 1-2y turnover; 70% free/reduced lunch — lower-income household profile, screen leases tightly.
- Zoned schools: Arbor Elementary School (math 17% / reading 28%, grade F, #1,239 of 1,584 statewide, top 78%, 370 students, 0% FRL); Euclid Middle School (math 10% / reading 22%, grade F, #624 of 654 statewide, top 96%, 934 students, 0% FRL); Euclid High School (math 7% / reading 33%, grade F, #675 of 781 statewide, top 87%, 1,618 students, 0% FRL) — zoned schools average 0% FRL vs 70% district-wide (70 pts lower); this property's tenant base skews higher-income than the district average.
- Market conditions: Rents rising fast (+5.3%/yr); 96 active listings in the ZIP; 40 comparable units currently listed for rent nearby; rentals at typical pace (median 23d on market — plan ~3-4 weeks tenant-placement turnaround); 1,441 units permitted in Cuyahoga County in 2024 (700 in 5+ unit buildings).
- This rent runs 31% of the median local income ($56k/yr) — at the standard rent-burdened threshold; future hikes will face affordability resistance.
Forward outlook
- Local home prices are declining (-3.0%/yr); year-one equity from $1k of loan paydown is wiped out by about $5k of value loss. Plan a longer hold.
- Cuyahoga County population projected to shrink 8% by 2050 — rents likely to lag national; underwrite the cash flow, not the appreciation.
Negotiation context
- It's been on market 24 days — a 2% lower offer ($155k) is reasonable based on typical stale-listing flexibility.
- 5 sale attempts since 17y ago with the ask held roughly flat each time — persistent listings suggest the price (not the market) is what's stuck; bring a comps-based counter.
- Current owner paid $96k; list at $157k implies a 64% gain — meaningful room to come down on a strong offer.
Risks & watch-outs
- Watch-outs: built in 1951 — expect roof / HVAC / electrical / plumbing capex.
Questions for the listing agent
- What do current leases actually rent for vs. the listed asking? Can we see a recent rent roll and the last 12 months of T-12 income?
- Built in 1951 — when were the roof, HVAC, electrical panel, plumbing, and water heater last replaced?
- Is there a deadline driving the sale (1031 exchange, divorce, estate, relocation)? That informs how much negotiation room exists.
- The area grade is low — what's the realistic commute time and amenity access for the typical tenant pool here? Any planned neighborhood developments (good or bad) we should know about?
- What's the average days-on-market for RENTAL listings here right now (not sales)? A rising rental-DOM trend means longer vacancies and softer asking-rent achievability than the comps imply.
- What's the recent tenant-quality profile in this submarket — average credit score on applications, eviction rate, late-payment / NSF rate, and stable-employment percentage? A property-management company in the area should have these aggregated.
- How much new for-sale + rental construction is in the pipeline within 1–3 miles? Heavy new supply typically softens prices + rents 12–24 months out; constrained supply supports both.
Investment metrics
- 1% rule
- 0.91% ✗
- Cap rate
- 6.27%
- Cash-on-cash
- -0.10%
- DSCR
- 1.00
- GRM
- 9.2
CMA / ARV
- ARV (on-the-fly)
- $189,318
- Comps found
- 12
Show comp detail 12 sales within ~0.75 mi
| Address | Dist | Beds/Ba | Sqft | Sold | Price | $/sf | Match |
|---|---|---|---|---|---|---|---|
| 20931 Priday | 0.14mi | 3/1.0 | 1,200 (-12%) | 2mo | $109,600 | $91 | 72 |
| 20700 Crystal Ave | 0.22mi | 4/1.5 (+1) | 1,287 (-6%) | 2mo | $109,600 | $85 | 72 |
| 21131 Morris Ave | 0.32mi | 4/1.0 (+1) | 1,440 (+6%) | 0mo | $134,500 | $93 | 70 |
| 273 E 208th St | 0.24mi | 3/1.0 | 1,174 (-14%) | 1mo | $150,000 | $128 | 65 |
| 21001 Wilmore Ave | 0.28mi | 3/1.5 | 1,202 (-12%) | 1mo | $208,000 | $173 | 65 |
| 91 E 212th St | 0.59mi | 3/2.0 | 1,393 (+2%) | 1mo | $205,000 | $147 | 64 |
| 20330 S Lake Shore Blvd | 0.34mi | 4/1.0 (+1) | 1,184 (-13%) | 0mo | $164,000 | $139 | 57 |
| 860 E 232nd St | 0.68mi | 3/1.5 | 1,288 (-5%) | 1mo | $109,000 | $85 | 56 |
| 21130 Arbor Ave | 0.56mi | 3/2.0 | 1,213 (-11%) | 2mo | $179,900 | $148 | 50 |
| 115 E 211th St | 0.54mi | 3/2.0 | 1,197 (-12%) | 1mo | $188,000 | $157 | 50 |
| 21130 Edgecliff Dr | 0.67mi | 3/1.5 | 1,502 (+10%) | 1mo | $285,000 | $190 | 49 |
| 871 E 232nd St | 0.72mi | 4/2.5 (+1) | 1,546 (+14%) | 0mo | $149,000 | $96 | 33 |
Match score weights: distance 35% · size 25% · config 20% · recency 20%. Top-matched comps best support the ARV.
Projected returns pro-forma
-3.0% appreciation · 5.28% rent growth · sell at horizon
- IRR
- -13.8%
- Equity multiple
- 0.49×
- Total profit
- $-22,264
- Equity at exit
- $23,409
- IRR
- -1.5%
- Equity multiple
- 0.88×
- Total profit
- $-5,056
- Equity at exit
- $13,574
Cash invested: $43,960 (down + closing). Projections, not guarantees.
Landlord ↔ Tenant lean methodology
- Overall (STATE)
- 73 Landlord-Friendly
- State Ohio
- 73 Landlord-Friendly · R+6
- County
- — inherits STATE
- City
- — inherits STATE
ZIP-level market 44123
- Home prices YoY
- -25.0%
- Rents YoY
- 5.3%
- Active inventory
- 96
- Price-to-rent
- 9.2×
Monthly cashflow live
- Estimated rent
- $1,429 high interval (Pro) →
- Mortgage (P&I)
- −$823
- Tax from tax record
- −$244 /mo · $2,925/yr
- Insurance
- −$65
- HOA
- −$0
- Vacancy / Maint / Mgmt
- −$300
- Net cashflow
- $-4
Break-even live
Sensitivity live
| Price | -10% $85 | -5% $41 | +0% $-4 | +5% $-48 | +10% $-92 |
|---|---|---|---|---|---|
| Rent | -10% $-116 | -5% $-60 | +0% $-4 | +5% $53 | +10% $109 |
| Rate | -1.0pp $76 | -0.5pp $36 | base $-4 | +0.5pp $-44 | +1.0pp $-86 |
UW: 25.0% down · 7.5% · 30yr · 1.5% tax · 5.0% vac · 8.0% maint · 8.0% mgmt
Financing live
Cash to close
- Down payment
- $39,250
- Closing costs
- $4,710
- Reserves months
- —
- Total cash needed
- —
Loan-product check · same deal, 3 products live
Conventional
25% down · 7.5% · 30yr
- Down + closing
- —
- Monthly P&I
- —
- Monthly cashflow
- —
- DSCR
- —
- Eligible?
- —
Personal DTI + credit; lowest rate.
DSCR
20% down · 8.5% · 30yr
- Down + closing
- —
- Monthly P&I
- —
- Monthly cashflow
- —
- DSCR
- —
- Eligible?
- —
No personal income docs; deal must DSCR.
Hard money
10% down · 12.0% · 12mo
- Down + closing
- —
- Monthly P&I
- —
- Monthly cashflow
- —
- DSCR
- —
- Eligible?
- —
Short-term bridge; refi at stabilization.
Rent comps 40 comps
| Address | Beds | Baths | Sqft | Rent | $/sqft | DOM | Units | Dist |
|---|---|---|---|---|---|---|---|---|
| 21251 S Lake Shore Blvd Euclid, OH | 3.0 | 2.0 | 1246 | $1,595 | $1.28 | 45d | 1 | 0.03mi |
| 21000 Priday Ave Euclid, OH | 3.0 | 1.0 | 1200 | $1,300 | $1.08 | 45d | 1 | 0.14mi |
| 21751 Priday Ave Euclid, OH | 3.0 | 1.0 | 1174 | $1,545 | $1.32 | 23d | 1 | 0.16mi |
| 488 E 222nd St Unit Up Euclid, OH | 2.0 | 1.0 | 900 | $1,100 | $1.22 | 23d | 1 | 0.26mi |
| 21860 Roberts Ave Euclid, OH | 3.0 | 1.0 | 1253 | $1,450 | $1.16 | 9d | 1 | 0.27mi |
| 26200 S Lake Shr Euclid, OH | 3.0 | 1.5 | 1305 | $1,225 | $0.94 | 9d | 1 | 0.27mi |
| 20500 Priday Ave Euclid, OH | 4.0 | 1.5 | 1698 | $1,750 | $1.03 | 46d | 1 | 0.29mi |
| 21271 Nicholas Ave Euclid, OH | 3.0 | 2.0 | 1300 | $1,689 | $1.30 | 45d | 1 | 0.44mi |
| 20500 Morris Ave Euclid, OH | 3.0 | 1.0 | 1104 | $1,399 | $1.27 | 45d | 1 | 0.45mi |
| 299 E 197th St Cleveland, OH | 4.0 | 2.0 | 1328 | $1,400 | $1.05 | 18d | 1 | 0.50mi |
| 22370 Tracy Ave Euclid, OH | 3.0 | 1.0 | 1202 | $1,575 | $1.31 | 18d | 1 | 0.54mi |
| 21301 Arbor Ave Euclid, OH | 3.0 | 1.0 | 1050 | $1,450 | $1.38 | 21d | 1 | 0.55mi |
| 21980 Ivan Ave Euclid, OH | 4.0 | 2.0 | 1348 | $1,350 | $1.00 | 45d | 1 | 0.57mi |
| 404 E 200th St Cleveland, OH | 2.0 | 1.0 | 884 | $1,095 | $1.24 | 45d | 1 | 0.57mi |
| 455 E 200th St Cleveland, OH | 2.0 | 1.0 | 950 | $1,150 | $1.21 | 25d | 1 | 0.61mi |
| 540 E 208th St Cleveland, OH | 2.0 | 1.0 | 1189 | $1,025 | $0.86 | 45d | 1 | 0.64mi |
| 645 Babbitt Rd Euclid, OH | 3.0 | 1.0 | 1200 | $1,400 | $1.17 | 14d | 1 | 0.68mi |
| 22501 Arms Ave Euclid, OH | 3.0 | 1.0 | 1044 | $1,350 | $1.29 | 25d | 1 | 0.69mi |
| 824 E 236th St Euclid, OH | 3.0 | 2.0 | 1100 | $1,720 | $1.56 | 3d | 1 | 0.71mi |
| 21252 Goller Ave Euclid, OH | 3.0 | 1.0 | 1161 | $1,275 | $1.10 | 22d | 1 | 0.72mi |
| 21250 Goller Ave Cleveland, OH | 3.0 | 1.0 | 1161 | $1,275 | $1.10 | 14d | 1 | 0.73mi |
| 374 E 232nd St Euclid, OH | 3.0 | 1.0 | 1222 | $1,995 | $1.63 | 45d | 1 | 0.83mi |
| 20664 Miller Ave Unit Down Unit Euclid, OH | 3.0 | 2.0 | 1100 | $1,200 | $1.09 | 45d | 1 | 0.83mi |
| 961 E 224th St Euclid, OH | 3.0 | 1.0 | 1034 | $1,300 | $1.26 | 18d | 1 | 0.84mi |
| 23214 Gay St Euclid, OH | 3.0 | 1.0 | 1634 | $1,864 | $1.14 | 25d | 1 | 0.84mi |
| 797 Babbitt Rd #22 Euclid, OH | 3.0 | 1.5 | 1360 | $1,600 | $1.18 | 45d | 1 | 0.85mi |
| 23901 Puritan Rd Euclid, OH | 3.0 | 1.0 | 1326 | $1,595 | $1.20 | 16d | 1 | 0.89mi |
| 19430 Monterey Ave Cleveland, OH | 3.0 | 1.5 | 898 | $1,236 | $1.38 | 23d | 1 | 0.89mi |
| 23307 Williams Ave Euclid, OH | 4.0 | 1.0 | 1220 | $1,700 | $1.39 | 25d | 1 | 0.91mi |
| 655 E 240th St Euclid, OH | 3.0 | 1.0 | 1341 | $1,550 | $1.16 | 45d | 1 | 0.91mi |
| 19330 Monterey Ave Cleveland, OH | 4.0 | 1.5 | 1200 | $1,450 | $1.21 | 4d | 1 | 0.91mi |
| 19330 Monterey Ave Cleveland, OH | 4.0 | 1.5 | 1578 | $1,450 | $0.92 | 3d | 1 | 0.91mi |
| 871 E 212th St Cleveland, OH | 3.0 | 1.5 | 1092 | $1,399 | $1.28 | 45d | 1 | 0.94mi |
| 18800 Pasnow Ave Cleveland, OH | 3.0 | 1.0 | 1348 | $1,350 | $1.00 | 18d | 1 | 0.96mi |
| 24200 Puritan Rd Euclid, OH | 3.0 | 1.0 | 1100 | $1,199 | $1.09 | 14d | 1 | 1.00mi |
| 884 E 248th St Euclid, OH | 3.0 | 2.0 | 1440 | $1,699 | $1.18 | 3d | 1 | 1.07mi |
| 25291 Richards Ave Euclid, OH | 4.0 | 1.0 | 1164 | $1,850 | $1.59 | 3d | 1 | 1.40mi |
| 368 E 248th St Euclid, OH | 3.0 | 1.0 | 1440 | $1,395 | $0.97 | 45d | 1 | 1.41mi |
| 101 E 238th St Euclid, OH | 2.0 | 1.0 | 959 | $1,400 | $1.46 | 16d | 1 | 1.41mi |
| 23951 Lakeshore Blvd Euclid, OH | 1.0–3.0 | 1.0–1.5 | 850 | $1,168 | $1.37 | 3d | 7 | 1.42mi |
Listing history 28 events
-
2026-06-21days on market $157,000 Active 24 DOM
-
2026-06-18days on market $157,000 Active 21 DOM
-
2026-06-17days on market $157,000 Active 20 DOM
-
2026-06-16days on market $157,000 Active 19 DOM
-
2026-06-15days on market $157,000 Active 18 DOM
-
2026-06-13remarks 401-char remark
-
2026-06-13pricedays on market $157,000 Active 16 DOM
-
2026-06-09days on market $159,000 Active 12 DOM
-
2026-06-08days on market $159,000 Active 11 DOM
-
2026-06-07days on market $159,000 Active 10 DOM
-
2026-06-05days on market $159,000 Active 7 DOM
-
2026-06-03days on market $159,000 Active 6 DOM
-
2026-06-02days on market $159,000 Active 5 DOM
-
2026-06-01days on market $159,000 Active 4 DOM
-
2026-05-31days on market $159,000 Active 3 DOM
-
2026-05-28$159,000 Active
-
2017-09-21soldstatus $96,000
-
2016-06-08historical
-
2015-12-29historical Contingent
-
2015-12-11status Pending
-
2015-12-11$64,000 Active
-
2015-10-23historical
-
2015-03-04Contingent
-
2015-01-15historical
-
2015-01-12$142,000
-
2010-05-20soldstatus $126,900
-
2010-02-19soldstatus $26,000
-
2009-12-16$39,900
ⓘ Source: listings_history table (triggers on properties + properties_extension) + one-shot
backfill from property_details.listing_events for pre-trigger history.
Tax reassessment forecast OH · Partial reset (capped growth)
- Current annual tax
- $2,925 · $244/mo
- Projected year-2 tax
- $2,925 · $244/mo
- Expected delta
- $0/yr ($0/mo · 0.0%)
ⓘ Screening estimate from a state-policy table — verify with the county assessor before closing.
Climate risk First Street
- Flood 1/10 Low FEMA zone X (unshaded) · 0% chance over 30 yrs
- Wildfire 1/10 Low
- Heat 3/10 Moderate 7 d/yr ≥94°F today · 17 d/yr by 30 yrs out
- Wind 1/10 Low
- Air quality 3/10 Moderate 3 unhealthy d/yr today · 4 by 30 yrs out
Nearby sold comps map
Loading sold comps map…
Walkable amenities ~0.75 mi
Loading nearby amenities…
Taxation est. · year 1
- Rental income
- $17,149
- − Mortgage interest
- −$8,794
- − Property taxes
- −$2,925
- − Insurance
- −$785
- − Repairs & maintenance
- −$1,372
- − Management
- −$1,372
- − Depreciation
- −$4,567
- Taxable loss
- −$2,667
- Est. tax savings @ 24.0%
- +$640
- After-tax cash flow
- $597/yr
For passive investors: Depreciation is non-cash, so a rental often shows a tax loss while cash-flowing — sheltering income. Rental losses are passive: they offset passive income freely, and up to $25,000/yr can offset ordinary (W-2) income if you actively participate and your MAGI is under $100k (phasing out to $0 by $150k); unused losses carry forward. On sale, claimed depreciation is recaptured at up to 25%, and gains may owe capital-gains tax (a 1031 exchange can defer both). Figures are a year-1 estimate at your 24.0% rate — not tax advice; consult a CPA.
Schools (NCES district)
- District
- Euclid City
- NCES district ID
- 3904395
- Math proficiency
- 14% ▼ -19.00%
- Reading proficiency
- 28% ▼ -14.00%
- Median HH income
- $36,385
- Composite
- 17.39/100
- National rank
- #9067
- State rank
- #625 of 656 in OH
Livability — Euclid
- Score
- 77/100
- State rank
- #204
- US rank
- #3149
Category grades
Schools grade is shown separately in the Schools card above.
Census & demographics
- Census place
- Euclid, OH
- County
- Cuyahoga County · 1,090,369 people
- City population
- 41,855
- Metro
- Cleveland-Elyria, OH
- Population (ZIP)
- 18,050
- Household income
- $55,676
- Rent vs Own
- Severe rent burden
- 1085.0
Population outlook (Cuyahoga County) Hauer SSP2
- Today (2025)
- 1,244,621 people
- By 2030
- 1,230,093 · -1.2%
- By 2040
- 1,189,108 · -4.5%
- By 2050
- 1,145,706 · -7.9%
- By 2075
- 1,076,557 · -13.5%
- By 2100
- 978,987 · -21.3%
Race, ethnicity, and origin ACS 2023
- Neighborhood character
- Majority Black (65%)
- Race & ethnicity
- Black 65% White 28% Two or more races 6% Hispanic / Latino 1%
- Common ancestry
- Romanian 5%
- Foreign-born
- 2% · Canada
- Languages at home
- 96% English-only · Spanish 2% Chinese 1%
Political lean MEDSL · Cuyahoga
- 2024 margin
- Solid D (+31.5) · D 65.4% · R 33.9%
- 2008→2024 swing
- -7.4pp toward R · 2008: 38.9pp · 2024: 31.5pp
- All cycles
- 2024: D+31.5 2020: D+34.1 2016: D+35.0 2012: D+38.7 2008: D+38.9
Not yet ingested
- Civics
- —
Market trends
- HPI YoY
- ▼ -62.82%
- Current HPI
- 188.4932
- Rent YoY
- ▲ 5.28%
- Metro
- Cleveland-Elyria, OH
- State GDP YoY
- ▲ 1.98%
- F500 in state
- 48
Industry mix (Fortune 500 HQ in OH)
| Industry | F500 HQs | Revenue |
|---|---|---|
| Insurance | 3 | $145B |
|
||
| Industrial Machinery | 3 | $49B |
|
||
| Financial Services | 3 | $24B |
|
||
| Consumer Goods | 2 | $93B |
|
||
| Aerospace / Defense | 2 | $47B |
|
||
| Utilities | 2 | $33B |
|
||
Price history
+298.5% since first listed13 events — show timeline
- 2026-05-28 Listed $159,000 MLSNOW
- 2017-09-21 Sold (Public Records) $96,000 Public Records
- 2016-06-08 Listing Removed — MLSNOW
- 2015-12-29 Contingent — MLSNOW
- 2015-12-11 Pending — MLSNOW
- 2015-12-11 Listed $64,000 MLSNOW
- 2015-10-23 Listing Removed — MLSNOW
- 2015-03-04 Listed — MLSNOW
- 2015-01-15 Listing Removed — MLSNOW
- 2015-01-12 Listed $142,000 MLSNOW
- 2010-05-20 Sold (Public Records) $126,900 Public Records
- 2010-02-19 Sold (MLS) $26,000 MLSNOW
- 2009-12-16 Listed $39,900 MLSNOW
Property tax history
+5.2%/yrLatest (2025): $2,925 · -2.9% YoY. Source: county tax records.
Cash-flow waterfall
monthlySold comps — $/sqft
last 12 mo · ≤1 miLoading sold comps…