 🏷️ Likely Rental
81 Camelot Ct · Daly City, CA
Flood risk 1/10 · Minimal
- FEMA flood zone
- X (unshaded)
- Chance of flooding over 30 yrs
- 0.0%
- Est. flood insurance / yr
- $473 – $860
Fire risk 1/10 · Minimal
- Est. fire insurance / yr
- $659 – $1,223
Heat risk 1/10 · Minimal
- Hot days now (above 77°F)
- 8 days/yr
- Hot days in 30 yrs
- 18 days/yr
Wind risk 1/10 · Minimal
- Chance of severe wind over 30 yrs
- —
Air-quality risk 7/10 · Major
- Unhealthy air days now
- 12 days/yr
- Unhealthy air days in 30 yrs
- 12 days/yr
Risk factors via First Street. Map © Google.
Why this score? — see what drove the D+ grade
The composite is a weighted blend of 9 inputs, each scored 0–100. Each bar is that input's sub-score; the figure is the points it added to the 100-point composite (weight × sub-score).
- Cash flow +15.0/30.0
- ARV discount +7.5/15.0
- 1% rule +5.0/10.0
- DSCR +5.0/10.0
- Rent growth +4.3/5.0
- Livability +4.1/5.0
- Schools +4.0/10.0
- Condition / age +2.5/5.0
- Appreciation +0.0/10.0
$2,500
🖨 Deal sheet 📄 Offer letter ✓ Due diligence
Listing remarks MLS
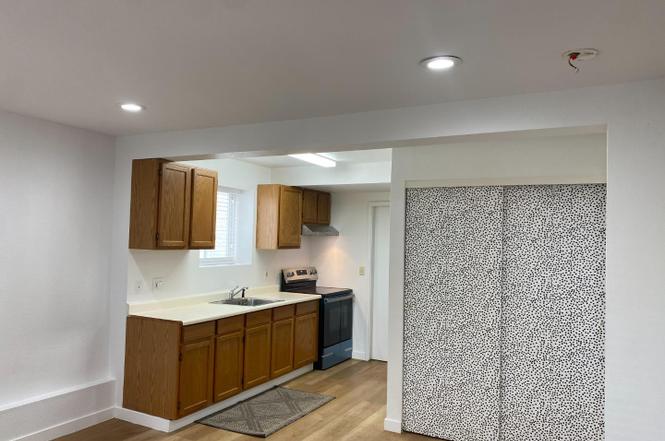
Rental One bedroom, one bath in law unit. Separate entry, one car garage attached direct access from unit,nated floors in unit laundry. New kitchen appliances, laminated floors, living room dining room combo. Enclosed patio as extra living area. Shared utilities and backyard with tenants upstairs.
Key facts
- One car garage
- In law unit
- Backyard
Tags
Property features AI
Finance
- Other: Zoned R10003
Exterior
- Parking: Attached 1-car garage with gate/door opener
- Utilities: Public water; Public sewer; Public utilities and other utilities as noted in remarks
- Home design: Detached property; Single-story
- Construction: Other-type foundation
- Exterior features: Fenced yard; Composition roof
Interior
- Kitchen: Electric cooktop; Range hood; Electric oven; Refrigerator; Other kitchen features as noted in remarks
- Bedrooms: One ground-floor bedroom with walk-in closet
- Bathrooms: One full bathroom with shower over tub
- Heating & cooling: Gas heating
- Interior features: Walk-in closet; No formal dining room; Other rooms as noted in remarks
- Laundry & utility: Washer and dryer in garage
Neighborhood map
What this means for you Summary
Snapshot
- This is a 4-bed/3.0-bath single-family listed at $2k.
Deal economics
- At list price, monthly cash flow is $4k ($45k/yr) — positive.
- The deal already cash-flows at list — no discount required.
- Meets the 1% rule at list price ($5k rent vs $2k).
- Cap rate 1801.3% vs local median 2.2% in Daly City — top-decile yield for the area; either an underpriced asset or a hidden risk that comps aren't pricing in. Stress-test before assuming the spread holds.
Location & tenants
- Location reads 82/100 on livability (#35 in CA, #1,221 nationally) — a professional / high-income tenant draw. Strengths: amenities A+, commute A+, employment A+; Watch: cost of living F.
- South San Francisco Unified (urban): math 38% / reading 47% proficiency, ranked #176 of 517 in CA (top 34%) — families likely to look elsewhere, expect single-tenant / working-renter base with shorter leases.
- Market conditions: Rents rising fast (+7.0%/yr); 31 active listings in the ZIP; 11 comparable units currently listed for rent nearby; rentals at typical pace (median 17d on market — plan ~3-4 weeks tenant-placement turnaround); 45% of comp listings sitting > 30 days — soft ceiling on asking rent; high-income renter base; 1,019 units permitted in San Mateo County in 2024 (484 in 5+ unit buildings).
- This rent runs 45% of the median local income ($127k/yr) — at the standard rent-burdened threshold; future hikes will face affordability resistance.
Forward outlook
- Local home prices are declining (-3.0%/yr); year-one equity from $17 of loan paydown is wiped out by about $75 of value loss. Plan a longer hold.
- San Mateo County population projected at +24% by 2050 — long-run rental-demand tailwind backs the buy-and-hold thesis.
- At projected returns (-3.0% appreciation + 7.0% rent growth), your $700 cash investment doubles in ~1 year — after that, you're playing with house money.
Negotiation context
- Only 1 days on market — expect competitive offers; lowballing is unlikely to land.
- 6 sale attempts with the ask held roughly flat each time — persistent listings suggest the price (not the market) is what's stuck; bring a comps-based counter.
Questions for the listing agent
- Built in 1973 — when were the roof, HVAC, electrical panel, plumbing, and water heater last replaced?
- Is there a deadline driving the sale (1031 exchange, divorce, estate, relocation)? That informs how much negotiation room exists.
- The area grade is low — what's the realistic commute time and amenity access for the typical tenant pool here? Any planned neighborhood developments (good or bad) we should know about?
- What's the average days-on-market for RENTAL listings here right now (not sales)? A rising rental-DOM trend means longer vacancies and softer asking-rent achievability than the comps imply.
- What's the recent tenant-quality profile in this submarket — average credit score on applications, eviction rate, late-payment / NSF rate, and stable-employment percentage? A property-management company in the area should have these aggregated.
- How much new for-sale + rental construction is in the pipeline within 1–3 miles? Heavy new supply typically softens prices + rents 12–24 months out; constrained supply supports both.
Investment metrics
- 1% rule
- 190.22% ✓
- Cap rate
- 1801.28%
- Cash-on-cash
- 6410.66%
- DSCR
- 286.24
- GRM
- 0.0
CMA / ARV
- ARV (on-the-fly)
- $1,562,750
- Comps found
- 12
Show comp detail 12 sales within ~0.75 mi
| Address | Dist | Beds/Ba | Sqft | Sold | Price | $/sf | Match |
|---|---|---|---|---|---|---|---|
| 276 Dennis Dr | 0.20mi | 4/2.5 | 1,690 (-3%) | 2mo | $1,550,000 | $917 | 81 |
| 96 Lycett Cir | 0.40mi | 4/3.0 | 1,760 (+1%) | 1mo | $1,630,000 | $926 | 80 |
| 3731 Bettman Way | 0.26mi | 3/2.0 (-1) | 1,680 (-4%) | 1mo | $1,370,000 | $815 | 72 |
| 3619 Bettman Way | 0.36mi | 3/2.0 (-1) | 1,680 (-4%) | 1mo | $1,210,000 | $720 | 66 |
| 104 N Lycett St | 0.51mi | 5/3.0 (+1) | 1,690 (-3%) | 0mo | $1,503,333 | $890 | 65 |
| 3836 Carter Dr | 0.58mi | 4/2.5 | 1,640 (-6%) | 1mo | $1,208,000 | $737 | 60 |
| 99 Parnell Ave | 0.67mi | 5/3.0 (+1) | 1,690 (-3%) | 1mo | $1,525,000 | $902 | 57 |
| 3730 Bettman Way | 0.25mi | 3/2.5 (-1) | 1,500 (-14%) | 1mo | $1,355,000 | $903 | 56 |
| 2405 Liberty | 0.57mi | 3/2.0 (-1) | 1,610 (-8%) | 1mo | $1,280,000 | $795 | 50 |
| 3764 Myrna Ln | 0.52mi | 3/2.5 (-1) | 1,540 (-12%) | 1mo | $1,375,000 | $893 | 48 |
| 227 Wicklow Dr | 0.66mi | 3/2.0 (-1) | 1,630 (-7%) | 2mo | $1,288,000 | $790 | 47 |
| 70 Margate St | 0.67mi | 3/2.0 (-1) | 1,490 (-15%) | 2mo | $1,400,000 | $940 | 33 |
Match score weights: distance 35% · size 25% · config 20% · recency 20%. Top-matched comps best support the ARV.
Projected returns pro-forma
-3.0% appreciation · 7.04% rent growth · sell at horizon
- IRR
- —
- Equity multiple
- 369.51×
- Total profit
- $257,956
- Equity at exit
- $373
- IRR
- —
- Equity multiple
- 888.60×
- Total profit
- $621,323
- Equity at exit
- $216
Cash invested: $700 (down + closing). Projections, not guarantees.
Landlord ↔ Tenant lean methodology
- Overall (STATE)
- 18 Strongly Tenant-Friendly
- State California
- 18 Strongly Tenant-Friendly · D+13
- County
- — inherits STATE
- City
- — inherits STATE
ZIP-level market 94015
- Rents YoY
- 7.0%
- Active inventory
- 31
Monthly cashflow live
- Estimated rent
- $4,755 high interval (Pro) →
- Mortgage (P&I)
- −$13
- Tax est. 1.5%
- −$3 /mo · $38/yr
- Insurance
- −$1
- HOA
- −$0
- Vacancy / Maint / Mgmt
- −$999
- Net cashflow
- $3,740
Break-even live
UW: 25.0% down · 7.5% · 30yr · 1.5% tax · 5.0% vac · 8.0% maint · 8.0% mgmt
Financing live
Cash to close
- Down payment
- $625
- Closing costs
- $75
- Reserves months
- —
- Total cash needed
- —
Loan-product check · same deal, 3 products live
Conventional
25% down · 7.5% · 30yr
- Down + closing
- —
- Monthly P&I
- —
- Monthly cashflow
- —
- DSCR
- —
- Eligible?
- —
Personal DTI + credit; lowest rate.
DSCR
20% down · 8.5% · 30yr
- Down + closing
- —
- Monthly P&I
- —
- Monthly cashflow
- —
- DSCR
- —
- Eligible?
- —
No personal income docs; deal must DSCR.
Hard money
10% down · 12.0% · 12mo
- Down + closing
- —
- Monthly P&I
- —
- Monthly cashflow
- —
- DSCR
- —
- Eligible?
- —
Short-term bridge; refi at stabilization.
Rent comps 11 comps
| Address | Beds | Baths | Sqft | Rent | $/sqft | DOM | Units | Dist |
|---|---|---|---|---|---|---|---|---|
| 26 Camelot Ct Daly City, CA | 3.0 | 2.0 | 1260 | $4,395 | $3.49 | 44d | 1 | 0.03mi |
| 2210 Gellert Blvd #5405 South San Francisco, CA | 3.0 | 2.0 | 1290 | $4,250 | $3.29 | 2d | 1 | 0.37mi |
| 643 Gellert Blvd Daly City, CA | 3.0 | 2.0 | 1420 | $5,250 | $3.70 | 10d | 1 | 0.58mi |
| 258 Canterbury Ave Daly City, CA | 3.0 | 2.0 | 1230 | $4,900 | $3.98 | 17d | 1 | 0.62mi |
| 225 Alta Mesa Dr South San Francisco, CA | 3.0 | 1.0 | 1230 | $5,100 | $4.15 | 44d | 1 | 0.70mi |
| 126 Serra Ln Daly City, CA | 4.0 | 3.0 | 2360 | $5,500 | $2.33 | 44d | 1 | 0.81mi |
| 781 Alta Loma Dr South San Francisco, CA | 3.0 | 2.0 | 1700 | $5,995 | $3.53 | 44d | 1 | 0.99mi |
| 7 Cymbidium Cir South San Francisco, CA | 4.0 | 2.5 | 1880 | $6,250 | $3.32 | 4d | 1 | 1.05mi |
| 437 Norfolk Dr Pacifica, CA | 3.0 | 2.0 | 1550 | $12,800 | $8.26 | 2d | 1 | 1.19mi |
| 519 Farallon Ave Pacifica, CA | 3.0 | 3.0 | 2500 | $7,250 | $2.90 | 2d | 1 | 1.36mi |
| 1224 Baywood Ave South San Francisco, CA | 4.0 | 3.0 | 2100 | $5,995 | $2.85 | 44d | 1 | 1.39mi |
Listing history 3 events
-
2026-06-17$2,500 Active 1 DOM
-
2026-06-16remarks 299-char remark
Show marketing remark (298 chars)
Rental One bedroom, one bath in law unit. Separate entry, one car garage attached direct access from unit,nated floors in unit laundry. New kitchen appliances, laminated floors, living room dining room combo. Enclosed patio as extra living area. Shared utilities and backyard with tenants upstairs.
-
2026-06-16$2,500 Active 1 DOM
Show marketing remark (298 chars)
Rental One bedroom, one bath in law unit. Separate entry, one car garage attached direct access from unit,nated floors in unit laundry. New kitchen appliances, laminated floors, living room dining room combo. Enclosed patio as extra living area. Shared utilities and backyard with tenants upstairs.
ⓘ Source: listings_history table (triggers on properties + properties_extension) + one-shot
backfill from property_details.listing_events for pre-trigger history.
Climate risk First Street
- Flood 1/10 Low FEMA zone X (unshaded) · 0% chance over 30 yrs
- Wildfire 1/10 Low
- Heat 1/10 Low 8 d/yr ≥77°F today · 18 d/yr by 30 yrs out
- Wind 1/10 Low
- Air quality 7/10 Severe 12 unhealthy d/yr today · 12 by 30 yrs out
Nearby sold comps map
Loading sold comps map…
Walkable amenities ~0.75 mi
Loading nearby amenities…
Taxation est. · year 1
- Rental income
- $57,066
- − Mortgage interest
- −$140
- − Property taxes
- −$38
- − Insurance
- −$12
- − Repairs & maintenance
- −$4,565
- − Management
- −$4,565
- − Depreciation
- −$73
- Taxable income
- $47,672
- Est. tax owed @ 24.0%
- −$11,441
- After-tax cash flow
- $33,433/yr
For passive investors: Depreciation is non-cash, so a rental often shows a tax loss while cash-flowing — sheltering income. Rental losses are passive: they offset passive income freely, and up to $25,000/yr can offset ordinary (W-2) income if you actively participate and your MAGI is under $100k (phasing out to $0 by $150k); unused losses carry forward. On sale, claimed depreciation is recaptured at up to 25%, and gains may owe capital-gains tax (a 1031 exchange can defer both). Figures are a year-1 estimate at your 24.0% rate — not tax advice; consult a CPA.
Schools (NCES district)
- District
- South San Francisco Unified
- NCES district ID
- 0637530
- Math proficiency
- 38% ▼ -6.00%
- Reading proficiency
- 47% ▼ -5.00%
- Median HH income
- $82,986
- Composite
- 39.69/100
- National rank
- #3905
- State rank
- #176 of 517 in CA
Livability — Daly City
- Score
- 82/100
- State rank
- #35
- US rank
- #1221
Category grades
Schools grade is shown separately in the Schools card above.
Census & demographics
- Census place
- Daly City, CA
- County
- San Mateo County · 733,415 people
- City population
- 109,406
- Metro
- San Francisco-Oakland-Berkeley, CA
- Population (ZIP)
- 64,091
- Household income
- $127,056
- Rent vs Own
- Severe rent burden
- 2344.0
Population outlook (San Mateo County) Hauer SSP2
- Today (2025)
- 864,008 people
- By 2030
- 910,523 · +5.4%
- By 2040
- 997,285 · +15.4%
- By 2050
- 1,071,189 · +24.0%
- By 2075
- 1,197,206 · +38.6%
- By 2100
- 1,192,523 · +38.0%
Race, ethnicity, and origin ACS 2023
- Neighborhood character
- Diverse neighborhood (Simpson 0.59)
- Race & ethnicity
- Asian 60% Hispanic / Latino 16% White 15% Two or more races 10% Black 3% Pacific Islander 1% Native American 1%
- Hispanic origin (detail)
- Mexican 6%
- Common ancestry
- Lithuanian 1% Italian 1% Estonian 1%
- Foreign-born
- 47% · China, Canada, Philippines
- Languages at home
- 42% English-only · Tagalog/Filipino 21% Chinese 15% Spanish 10%
Political lean MEDSL · San Mateo
- 2024 margin
- Solid D (+50.3) · D 73.5% · R 23.2% · Other 3.3%
- 2008→2024 swing
- +1.6pp toward D · 2008: 48.7pp · 2024: 50.3pp
- All cycles
- 2024: D+50.3 2020: D+57.7 2016: D+57.7 2012: D+44.8 2008: D+48.7
Not yet ingested
- Civics
- —
Market trends
- HPI YoY
- ▼ -1094.07%
- Current HPI
- 323.7212
- Rent YoY
- ▲ 7.04%
- Metro
- San Francisco-Oakland-Berkeley, CA
- State GDP YoY
- ▲ 3.21%
- F500 in state
- 116
Industry mix (Fortune 500 HQ in CA)
| Industry | F500 HQs | Revenue |
|---|---|---|
| Technology | 27 | $1,492B |
|
||
| Financial Services | 3 | $174B |
|
||
| Retail | 3 | $44B |
|
||
| Insurance | 3 | $26B |
|
||
| Media / Entertainment | 2 | $115B |
|
||
| Pharmaceuticals / Biotech | 2 | $62B |
|
||
Price history
-98.9% since first listed12 events — show timeline
- 2026-06-16 Listed $2,500 MLSListings
- 2026-06-16 Listed $2,500 bridgeMLS, Bay East AOR, or Contra Costa AOR
- 2026-05-24 Rental Removed $4,000 MLSLISTINGS
- 2026-05-24 Listed for Rent $4,000 MLSLISTINGS
- 2026-05-23 Rental Removed $4,250 BRIDGEMLS
- 2026-05-09 Listed for Rent $4,250 BRIDGEMLS
- 2026-04-06 Rental Removed $4,250 SHOWMOJO
- 2026-03-31 Listed for Rent $4,250 SHOWMOJO
- 2026-03-15 Rental Removed $4,000 BRIDGEMLS
- 2026-02-18 Price Changed $4,000 BRIDGEMLS
- 2026-01-24 Listed for Rent $4,250 BRIDGEMLS
- 1995-12-05 Sold (Public Records) $237,000 Public Records
Property tax history
+1.8%/yrLatest (2025): $5,150 · -4.0% YoY. Source: county tax records.
Cash-flow waterfall
monthlySold comps — $/sqft
last 12 mo · ≤1 miLoading sold comps…