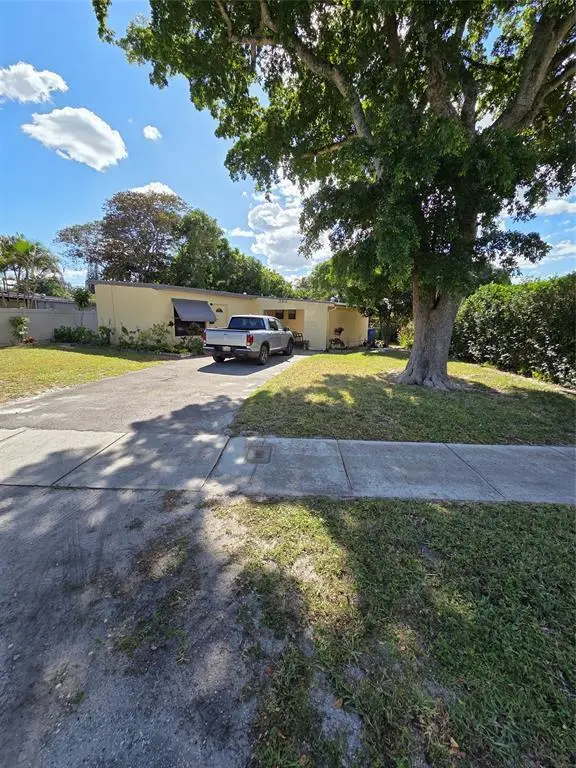
3312 SW 15th St · Fort Lauderdale, FL
Flood risk 4/10 · Minor
- FEMA flood zone
- AH
- Chance of flooding over 30 yrs
- 0.22%
- Est. flood insurance / yr
- $1,142 – $2,507
Fire risk 1/10 · Minimal
- Est. fire insurance / yr
- $947 – $1,759
Heat risk 10/10 · Severe
- Hot days now (above 105°F)
- 7 days/yr
- Hot days in 30 yrs
- 26 days/yr
Wind risk 10/10 · Severe
- Chance of severe wind over 30 yrs
- 99.0%
Air-quality risk 2/10 · Minimal
- Unhealthy air days now
- 2 days/yr
- Unhealthy air days in 30 yrs
- 2 days/yr
Risk factors via First Street. Map © Google.
Why this score? — see what drove the D+ grade
The composite is a weighted blend of 9 inputs, each scored 0–100. Each bar is that input's sub-score; the figure is the points it added to the 100-point composite (weight × sub-score).
- Cash flow +15.2/30.0
- ARV discount +9.5/15.0
- DSCR +4.7/10.0
- Schools +4.1/10.0
- Livability +4.1/5.0
- 1% rule +2.9/10.0
- Rent growth +2.8/5.0
- Condition / age +2.5/5.0
- Appreciation +0.0/10.0
$410,000
🖨 Deal sheet 📄 Offer letter ✓ Due diligence
Listing remarks
Subject to court approval
Key facts
- 7,700 sq ft lot
- 3 parking spots
- Built 1953
Neighborhood map
What this means for you Summary
Snapshot
- This is a 3-bed/2.0-bath single-family listed at $410k.
Deal economics
- At list price, monthly cash flow is $-9 ($-110/yr) — negative.
- To cash-flow at today's rent, offer at most $408k (0.4% below list).
- To meet the 1% rule (rent ≥ 1% of price), the offer needs to be $325k (20.8% below list).
- Recommended offer: $325k (20.8% below list) — sets the bar for 1% rule.
- Cap rate 6.7% vs local median 2.2% in Fort Lauderdale — top-decile yield for the area; either an underpriced asset or a hidden risk that comps aren't pricing in. Stress-test before assuming the spread holds.
Location & tenants
- Location reads 82/100 on livability (#78 in FL, #1,293 nationally) — a professional / high-income tenant draw. Strengths: crime A+, amenities A+, health & safety A+; Watch: cost of living D-.
- Broward (suburban): math 42% / reading 53% proficiency, ranked #46 of 73 in FL (top 63%) — families likely to look elsewhere, expect single-tenant / working-renter base with shorter leases.
- Zoned schools: Stephen Foster Elementary School (math 28% / reading 35%, grade F, #1,841 of 2,144 statewide, top 86%, 691 students, 75% FRL); New River Middle School (math 36% / reading 44%, grade F, #368 of 571 statewide, top 65%, 1,587 students, 70% FRL); Stranahan High School (math 18% / reading 36%, grade F, #478 of 667 statewide, top 73%, 1,438 students, 77% FRL) — zoned schools average 74% FRL vs 51% district-wide (23 pts higher); higher-poverty schools than district average — tighter screening recommended.
- Zoned-school proficiency averages 33% at this address vs 48% district-wide (-15 pts) — the specific schools serving this property underperform the Broward average; the district grade overstates school quality for this exact location.
- Market conditions: Rents rising (+1.3%/yr); 412 active listings in the ZIP; 40 comparable units currently listed for rent nearby; rentals at typical pace (median 24d on market — plan ~3-4 weeks tenant-placement turnaround); solid renter incomes; 2,111 units permitted in Broward County in 2024 (1,265 in 5+ unit buildings).
Forward outlook
- Local home prices are declining (-3.0%/yr); year-one equity from $3k of loan paydown is wiped out by about $12k of value loss. Plan a longer hold.
- Broward County population projected at +34% by 2050 — long-run rental-demand tailwind backs the buy-and-hold thesis.
Negotiation context
- Only 5 days on market — expect competitive offers; lowballing is unlikely to land.
- 2 sale attempts since 9y ago with the ask held roughly flat each time — persistent listings suggest the price (not the market) is what's stuck; bring a comps-based counter.
- Current owner paid $58k; list at $410k implies a 607% gain — meaningful room to come down on a strong offer.
Risks & watch-outs
- Watch-outs: flood insurance adds $152/mo; built in 1953 — expect roof / HVAC / electrical / plumbing capex.
- Climate carrying-cost: in FEMA flood zone AH (mandatory federal flood insurance); severe wind risk, 99% chance of damaging wind over 30y; extreme-heat days projected 7→26/yr by 2055 (HVAC capex compounding) — expect insurance premiums to compound above CPI over the hold.
Questions for the listing agent
- What do current leases actually rent for vs. the listed asking? Can we see a recent rent roll and the last 12 months of T-12 income?
- Built in 1953 — when were the roof, HVAC, electrical panel, plumbing, and water heater last replaced?
- What's the actual annual flood-insurance premium (NFIP or private), and is the property in a SFHA with mandatory coverage?
- Is there a deadline driving the sale (1031 exchange, divorce, estate, relocation)? That informs how much negotiation room exists.
- Schools are B-rated — typically a magnet for longer-tenancy family renters. What's the average tenant stay here, and is there a school-zone premium baked into asking?
- The area grade is low — what's the realistic commute time and amenity access for the typical tenant pool here? Any planned neighborhood developments (good or bad) we should know about?
- What's the average days-on-market for RENTAL listings here right now (not sales)? A rising rental-DOM trend means longer vacancies and softer asking-rent achievability than the comps imply.
- What's the recent tenant-quality profile in this submarket — average credit score on applications, eviction rate, late-payment / NSF rate, and stable-employment percentage? A property-management company in the area should have these aggregated.
- How much new for-sale + rental construction is in the pipeline within 1–3 miles? Heavy new supply typically softens prices + rents 12–24 months out; constrained supply supports both.
Investment metrics
- 1% rule
- 0.79% ✗
- Cap rate
- 6.71%
- Cash-on-cash
- 1.49%
- DSCR
- 1.07
- GRM
- 10.5
CMA / ARV
- ARV (on-the-fly)
- $429,120
- Comps found
- 12
Show comp detail 12 sales within ~0.75 mi
| Address | Dist | Beds/Ba | Sqft | Sold | Price | $/sf | Match |
|---|---|---|---|---|---|---|---|
| 1390 SW 34th Ave | 0.14mi | 3/2.0 | 1,237 (+4%) | 1mo | $350,000 | $283 | 86 |
| 3471 SW 15 Ct | 0.23mi | 3/1.0 | 1,223 (+3%) | 3mo | $355,000 | $290 | 79 |
| 3241 SW 19th St | 0.27mi | 2/2.0 (-1) | 1,133 (-5%) | 5mo | $408,000 | $360 | 69 |
| 3717 SW 16th Ct | 0.47mi | 3/2.0 | 1,176 (-1%) | 12mo | $525,000 | $446 | 66 |
| 1810 SW 37th Ter | 0.53mi | 3/2.0 | 1,204 (+1%) | 12mo | $500,000 | $415 | 64 |
| 2860 SW 13th St | 0.50mi | 3/2.0 | 1,116 (-6%) | 12mo | $360,000 | $323 | 56 |
| 1249 SW 35th Ave | 0.37mi | 3/2.0 | 1,365 (+14%) | 4mo | $430,000 | $315 | 55 |
| 3544 SW 12th Ct | 0.46mi | 3/2.0 | 1,128 (-5%) | 19mo | $350,000 | $310 | 53 |
| 2333 SW 34th Way | 0.66mi | 2/2.0 (-1) | 1,238 (+4%) | 6mo | $489,500 | $395 | 53 |
| 1031 Alabama Ave | 0.50mi | 2/1.0 (-1) | 1,090 (-9%) | 15mo | $387,000 | $355 | 41 |
| 3629 SW 23rd Ct | 0.75mi | 3/2.0 | 1,094 (-8%) | 19mo | $425,000 | $388 | 36 |
| 1632 SW 28th Ave | 0.64mi | 3/2.0 | 1,314 (+10%) | 22mo | $550,000 | $419 | 34 |
Match score weights: distance 35% · size 25% · config 20% · recency 20%. Top-matched comps best support the ARV.
Projected returns pro-forma
-3.0% appreciation · 1.3% rent growth · sell at horizon
- IRR
- -18.2%
- Equity multiple
- 0.37×
- Total profit
- $-72,593
- Equity at exit
- $61,132
- IRR
- -14.0%
- Equity multiple
- 0.25×
- Total profit
- $-86,073
- Equity at exit
- $35,449
Cash invested: $114,800 (down + closing). Projections, not guarantees.
Landlord ↔ Tenant lean methodology
- Overall (STATE)
- 87 Strongly Landlord-Friendly
- State Florida
- 87 Strongly Landlord-Friendly · R+3
- County
- — inherits STATE
- City
- — inherits STATE
ZIP-level market 33312
- Rents YoY
- 1.3%
- Active inventory
- 412
- Price-to-rent
- 10.5×
Monthly cashflow live
- Estimated rent
- $3,248 high interval (Pro) →
- Mortgage (P&I)
- −$2,150
- Tax from tax record
- −$102 /mo · $1,221/yr
- Insurance
- −$171
- Flood insurance flood zone
- −$152 /mo · $1,824/yr
- HOA
- −$0
- Vacancy / Maint / Mgmt
- −$682
- Net cashflow
- $-9
Break-even live
UW: 25.0% down · 7.5% · 30yr · 1.5% tax · 5.0% vac · 8.0% maint · 8.0% mgmt
Financing live
Cash to close
- Down payment
- $102,500
- Closing costs
- $12,300
- Reserves months
- —
- Total cash needed
- —
Loan-product check · same deal, 3 products live
Conventional
25% down · 7.5% · 30yr
- Down + closing
- —
- Monthly P&I
- —
- Monthly cashflow
- —
- DSCR
- —
- Eligible?
- —
Personal DTI + credit; lowest rate.
DSCR
20% down · 8.5% · 30yr
- Down + closing
- —
- Monthly P&I
- —
- Monthly cashflow
- —
- DSCR
- —
- Eligible?
- —
No personal income docs; deal must DSCR.
Hard money
10% down · 12.0% · 12mo
- Down + closing
- —
- Monthly P&I
- —
- Monthly cashflow
- —
- DSCR
- —
- Eligible?
- —
Short-term bridge; refi at stabilization.
Rent comps 40 comps
| Address | Beds | Baths | Sqft | Rent | $/sqft | DOM | Units | Dist |
|---|---|---|---|---|---|---|---|---|
| 3138 SW 15th St Fort Lauderdale, FL | 3.0 | 2.0 | 1456 | $9,000 | $6.18 | 7d | 1 | 0.06mi |
| 3138 SW 15th St Fort Lauderdale, FL | 3.0 | 2.0 | 1456 | $9,000 | $6.18 | 24d | 1 | 0.06mi |
| 1340 SW 34th Ave Fort Lauderdale, FL | 3.0 | 1.0 | 1185 | $2,400 | $2.03 | 7d | 1 | 0.18mi |
| 1340 SW 34th Ave Fort Lauderdale, FL | 3.0 | 1.0 | 1185 | $2,600 | $2.19 | 24d | 1 | 0.18mi |
| 1320 SW 34th Ave #2 Fort Lauderdale, FL | 2.0 | 2.0 | 898 | $2,650 | $2.95 | 24d | 1 | 0.20mi |
| 1320 SW 34th Ave Unit 1 Fort Lauderdale, FL | 2.0 | 1.0 | 899 | $2,350 | $2.61 | 24d | 1 | 0.20mi |
| 3421 SW 12th Ct Fort Lauderdale, FL | 3.0 | 1.0 | 1500 | $2,850 | $1.90 | 18d | 1 | 0.38mi |
| 3160 SW 20th Ct Fort Lauderdale, FL | 4.0 | 3.0 | 1405 | $5,500 | $3.91 | 7d | 1 | 0.41mi |
| 3616 SW 14th St Fort Lauderdale, FL | 3.0 | 1.0 | 1000 | $3,000 | $3.00 | 24d | 1 | 0.45mi |
| 2927 SW 19th St Unit 1-2 Fort Lauderdale, FL | 2.0 | 1.0 | 779 | $2,500 | $3.21 | 24d | 1 | 0.47mi |
| 1172 Arizona Ave Fort Lauderdale, FL | 3.0 | 2.0 | 1176 | $3,200 | $2.72 | 24d | 1 | 0.50mi |
| 1250 SW 28th Way Fort Lauderdale, FL | 2.0 | 1.0 | 1200 | $2,100 | $1.75 | 24d | 1 | 0.51mi |
| 1773 SW 28th Way Fort Lauderdale, FL | 3.0 | 2.0 | 1430 | $4,350 | $3.04 | 24d | 1 | 0.52mi |
| 3700 SW 13th Ct Unit 3700 Fort Lauderdale, FL | 3.0 | 2.0 | 1035 | $3,200 | $3.09 | 24d | 1 | 0.53mi |
| 1754 SW 28th Ter Fort Lauderdale, FL | 3.0 | 2.0 | 1432 | $6,750 | $4.71 | 7d | 1 | 0.60mi |
| 2317 SW 34th Ave Fort Lauderdale, FL | 3.0 | 2.0 | 1330 | $3,600 | $2.71 | 7d | 1 | 0.62mi |
| 1632 SW 28th Ave Fort Lauderdale, FL | 3.0 | 2.0 | 1314 | $4,400 | $3.35 | 24d | 1 | 0.63mi |
| 830 E Evanston Cir Fort Lauderdale, FL | 3.0 | 2.0 | 1361 | $2,680 | $1.97 | 24d | 1 | 0.65mi |
| 3906 SW 12th Ct Fort Lauderdale, FL | 2.0 | 1.0 | 750 | $2,000 | $2.67 | 7d | 1 | 0.72mi |
| 2407 Nassau Ln Fort Lauderdale, FL | 3.0 | 2.0 | 1495 | $5,000 | $3.34 | 4d | 1 | 0.84mi |
| 2407 Nassau Ln Fort Lauderdale, FL | 3.0 | 2.0 | 1495 | $5,000 | $3.34 | 24d | 1 | 0.84mi |
| 1440 SW 41st Ave Unit A Fort Lauderdale, FL | 2.0 | 1.0 | 815 | $2,100 | $2.58 | 24d | 1 | 0.85mi |
| 1712 SW 40th Ter Unit 1712 Fort Lauderdale, FL | 3.0 | 2.0 | 1300 | $2,500 | $1.92 | 24d | 1 | 0.85mi |
| 1651 SW 40th Ter Unit A Fort Lauderdale, FL | 3.0 | 2.5 | 1300 | $3,400 | $2.62 | 24d | 1 | 0.86mi |
| 1651 SW 40th Ter Unit 1 Fort Lauderdale, FL | 3.0 | 2.5 | 1300 | $2,700 | $2.08 | 24d | 1 | 0.86mi |
| 2101 Riverland Rd Fort Lauderdale, FL | 3.0 | 1.0 | 1000 | $3,700 | $3.70 | 24d | 1 | 0.87mi |
| 630 SW 28th Dr Fort Lauderdale, FL | 3.0 | 2.0 | 1467 | $3,300 | $2.25 | 24d | 1 | 0.88mi |
| 2524 Gulfstream Ln Fort Lauderdale, FL | 3.0 | 2.0 | 1124 | $4,500 | $4.00 | 24d | 1 | 0.89mi |
| 2531 Gulfstream Ln Fort Lauderdale, FL | 2.0 | 3.0 | 1445 | $3,999 | $2.77 | 2d | 1 | 0.91mi |
| 1389 SW 24th Ave Fort Lauderdale, FL | 3.0 | 2.0 | 1339 | $2,630 | $1.96 | 24d | 1 | 0.92mi |
| 2506 Bimini Ln Fort Lauderdale, FL | 3.0 | 1.0 | 936 | $5,500 | $5.88 | 24d | 1 | 0.93mi |
| 2360 SW 15th St Fort Lauderdale, FL | 2.0 | 1.0 | 1051 | $2,900 | $2.76 | 19d | 1 | 0.95mi |
| 2030 SW 41st Ave Unit 3 Fort Lauderdale, FL | 2.0 | 1.0 | 1400 | $2,400 | $1.71 | 24d | 1 | 0.96mi |
| 2724 SW 34th Ave Unit 2 Fort Lauderdale, FL | 3.0 | 2.0 | 1350 | $3,500 | $2.59 | 24d | 1 | 1.00mi |
| 1704 SW 43rd Ave Fort Lauderdale, FL | 4.0 | 2.0 | 1280 | $3,300 | $2.58 | 24d | 1 | 1.00mi |
| 2611 SW 9th St Fort Lauderdale, FL | 2.0 | 1.0 | 790 | $1,850 | $2.34 | 24d | 1 | 1.00mi |
| 2512 Sugarloaf Ln Fort Lauderdale, FL | 2.0 | 1.0 | 936 | $4,500 | $4.81 | 24d | 1 | 1.00mi |
| 1838 SW 24th Ave Fort Lauderdale, FL | 3.0 | 2.0 | 1326 | $3,100 | $2.34 | 24d | 1 | 1.02mi |
| 2825 SW 5th St Fort Lauderdale, FL | 3.0 | 1.0 | 1311 | $3,000 | $2.29 | 24d | 1 | 1.04mi |
| 1870 SW 42nd Ter Fort Lauderdale, FL | 3.0 | 2.0 | 1460 | $3,400 | $2.33 | 7d | 1 | 1.07mi |
Listing history 6 events
-
2026-04-08status Pending
-
2026-04-03$410,000 Active
-
2017-06-07historical
-
2017-01-06$224,995 Active
-
1985-11-01soldstatus $58,000
-
1976-08-01soldstatus $31,500
ⓘ Source: listings_history table (triggers on properties + properties_extension) + one-shot
backfill from property_details.listing_events for pre-trigger history.
Tax reassessment forecast FL · Resets to sale price
- Current annual tax
- $1,221 · $102/mo
- Projected year-2 tax
- $3,403 · $284/mo
- Expected delta
- +$2,182/yr (+$182/mo · 178.7%)
ⓘ Screening estimate from a state-policy table — verify with the county assessor before closing.
Climate risk First Street
- Flood 4/10 Moderate FEMA zone AH · 22% chance over 30 yrs
- Wildfire 1/10 Low
- Heat 10/10 Extreme 7 d/yr ≥105°F today · 26 d/yr by 30 yrs out
- Wind 10/10 Extreme 99% chance of damaging wind over 30 yrs
- Air quality 2/10 Low 2 unhealthy d/yr today · 2 by 30 yrs out
Nearby sold comps map
Loading sold comps map…
Walkable amenities ~0.75 mi
Loading nearby amenities…
Taxation est. · year 1
- Rental income
- $38,970
- − Mortgage interest
- −$22,966
- − Property taxes
- −$1,221
- − Insurance
- −$3,874
- − Repairs & maintenance
- −$3,118
- − Management
- −$3,118
- − Depreciation
- −$11,927
- Taxable loss
- −$7,254
- Est. tax savings @ 24.0%
- +$1,741
- After-tax cash flow
- $1,631/yr
For passive investors: Depreciation is non-cash, so a rental often shows a tax loss while cash-flowing — sheltering income. Rental losses are passive: they offset passive income freely, and up to $25,000/yr can offset ordinary (W-2) income if you actively participate and your MAGI is under $100k (phasing out to $0 by $150k); unused losses carry forward. On sale, claimed depreciation is recaptured at up to 25%, and gains may owe capital-gains tax (a 1031 exchange can defer both). Figures are a year-1 estimate at your 24.0% rate — not tax advice; consult a CPA.
Schools (NCES district)
- District
- Broward
- NCES district ID
- 1200180
- Math proficiency
- 42% ▼ -18.00%
- Reading proficiency
- 53% ▼ -5.00%
- Median HH income
- $52,139
- Composite
- 40.88/100
- National rank
- #3621
- State rank
- #46 of 73 in FL
Livability — Fort Lauderdale
- Score
- 82/100
- State rank
- #78
- US rank
- #1293
Category grades
Schools grade is shown separately in the Schools card above.
Census & demographics
- Census place
- Fort Lauderdale, FL
- County
- Broward County · 1,963,430 people
- City population
- 235,769
- Metro
- Miami-Fort Lauderdale-Pompano Beach, FL
- Population (ZIP)
- 52,798
- Household income
- $75,952
- Rent vs Own
- Severe rent burden
- 1903.0
Population outlook (Broward County) Hauer SSP2
- Today (2025)
- 2,207,033 people
- By 2030
- 2,360,704 · +7.0%
- By 2040
- 2,661,208 · +20.6%
- By 2050
- 2,946,698 · +33.5%
- By 2075
- 3,602,273 · +63.2%
- By 2100
- 3,970,984 · +79.9%
Race, ethnicity, and origin ACS 2023
- Neighborhood character
- Highly diverse neighborhood (Simpson 0.70)
- Race & ethnicity
- White 34% Hispanic / Latino 32% Black 29% Two or more races 20% Asian 2%
- Hispanic origin (detail)
- Mexican 2% Puerto Rican 5% Cuban 6% Salvadoran 1%
- Common ancestry
- Hispanic 6% Romanian 3% Italian 1%
- Foreign-born
- 33% · Canada, Jamaica, Dominican Republic
- Languages at home
- 59% English-only · Spanish 29% French/Haitian/Cajun 7% Other Indo-European 2%
Political lean MEDSL · Broward
- 2024 margin
- D (+17.0) · D 58.0% · R 41.0%
- 2008→2024 swing
- -17.8pp toward R · 2008: 34.7pp · 2024: 17.0pp
- All cycles
- 2024: D+17.0 2020: D+29.8 2016: D+35.0 2012: D+34.9 2008: D+34.7
Not yet ingested
- Civics
- —
Market trends
- HPI YoY
- ▼ -323.99%
- Current HPI
- 382.6298
- Rent YoY
- ▲ 1.30%
- Metro
- Miami-Fort Lauderdale-Pompano Beach, FL
- State GDP YoY
- ▲ 3.28%
- F500 in state
- 36
Industry mix (Fortune 500 HQ in FL)
| Industry | F500 HQs | Revenue |
|---|---|---|
| Industrial Technology | 2 | $29B |
|
||
| Insurance | 2 | $17B |
|
||
| Retail | 1 | $60B |
|
||
| Technology Distribution | 1 | $58B |
|
||
| Homebuilding | 1 | $35B |
|
||
| Technology Manufacturing | 1 | $35B |
|
||
Price history
+1201.6% since first listed6 events — show timeline
- 2026-04-08 Pending — Beaches MLS
- 2026-04-03 Listed $410,000 Beaches MLS
- 2017-06-07 Listing Removed — MARMLS
- 2017-01-06 Listed $224,995 MARMLS
- 1985-11-01 Sold (Public Records) $58,000 Public Records
- 1976-08-01 Sold (Public Records) $31,500 Public Records
Property tax history
+3.8%/yrLatest (2025): $1,221 · +13.0% YoY. Source: county tax records.
Cash-flow waterfall
monthlySold comps — $/sqft
last 12 mo · ≤1 miLoading sold comps…