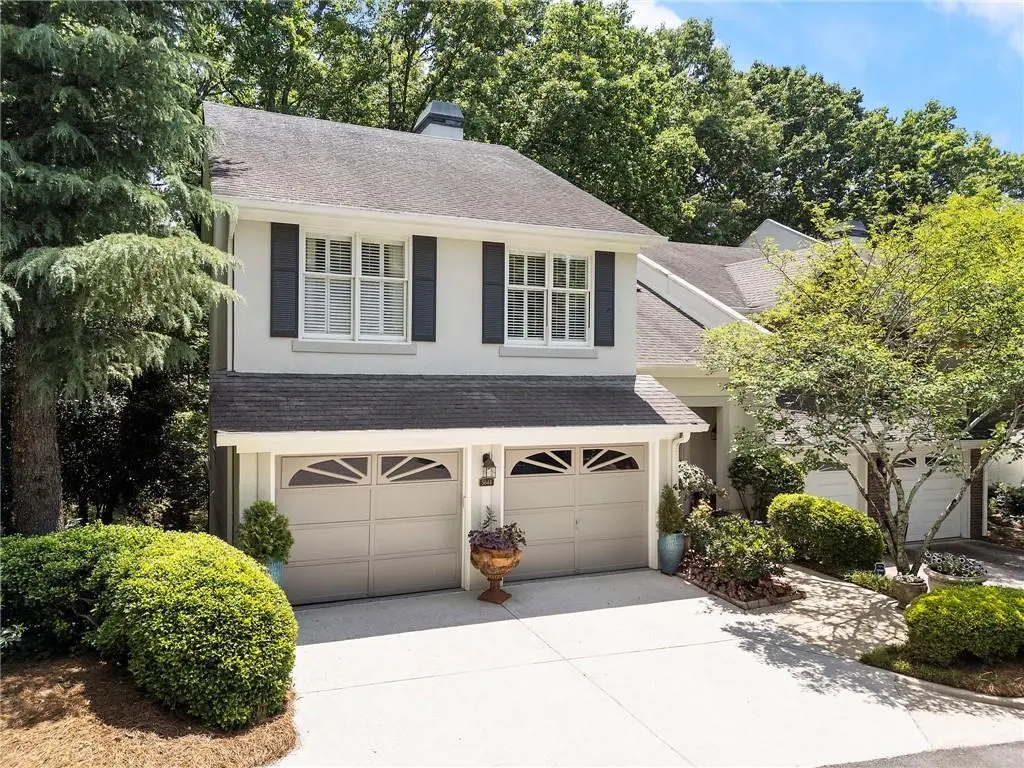
5644 River Oaks Pl Unit 7B · Sandy Springs, GA
Flood risk 1/10 · Minimal
- FEMA flood zone
- X (unshaded)
- Chance of flooding over 30 yrs
- 0.0%
- Est. flood insurance / yr
- $473 – $860
Fire risk 3/10 · Minor
- Est. fire insurance / yr
- $963 – $1,789
Heat risk 5/10 · Moderate
- Hot days now (above 103°F)
- 7 days/yr
- Hot days in 30 yrs
- 18 days/yr
Wind risk 4/10 · Minor
- Chance of severe wind over 30 yrs
- 20.0%
Air-quality risk 5/10 · Moderate
- Unhealthy air days now
- 6 days/yr
- Unhealthy air days in 30 yrs
- 8 days/yr
Risk factors via First Street. Map © Google.
Why this score? — see what drove the F grade
The composite is a weighted blend of 9 inputs, each scored 0–100. Each bar is that input's sub-score; the figure is the points it added to the 100-point composite (weight × sub-score).
- Cash flow +10.2/30.0
- Schools +4.5/10.0
- 1% rule +3.8/10.0
- Livability +3.7/5.0
- Rent growth +3.0/5.0
- DSCR +2.9/10.0
- Condition / age +2.5/5.0
- ARV discount +1.4/15.0
- Appreciation +0.0/10.0
$735,000
🖨 Deal sheet (PDF) 📄 Offer letter ✓ Due diligence
Listing remarks
Imagine coming home to your own private sanctuary in the heart of Sandy Springs — pulling straight into your garage, stepping inside, and leaving the world behind. This stunning end unit townhome lives like a single family home, with nearly 4,000 square feet of light-filled, thoughtfully designed space that gives everyone room to breathe. Gorgeous crown molding, an oversized primary ensuite, and generous storage make every day feel effortless and refined. Mornings start with coffee bathed in natural light, weekends belong to the swim and tennis courts, and when life calls you away, simply lock the door and go. Meticulously maintained and move-in ready — this is the home you've b
Key facts
- $775 HOA
- 2 garage spots
- Community pool
Property features AI
Finance
- Other: Road frontage is a private road; County: Fulton, GA
- HOA & community: Monthly association fee of $775; Community features include dog park, pool, tennis courts, trails/greenway, and homeowners association; Community has 40 units
Exterior
- Parking: Attached garage with 2 spaces and garage door opener
- Utilities: Public water; Public sewer; 110 volt electric; Cable available; Electricity available; Natural gas available; Phone available; Sewer available; Water available
- Home design: Condominium; Three or more levels; End unit (1 common wall)
- Construction: Stucco construction; Shingle roof; Block foundation; Resale property; Garage structures on site
- Exterior features: Balcony; Private entrance; Rain gutters; Deck; In-ground pool; Private road with asphalt surface
Interior
- Kitchen: Kitchen island; Breakfast area; Stained cabinets; Pantry; Solid surface countertops; Dishwasher; Disposal; Double oven; Gas cooktop; Microwave; Range hood; Refrigerator
- Bedrooms: Oversized master with sitting room; Three bedrooms on upper level; One bedroom on lower level
- Flooring: Carpet; Ceramic tile; Hardwood; Luxury vinyl
- Bathrooms: Three full bathrooms; One half bathroom (main level); Master bath with separate tub and shower and soaking tub
- Heating & cooling: Central heating; Central air
- Interior features: Crown molding; Two-story entrance foyer; High 9-ft ceilings on main level; High-speed internet; Insulated windows; Plantation shutters; Skylights; One fireplace in the family room; Finished full basement with finished bath
- Laundry & utility: Main level laundry room; Electric dryer hookup
Neighborhood map
What this means for you Summary
Snapshot
- This is a 4-bed/3.5-bath condo listed at $735k.
Deal economics
- At list price, monthly cash flow is $-415 ($-5k/yr) — negative.
- To cash-flow at today's rent, offer at most $662k (10.0% below list).
- To meet the 1% rule (rent ≥ 1% of price), the offer needs to be $647k (11.9% below list).
- Recommended offer: $647k (11.9% below list) — sets the bar for 1% rule.
- Cap rate 5.6% vs local median 2.6% in Sandy Springs — top-decile yield for the area; either an underpriced asset or a hidden risk that comps aren't pricing in. Stress-test before assuming the spread holds.
Location & tenants
- Location reads 73/100 on livability (#45 in GA) — a middle-class / working-renter tenant base. Strengths: employment A+, crime A-, commute A-; Watch: amenities F, cost of living F.
- Fulton County (suburban): math 49% / reading 53% proficiency, ranked #12 of 174 in GA (top 7%) — acceptable for families but not a draw, mixed tenant base, ~2y average lease.
- Zoned schools: Heards Ferry Elementary School (math 78% / reading 78%, grade A, #22 of 1,228 statewide, top 2%, 703 students, 4% FRL); Ridgeview Charter School (math 33% / reading 45%, grade F, #155 of 470 statewide, top 33%, 996 students, 45% FRL); Riverwood International Charter School (math 24% / reading 10%, grade F, #269 of 424 statewide, top 65%, 1,737 students, 30% FRL).
- Market conditions: Rents rising (+1.8%/yr); 247 active listings in the ZIP; 4 comparable units currently listed for rent nearby; rentals at typical pace (median 19d on market — plan ~3-4 weeks tenant-placement turnaround); high-income renter base; 11,565 units permitted in Fulton County in 2024 (8,159 in 5+ unit buildings).
- This rent runs 41% of the median local income ($189k/yr) — at the standard rent-burdened threshold; future hikes will face affordability resistance.
Forward outlook
- Local home prices are declining (-3.0%/yr); year-one equity from $5k of loan paydown is wiped out by about $22k of value loss. Plan a longer hold.
- Fulton County population projected at +38% by 2050 — long-run rental-demand tailwind backs the buy-and-hold thesis.
Negotiation context
- It's been on market 34 days — a 3% lower offer ($713k) is reasonable based on typical stale-listing flexibility.
- Current owner paid $604k; 22% above their basis — modest negotiation headroom, anchor on the comps not their cost.
Risks & watch-outs
- Climate carrying-cost: extreme-heat days projected 7→18/yr by 2055 (HVAC capex compounding) — expect insurance premiums to compound above CPI over the hold.
Questions for the listing agent
- What do current leases actually rent for vs. the listed asking? Can we see a recent rent roll and the last 12 months of T-12 income?
- It's been on market 34 days. Have you received any prior offers? Is the seller open to a 12% concession, seller financing, or rate buy-down credit?
- What does the HOA fee cover, when was the last increase, and are there any pending special assessments or reserve-fund shortfalls?
- Any open or pending special assessments — roof, HVAC, plumbing, elevator, façade? What's the per-unit balance and payoff schedule, and is the seller paying it off at close or rolling it to the buyer?
- Is there a deadline driving the sale (1031 exchange, divorce, estate, relocation)? That informs how much negotiation room exists.
- The area grade is low — what's the realistic commute time and amenity access for the typical tenant pool here? Any planned neighborhood developments (good or bad) we should know about?
- What's the average days-on-market for RENTAL listings here right now (not sales)? A rising rental-DOM trend means longer vacancies and softer asking-rent achievability than the comps imply.
- What's the recent tenant-quality profile in this submarket — average credit score on applications, eviction rate, late-payment / NSF rate, and stable-employment percentage? A property-management company in the area should have these aggregated.
- How much new apartment / multifamily construction is in the pipeline within 1–3 miles? Heavy new supply (>2% of stock underway) typically softens rents 12–24 months out; light construction supports rent growth.
Investment metrics
- 1% rule
- 0.88% ✗
- Cap rate
- 5.61%
- Cash-on-cash
- -2.42%
- DSCR
- 0.89
- GRM
- 9.5
CMA / ARV
- ARV (median comp)
- $647,179
- List price
- $735,000
- Delta
- 13.57%
- Verdict
- OVERPRICED
- Comps
- 8 within 1.0 mi
Projected returns pro-forma
-3.0% appreciation · 1.83% rent growth · sell at horizon
- IRR
- -21.7%
- Equity multiple
- 0.26×
- Total profit
- $-152,707
- Equity at exit
- $109,591
- IRR
- -18.7%
- Equity multiple
- 0.05×
- Total profit
- $-195,698
- Equity at exit
- $63,549
Cash invested: $205,800 (down + closing). Projections, not guarantees.
Landlord ↔ Tenant lean methodology
- Overall (STATE)
- 90 Strongly Landlord-Friendly
- State Georgia
- 90 Strongly Landlord-Friendly · R+3
- County
- — inherits STATE
- City
- — inherits STATE
ZIP-level market 30327
- Rents YoY
- 1.8%
- Active inventory
- 247
- Price-to-rent
- 9.5×
Monthly cashflow live
- Estimated rent
- $6,472 medium interval (Pro) →
- Mortgage (P&I)
- −$3,854
- Tax from tax record
- −$593 /mo · $7,111/yr
- Insurance
- −$306
- HOA
- −$775
- Vacancy / Maint / Mgmt
- −$1,359
- Net cashflow
- $-415
Break-even live
Sensitivity live
| Price | -10% $1 | -5% $-207 | +0% $-415 | +5% $-623 | +10% $-831 |
|---|---|---|---|---|---|
| Rent | -10% $-927 | -5% $-671 | +0% $-415 | +5% $-160 | +10% $96 |
| Rate | -1.0pp $-45 | -0.5pp $-228 | base $-415 | +0.5pp $-606 | +1.0pp $-799 |
UW: 25.0% down · 7.5% · 30yr · 1.5% tax · 5.0% vac · 8.0% maint · 8.0% mgmt
Financing live
Cash to close
- Down payment
- $183,750
- Closing costs
- $22,050
- Reserves months
- —
- Total cash needed
- —
Loan-product check · same deal, 3 products live
Conventional
25% down · 7.5% · 30yr
- Down + closing
- —
- Monthly P&I
- —
- Monthly cashflow
- —
- DSCR
- —
- Eligible?
- —
Personal DTI + credit; lowest rate.
DSCR
20% down · 8.5% · 30yr
- Down + closing
- —
- Monthly P&I
- —
- Monthly cashflow
- —
- DSCR
- —
- Eligible?
- —
No personal income docs; deal must DSCR.
Hard money
10% down · 12.0% · 12mo
- Down + closing
- —
- Monthly P&I
- —
- Monthly cashflow
- —
- DSCR
- —
- Eligible?
- —
Short-term bridge; refi at stabilization.
Rent comps 4 comps
| Address | Beds | Baths | Sqft | Rent | $/sqft | DOM | Units | Dist |
|---|---|---|---|---|---|---|---|---|
| 295 Glen Lake Dr Sandy Springs, GA | 4.0 | 3.5 | 3693 | $10,000 | $2.71 | 6d | 1 | 1.28mi |
| 902 River Vista Dr #94 Atlanta, GA | 4.0 | 4.5 | 2256 | $4,500 | $1.99 | 7d | 1 | 1.28mi |
| 485 Riverside Pkwy Atlanta, GA | 4.0 | 2.5 | 2613 | $13,000 | $4.98 | 19d | 1 | 1.31mi |
| 705 Edgewater Trl Atlanta, GA | 4.0 | 3.0 | 1976 | $3,500 | $1.77 | 26d | 1 | 1.46mi |
HOA detail condo
- Monthly dues
- $775 · $9,300/yr
- Assessments
- None detected in remarks — confirm with the listing agent.
Listing history 19 events
-
2026-06-17status $735,000 Pending 34 DOM
-
2026-06-17days on market $735,000 Active 34 DOM
-
2026-06-16days on market $735,000 Active 33 DOM
-
2026-06-15days on market $735,000 Active 32 DOM
-
2026-06-13days on market $735,000 Active 30 DOM
-
2026-06-09days on market $735,000 Active 26 DOM
-
2026-06-08days on market $735,000 Active 25 DOM
-
2026-06-07days on market $735,000 Active 24 DOM
-
2026-06-04days on market $735,000 Active 21 DOM
-
2026-06-03days on market $735,000 Active 20 DOM
-
2026-06-01days on market $735,000 Active 18 DOM
-
2026-05-31days on market $735,000 Active 17 DOM
-
2026-05-14$735,000 Active 715-char remark
-
2026-05-13historical $735,000 715-char remark
-
2021-08-26soldstatus $604,000
-
2013-07-26soldstatus $364,000
-
2004-07-19soldstatus $360,000
-
2002-04-03soldstatus $360,000
-
1984-08-06soldstatus $193,000
ⓘ Source: listings_history table (triggers on properties + properties_extension) + one-shot
backfill from property_details.listing_events for pre-trigger history.
Tax reassessment forecast GA · Resets to sale price
- Current annual tax
- $7,111 · $593/mo
- Projected year-2 tax
- $7,111 · $593/mo
- Expected delta
- $0/yr ($0/mo · -0.0%)
ⓘ Screening estimate from a state-policy table — verify with the county assessor before closing.
Climate risk First Street
- Flood 1/10 Low FEMA zone X (unshaded) · 0% chance over 30 yrs
- Wildfire 3/10 Moderate
- Heat 5/10 Major 7 d/yr ≥103°F today · 18 d/yr by 30 yrs out
- Wind 4/10 Moderate 20% chance of damaging wind over 30 yrs
- Air quality 5/10 Major 6 unhealthy d/yr today · 8 by 30 yrs out
Nearby sold comps map
Loading sold comps map…
Walkable amenities ~0.75 mi
Loading nearby amenities…
Taxation est. · year 1
- Rental income
- $77,666
- − Mortgage interest
- −$41,171
- − Property taxes
- −$7,111
- − Insurance
- −$3,675
- − Repairs & maintenance
- −$6,213
- − Management
- −$6,213
- − HOA
- −$9,300
- − Depreciation
- −$21,382
- Taxable loss
- −$17,400
- Est. tax savings @ 24.0%
- +$4,176
- After-tax cash flow
- $-807/yr
For passive investors: Depreciation is non-cash, so a rental often shows a tax loss while cash-flowing — sheltering income. Rental losses are passive: they offset passive income freely, and up to $25,000/yr can offset ordinary (W-2) income if you actively participate and your MAGI is under $100k (phasing out to $0 by $150k); unused losses carry forward. On sale, claimed depreciation is recaptured at up to 25%, and gains may owe capital-gains tax (a 1031 exchange can defer both). Figures are a year-1 estimate at your 24.0% rate — not tax advice; consult a CPA.
Schools (NCES district)
- District
- Fulton County
- NCES district ID
- 1302280
- Math proficiency
- 49% ▼ -2.00%
- Reading proficiency
- 53% ▬ 0.00%
- Median HH income
- $68,035
- Composite
- 45.33/100
- National rank
- #2640
- State rank
- #12 of 174 in GA
Livability — Sandy Springs
- Score
- 73/100
- State rank
- #45
- US rank
- #5106
Category grades
Schools grade is shown separately in the Schools card above.
Census & demographics
- Census place
- Sandy Springs, GA
- County
- Fulton County · 1,094,430 people
- City population
- 108,027
- Metro
- Atlanta-Sandy Springs-Alpharetta, GA
- Population (ZIP)
- 23,673
- Household income
- $189,250
- Rent vs Own
- Severe rent burden
- 338.0
Population outlook (Fulton County) Hauer SSP2
- Today (2025)
- 1,203,707 people
- By 2030
- 1,299,706 · +8.0%
- By 2040
- 1,488,256 · +23.6%
- By 2050
- 1,664,580 · +38.3%
- By 2075
- 2,036,072 · +69.2%
- By 2100
- 2,222,402 · +84.6%
Race, ethnicity, and origin ACS 2023
- Neighborhood character
- Predominantly White (81%)
- Race & ethnicity
- White 81% Two or more races 7% Hispanic / Latino 6% Asian 5% Black 5%
- Hispanic origin (detail)
- Mexican 1% Dominican 1%
- Common ancestry
- Slovak 4% Italian 3% Serbian 3%
- Foreign-born
- 10% · Canada, China, South Korea
- Languages at home
- 89% English-only · Spanish 4% Other Indo-European 2% Chinese 1%
Political lean MEDSL · Fulton
- 2024 margin
- Solid D (+44.9) · D 71.9% · R 27.0% · Other 1.1%
- 2008→2024 swing
- +9.8pp toward D · 2008: 35.0pp · 2024: 44.9pp
- All cycles
- 2024: D+44.9 2020: D+46.4 2016: D+42.1 2012: D+29.6 2008: D+35.0
Not yet ingested
- Civics
- —
Market trends
- HPI YoY
- ▼ -523.63%
- Current HPI
- 217.7071
- Rent YoY
- ▲ 1.83%
- Metro
- Atlanta-Sandy Springs-Alpharetta, GA
- State GDP YoY
- ▲ 2.66%
- F500 in state
- 28
Industry mix (Fortune 500 HQ in GA)
| Industry | F500 HQs | Revenue |
|---|---|---|
| Paper / Packaging | 2 | $29B |
|
||
| Retail | 1 | $160B |
|
||
| Transportation / Logistics | 1 | $91B |
|
||
| Airlines | 1 | $62B |
|
||
| Consumer Goods | 1 | $47B |
|
||
| Utilities | 1 | $25B |
|
||
Price history
+280.8% since first listed8 events — show timeline
- 2026-06-17 Pending — FMLS
- 2026-05-14 Listed $735,000 FMLS
- 2026-05-13 Coming Soon $735,000 FMLS
- 2021-08-26 Sold (Public Records) $604,000 Public Records
- 2013-07-26 Sold (Public Records) $364,000 Public Records
- 2004-07-19 Sold (Public Records) $360,000 Public Records
- 2002-04-03 Sold (Public Records) $360,000 Public Records
- 1984-08-06 Sold (Public Records) $193,000 Public Records
Property tax history
+2.5%/yrLatest (2025): $7,111 · +3.0% YoY. Source: county tax records.
Cash-flow waterfall
monthlySold comps — $/sqft
last 12 mo · ≤1 miLoading sold comps…