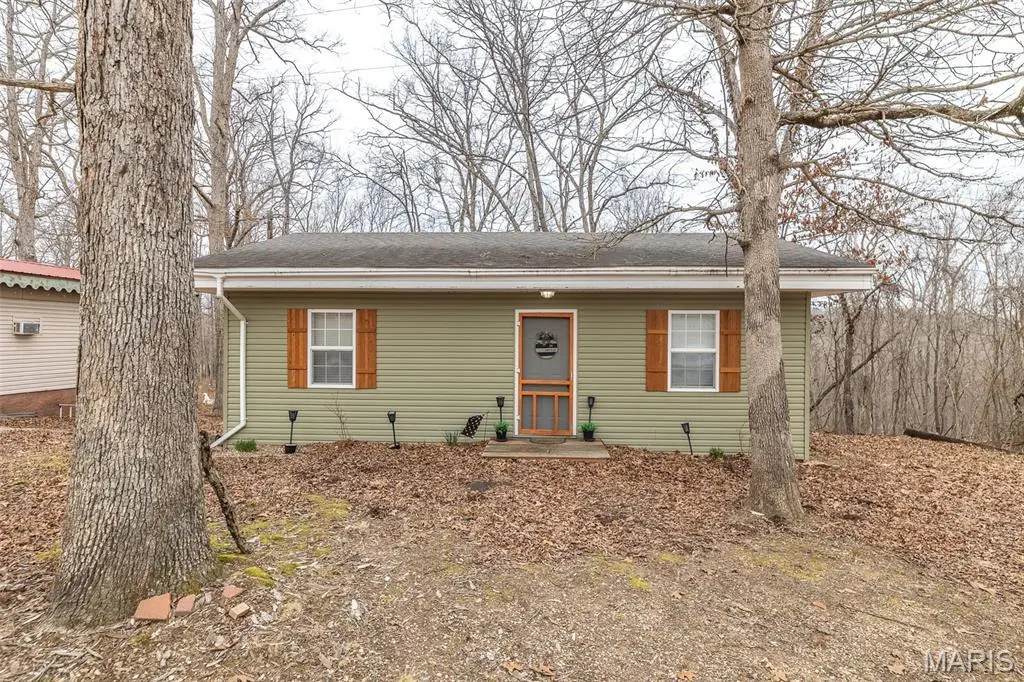
45 Rose Ln · Williamsville, MO
Flood risk No data
- FEMA flood zone
- —
- Chance of flooding over 30 yrs
- —
- Est. flood insurance / yr
- —
Fire risk No data
- Est. fire insurance / yr
- —
Heat risk No data
- Hot days now (above threshold)
- —
- Hot days in 30 yrs
- —
Wind risk No data
- Chance of severe wind over 30 yrs
- —
Air-quality risk No data
- Unhealthy air days now
- —
- Unhealthy air days in 30 yrs
- —
Risk factors via First Street. Map © Google.
Why this score? — see what drove the D grade
The composite is a weighted blend of 9 inputs, each scored 0–100. Each bar is that input's sub-score; the figure is the points it added to the 100-point composite (weight × sub-score).
- Cash flow +10.7/30.0
- ARV discount +8.1/15.0
- Appreciation +6.9/10.0
- 1% rule +3.1/10.0
- DSCR +3.1/10.0
- Schools +2.9/10.0
- Livability +2.9/5.0
- Rent growth +2.5/5.0
- Condition / age +2.5/5.0
$99,900
🖨 Deal sheet (PDF) 📄 Offer letter ✓ Due diligence
Listing remarks MLS
This adorable 2-bedroom, 1-bath home sits just 1/4 mile from Chaonia Landing, offering quick and easy access to boating, fishing, and relaxing days on the water. Inside, you’ll love the open living room and kitchen layout that creates a bright, connected space perfect for gathering with family and friends or unwinding after a day at the lake. Step outside to enjoy the nice back deck, ideal for morning coffee or evening cookouts. Whether you’re looking for a full-time residence, a weekend getaway, or a potential Airbnb or Vrbo investment opportunity, this charming home is full of comfort and possibility in a fantastic location. Call today before gone tomorrow!
Key facts
- Nice back deck
- 5,227 sq ft lot
- Built 1950
Tags
Neighborhood map
What this means for you Summary
Snapshot
- This is a 2-bed/1.0-bath single-family listed at $100k.
Deal economics
- At list price, monthly cash flow is $-48 ($-578/yr) — negative.
- To cash-flow at today's rent, offer at most $93k (7.0% below list).
- To meet the 1% rule (rent ≥ 1% of price), the offer needs to be $81k (18.6% below list).
- Recommended offer: $81k (18.6% below list) — sets the bar for 1% rule.
Location & tenants
- Location reads 58/100 on livability (#588 in MO) — a working-class tenant base; expect higher turnover. Strengths: cost of living A+, housing A+; Watch: health & safety C-, crime F, amenities F.
- Greenville R-II (rural): math 34% / reading 37% proficiency, ranked #228 of 324 in MO (top 70%) — families likely to look elsewhere, expect single-tenant / working-renter base with shorter leases.
- Zoned schools: Greenville Elem. (math 32% / reading 32%, grade F, #761 of 1,115 statewide, top 72%, 302 students, 64% FRL); Greenville Jr. High (math 42% / reading 42%, grade D-, #149 of 391 statewide, top 41%, 106 students, 64% FRL); Greenville High (math 34% / reading 54%, grade F, #179 of 521 statewide, top 39%, 214 students, 55% FRL) — zoned schools at 61% FRL track the district average.
- Market conditions: 17 active listings in the ZIP.
Forward outlook
- In year one you build about $5k of equity ($691 loan paydown + $4k appreciation (3.9% local appreciation)).
- Wayne County population projected to shrink 9% by 2050 — rents likely to lag national; underwrite the cash flow, not the appreciation.
- At projected returns (3.9% appreciation + 3.0% rent growth), your $28k cash investment doubles in ~6 years — after that, you're playing with house money.
- By year 8, paydown + projected appreciation supports a ~$34k cash-out refi (75% LTV) — recoverable capital for the next deal without selling this one.
Negotiation context
- It's been on market 115 days — a 9% lower offer ($91k) is reasonable based on typical stale-listing flexibility.
- 2 sale attempts with the ask held roughly flat each time — persistent listings suggest the price (not the market) is what's stuck; bring a comps-based counter.
Risks & watch-outs
- Watch-outs: built in 1950 — expect roof / HVAC / electrical / plumbing capex.
Questions for the listing agent
- What do current leases actually rent for vs. the listed asking? Can we see a recent rent roll and the last 12 months of T-12 income?
- It's been on market 115 days. Have you received any prior offers? Is the seller open to a 19% concession, seller financing, or rate buy-down credit?
- Built in 1950 — when were the roof, HVAC, electrical panel, plumbing, and water heater last replaced?
- Why hasn't it sold? Are there any deal-killer items the seller is aware of (foundation, flood, title, zoning, code violations)?
- Is there a deadline driving the sale (1031 exchange, divorce, estate, relocation)? That informs how much negotiation room exists.
- Schools are D-rated, which usually means shorter tenancies and higher turnover. Who's the typical renter profile here, and what's been the actual vacancy rate?
- Crime grade is F in this area — have there been break-ins, vandalism, or insurance claims at this property in the last 3 years? What carrier currently insures it and at what premium?
- The area grade is low — what's the realistic commute time and amenity access for the typical tenant pool here? Any planned neighborhood developments (good or bad) we should know about?
- What's the average days-on-market for RENTAL listings here right now (not sales)? A rising rental-DOM trend means longer vacancies and softer asking-rent achievability than the comps imply.
- What's the recent tenant-quality profile in this submarket — average credit score on applications, eviction rate, late-payment / NSF rate, and stable-employment percentage? A property-management company in the area should have these aggregated.
- How much new for-sale + rental construction is in the pipeline within 1–3 miles? Heavy new supply typically softens prices + rents 12–24 months out; constrained supply supports both.
Investment metrics
- 1% rule
- 0.81% ✗
- Cap rate
- 5.71%
- Cash-on-cash
- -2.07%
- DSCR
- 0.91
- GRM
- 10.2
CMA / ARV
- ARV (median comp)
- $101,189
- List price
- $99,900
- Delta
- -1.27%
- Verdict
- FAIR
- Comps
- 1 within 2.0 mi
Projected returns pro-forma
3.85% appreciation · 3.0% rent growth · sell at horizon
- IRR
- 8.0%
- Equity multiple
- 1.48×
- Total profit
- $13,524
- Equity at exit
- $49,757
- IRR
- 10.3%
- Equity multiple
- 2.68×
- Total profit
- $47,055
- Equity at exit
- $80,677
Cash invested: $27,972 (down + closing). Projections, not guarantees.
Landlord ↔ Tenant lean methodology
- Overall (STATE)
- 81 Strongly Landlord-Friendly
- State Missouri
- 81 Strongly Landlord-Friendly · R+10
- County
- — inherits STATE
- City
- — inherits STATE
ZIP-level market 63967
- Home prices YoY
- 2.2%
- Active inventory
- 17
- Price-to-rent
- 10.2×
Monthly cashflow live
- Estimated rent
- $813 medium interval (Pro) →
- Mortgage (P&I)
- −$524
- Tax est. 1.5%
- −$125 /mo · $1,498/yr
- Insurance
- −$42
- HOA
- −$0
- Vacancy / Maint / Mgmt
- −$171
- Net cashflow
- $-48
Break-even live
Sensitivity live
| Price | -10% $21 | -5% $-14 | +0% $-48 | +5% $-83 | +10% $-117 |
|---|---|---|---|---|---|
| Rent | -10% $-112 | -5% $-80 | +0% $-48 | +5% $-16 | +10% $16 |
| Rate | -1.0pp $2 | -0.5pp $-23 | base $-48 | +0.5pp $-74 | +1.0pp $-100 |
UW: 25.0% down · 7.5% · 30yr · 1.5% tax · 5.0% vac · 8.0% maint · 8.0% mgmt
Financing live
Cash to close
- Down payment
- $24,975
- Closing costs
- $2,997
- Reserves months
- —
- Total cash needed
- —
Loan-product check · same deal, 3 products live
Conventional
25% down · 7.5% · 30yr
- Down + closing
- —
- Monthly P&I
- —
- Monthly cashflow
- —
- DSCR
- —
- Eligible?
- —
Personal DTI + credit; lowest rate.
DSCR
20% down · 8.5% · 30yr
- Down + closing
- —
- Monthly P&I
- —
- Monthly cashflow
- —
- DSCR
- —
- Eligible?
- —
No personal income docs; deal must DSCR.
Hard money
10% down · 12.0% · 12mo
- Down + closing
- —
- Monthly P&I
- —
- Monthly cashflow
- —
- DSCR
- —
- Eligible?
- —
Short-term bridge; refi at stabilization.
Listing history 19 events
-
2026-06-21days on market $99,900 Active 115 DOM
-
2026-06-21days on market $99,900 Active 114 DOM
-
2026-06-18days on market $99,900 Active 112 DOM
-
2026-06-17days on market $99,900 Active 111 DOM
-
2026-06-16days on market $99,900 Active 110 DOM
-
2026-06-15days on market $99,900 Active 109 DOM
-
2026-06-13days on market $99,900 Active 107 DOM
-
2026-06-12days on market $99,900 Active 106 DOM
-
2026-06-09days on market $99,900 Active 103 DOM
-
2026-06-08days on market $99,900 Active 102 DOM
-
2026-06-07days on market $99,900 Active 101 DOM
-
2026-06-05days on market $99,900 Active 99 DOM
-
2026-06-04days on market $99,900 Active 97 DOM
-
2026-06-02days on market $99,900 Active 96 DOM
-
2026-06-01days on market $99,900 Active 95 DOM
-
2026-05-31days on market $99,900 Active 94 DOM
-
2026-02-26$99,900 Active 679-char remark
Show marketing remark (679 chars)
This adorable 2-bedroom, 1-bath home sits just 1/4 mile from Chaonia Landing, offering quick and easy access to boating, fishing, and relaxing days on the water. Inside, you’ll love the open living room and kitchen layout that creates a bright, connected space perfect for gathering with family and friends or unwinding after a day at the lake. Step outside to enjoy the nice back deck, ideal for morning coffee or evening cookouts. Whether you’re looking for a full-time residence, a weekend getaway, or a potential Airbnb or Vrbo investment opportunity, this charming home is full of comfort and possibility in a fantastic location. Call today before gone tomorrow!
-
2025-11-03price $115,000
-
2025-07-03$125,000 Active
ⓘ Source: listings_history table (triggers on properties + properties_extension) + one-shot
backfill from property_details.listing_events for pre-trigger history.
Nearby sold comps map
Loading sold comps map…
Walkable amenities ~0.75 mi
Loading nearby amenities…
Taxation est. · year 1
- Rental income
- $9,755
- − Mortgage interest
- −$5,596
- − Property taxes
- −$1,498
- − Insurance
- −$500
- − Repairs & maintenance
- −$780
- − Management
- −$780
- − Depreciation
- −$2,906
- Taxable loss
- −$2,306
- Est. tax savings @ 24.0%
- +$553
- After-tax cash flow
- $-25/yr
For passive investors: Depreciation is non-cash, so a rental often shows a tax loss while cash-flowing — sheltering income. Rental losses are passive: they offset passive income freely, and up to $25,000/yr can offset ordinary (W-2) income if you actively participate and your MAGI is under $100k (phasing out to $0 by $150k); unused losses carry forward. On sale, claimed depreciation is recaptured at up to 25%, and gains may owe capital-gains tax (a 1031 exchange can defer both). Figures are a year-1 estimate at your 24.0% rate — not tax advice; consult a CPA.
Schools (NCES district)
- District
- Greenville R-II
- NCES district ID
- 2913380
- Math proficiency
- 34% ▲ 8.00%
- Reading proficiency
- 37% ▼ -5.00%
- Median HH income
- $32,394
- Composite
- 29.08/100
- National rank
- #6599
- State rank
- #228 of 324 in MO
Livability — Williamsville
- Score
- 58/100
- State rank
- #588
- US rank
- #20851
Category grades
Schools grade is shown separately in the Schools card above.
Census & demographics
- Population (ZIP)
- 1,416
Population outlook (Wayne County) Hauer SSP2
- Today (2025)
- 13,005 people
- By 2030
- 12,767 · -1.8%
- By 2040
- 12,319 · -5.3%
- By 2050
- 11,828 · -9.1%
- By 2075
- 10,806 · -16.9%
- By 2100
- 9,610 · -26.1%
Race, ethnicity, and origin ACS 2023
- Neighborhood character
- Predominantly White (84%)
- Race & ethnicity
- White 84% Hispanic / Latino 6% Two or more races 5%
- Hispanic origin (detail)
- Common ancestry
- Slovak 2% Iranian 2% Serbian 2%
Political lean MEDSL · Wayne
- 2024 margin
- Solid R (+72.6) · D 13.4% · R 86.0%
- 2008→2024 swing
- -47.6pp toward R · 2008: -25.0pp · 2024: -72.6pp
- All cycles
- 2024: R+72.6 2020: R+70.5 2016: R+64.4 2012: R+34.6 2008: R+25.0
Not yet ingested
- Civics
- —
Market trends
- HPI YoY
- ▲ 3.85%
- Current HPI
- 182.0301
- Rent YoY
- —
- Metro
- —
- State GDP YoY
- ▲ 1.84%
- F500 in state
- 20
Industry mix (Fortune 500 HQ in MO)
| Industry | F500 HQs | Revenue |
|---|---|---|
| Healthcare | 1 | $163B |
|
||
| Insurance | 1 | $21B |
|
||
| Industrial Technology | 1 | $17B |
|
||
| Retail | 1 | $16B |
|
||
| Industrial Distribution | 1 | $10B |
|
||
| Utilities | 1 | $9B |
|
||
Price history
-20.1% since first listed3 events — show timeline
- 2026-02-26 Listed $99,900 MARIS as Distributed by MLS Grid
- 2025-11-03 Price Changed $115,000 MARIS as Distributed by MLS Grid
- 2025-07-03 Listed $125,000 MARIS as Distributed by MLS Grid
Cash-flow waterfall
monthlySold comps — $/sqft
last 12 mo · ≤1 miLoading sold comps…