85 Middle St #10 · Hallowell, ME
Flood risk No data
- FEMA flood zone
- —
- Chance of flooding over 30 yrs
- —
- Est. flood insurance / yr
- —
Fire risk No data
- Est. fire insurance / yr
- —
Heat risk No data
- Hot days now (above threshold)
- —
- Hot days in 30 yrs
- —
Wind risk No data
- Chance of severe wind over 30 yrs
- —
Air-quality risk No data
- Unhealthy air days now
- —
- Unhealthy air days in 30 yrs
- —
Risk factors via First Street. Map © Google.
Why this score? — see what drove the C grade
The composite is a weighted blend of 9 inputs, each scored 0–100. Each bar is that input's sub-score; the figure is the points it added to the 100-point composite (weight × sub-score).
- Cash flow +18.5/30.0
- 1% rule +7.7/10.0
- ARV discount +7.5/15.0
- Schools +7.2/10.0
- DSCR +5.8/10.0
- Livability +3.6/5.0
- Rent growth +2.5/5.0
- Condition / age +2.5/5.0
- Appreciation +0.0/10.0
$157,000
🖨 Deal sheet 📄 Offer letter ✓ Due diligence
Listing remarks
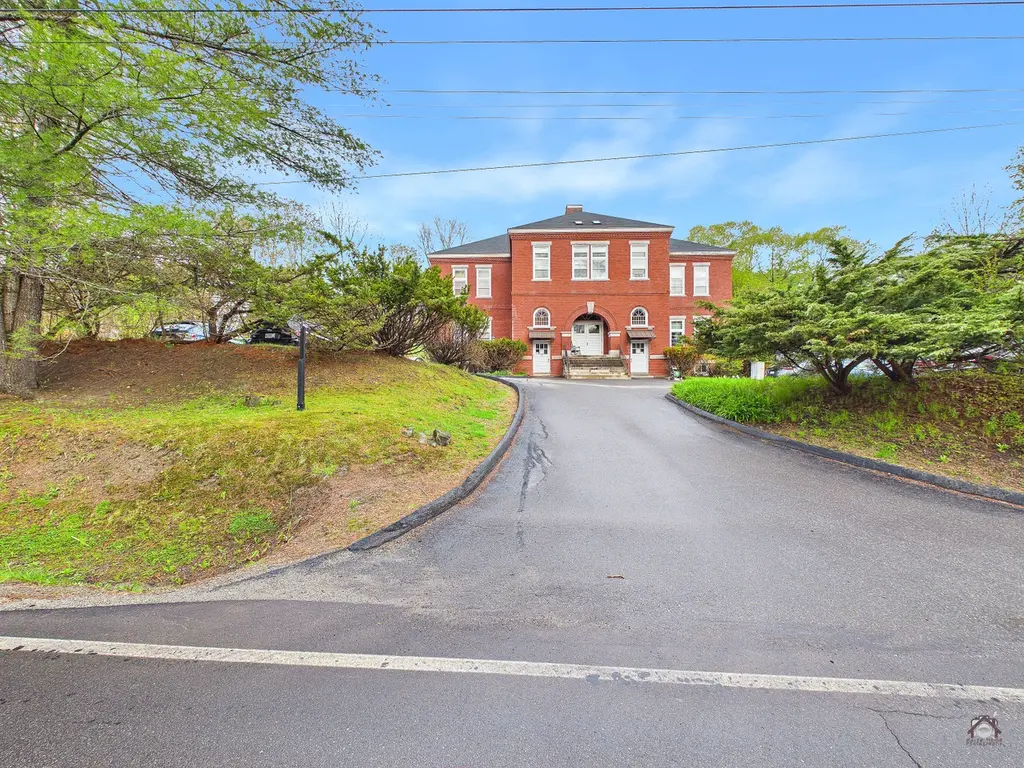
Motivtaed seller just dropped the price by $10,000 !!Historic charm meets intown living at the Marcia Clark Schoolhouse Condominium. This 2 bedroom 1 full bath home blends character, comfort, and convenience in one of the area's historic buildings. This home has hardwood floors and filled with natural light from the oversized windows. The open and comfortable layout is well designed for everyday living. The kitchen, dining, and living spaces flow together with ease, creating a welcoming atmosphere whether enjoying a quite evening at home or entertaining guests. You enter through the main foyer with mailboxes and head straight head up one flight to Unit 10 The primary bedroom is 4.10 by 7.
Key facts
- Expansive feel
- Walk-in closet
- Natural light
Tags
Property features AI
Finance
- Other: Residential zoning
- HOA & community: Community of 7 units; Monthly association fee of $362.28
Exterior
- Parking: On-site paved parking with 21+ common spaces
- Utilities: Public water; Public sewer; Electric service
- Home design: Condominium; Facing direction not specified; Built in 1900
- Construction: Masonry/brick construction; Shingle roof; Built in 1900
- Exterior features: Intown location; Near golf course, public beach, turnpike/interstate, town and railroad; Neighborhood setting with sidewalks; Paved road
Interior
- Kitchen: Dishwasher; Electric range; Refrigerator
- Bedrooms: Two bedrooms on the first floor
- Flooring: Tile; Wood
- Bathrooms: One full bathroom
- Heating & cooling: Baseboard heating; Circuit breaker electrical panel; Electric water heater
- Interior features: Unfurnished; 4 total rooms; Full, unfinished basement with interior entry
- Laundry & utility: Coin laundry on site
Neighborhood map
What this means for you Summary
Snapshot
- This is a 2-bed/1.0-bath condo listed at $157k.
Deal economics
- At list price, monthly cash flow is $151 ($2k/yr) — positive.
- The deal already cash-flows at list — no discount required.
- Meets the 1% rule at list price ($2k rent vs $157k).
- Recommended offer: $152k (3.0% below list) — sets the bar for market timing.
- Cap rate 7.4% vs local median 2.7% in Hallowell — top-decile yield for the area; either an underpriced asset or a hidden risk that comps aren't pricing in. Stress-test before assuming the spread holds.
Location & tenants
- Location reads 71/100 on livability (#60 in ME) — a middle-class / working-renter tenant base. Strengths: crime A+, housing A+, health & safety A+; Watch: amenities F, commute F.
- RSU 02 (rural): math 83% / reading 87% proficiency, ranked #52 of 112 in ME (top 46%) — strong family-tenant draw, lease renewals of 3-5y typical.
- Market conditions: 25 active listings in the ZIP; 4 comparable units currently listed for rent nearby; rentals lingering (median 44d on market — plan ~5-8 weeks vacancy on turnover, expect pricing pressure); 100% of comp listings sitting > 30 days — soft ceiling on asking rent; 460 units permitted in Kennebec County in 2024 (0 in 5+ unit buildings).
Forward outlook
- Local home prices are declining (-3.0%/yr); year-one equity from $1k of loan paydown is wiped out by about $5k of value loss. Plan a longer hold.
- Kennebec County population projected at -17% by 2050 — secular population decline; favor cash flow + early exit over multi-decade hold.
Negotiation context
- It's been on market 31 days — a 3% lower offer ($152k) is reasonable based on typical stale-listing flexibility.
Risks & watch-outs
- Watch-outs: built in 1900 — expect roof / HVAC / electrical / plumbing capex.
Questions for the listing agent
- It's been on market 31 days. Have you received any prior offers? Is the seller open to a 3% concession, seller financing, or rate buy-down credit?
- Built in 1900 — when were the roof, HVAC, electrical panel, plumbing, and water heater last replaced?
- What does the HOA fee cover, when was the last increase, and are there any pending special assessments or reserve-fund shortfalls?
- Any open or pending special assessments — roof, HVAC, plumbing, elevator, façade? What's the per-unit balance and payoff schedule, and is the seller paying it off at close or rolling it to the buyer?
- Is there a deadline driving the sale (1031 exchange, divorce, estate, relocation)? That informs how much negotiation room exists.
- What's the average days-on-market for RENTAL listings here right now (not sales)? A rising rental-DOM trend means longer vacancies and softer asking-rent achievability than the comps imply.
- What's the recent tenant-quality profile in this submarket — average credit score on applications, eviction rate, late-payment / NSF rate, and stable-employment percentage? A property-management company in the area should have these aggregated.
- How much new apartment / multifamily construction is in the pipeline within 1–3 miles? Heavy new supply (>2% of stock underway) typically softens rents 12–24 months out; light construction supports rent growth.
Investment metrics
- 1% rule
- 1.27% ✓
- Cap rate
- 7.44%
- Cash-on-cash
- 4.11%
- DSCR
- 1.18
- GRM
- 6.5
CMA / ARV
No comps found within radius.
Projected returns pro-forma
-3.0% appreciation · 3.0% rent growth · sell at horizon
- IRR
- -9.7%
- Equity multiple
- 0.64×
- Total profit
- $-15,612
- Equity at exit
- $23,409
- IRR
- -0.1%
- Equity multiple
- 0.99×
- Total profit
- $-270
- Equity at exit
- $13,574
Cash invested: $43,960 (down + closing). Projections, not guarantees.
Landlord ↔ Tenant lean methodology
- Overall (STATE)
- 41 Moderately Tenant-Leaning
- State Maine
- 41 Moderately Tenant-Leaning · D+2
- County
- — inherits STATE
- City
- — inherits STATE
ZIP-level market 04347
- Home prices YoY
- -4.7%
- Active inventory
- 25
- Price-to-rent
- 6.5×
Monthly cashflow live
- Estimated rent
- $1,998 medium interval (Pro) →
- Mortgage (P&I)
- −$823
- Tax from tax record
- −$178 /mo · $2,130/yr
- Insurance
- −$65
- HOA
- −$362
- Vacancy / Maint / Mgmt
- −$420
- Net cashflow
- $151
Break-even live
UW: 25.0% down · 7.5% · 30yr · 1.5% tax · 5.0% vac · 8.0% maint · 8.0% mgmt
Financing live
Cash to close
- Down payment
- $39,250
- Closing costs
- $4,710
- Reserves months
- —
- Total cash needed
- —
Loan-product check · same deal, 3 products live
Conventional
25% down · 7.5% · 30yr
- Down + closing
- —
- Monthly P&I
- —
- Monthly cashflow
- —
- DSCR
- —
- Eligible?
- —
Personal DTI + credit; lowest rate.
DSCR
20% down · 8.5% · 30yr
- Down + closing
- —
- Monthly P&I
- —
- Monthly cashflow
- —
- DSCR
- —
- Eligible?
- —
No personal income docs; deal must DSCR.
Hard money
10% down · 12.0% · 12mo
- Down + closing
- —
- Monthly P&I
- —
- Monthly cashflow
- —
- DSCR
- —
- Eligible?
- —
Short-term bridge; refi at stabilization.
Rent comps 4 comps
| Address | Beds | Baths | Sqft | Rent | $/sqft | DOM | Units | Dist |
|---|---|---|---|---|---|---|---|---|
| 230 Water St Apt 2 Hallowell, ME | 1.0 | 1.0 | 600 | $1,800 | $3.00 | 43d | 1 | 0.27mi |
| 657 Maine Ave Unit 3 Farmingdale, ME | 1.0 | 1.0 | 1000 | $3,000 | $3.00 | 43d | 1 | 1.32mi |
| 657 Maine Ave Unit 4 Farmingdale, ME | 1.0 | 1.0 | 1000 | $2,100 | $2.10 | 43d | 1 | 1.33mi |
| 657 Maine Ave Unit 1 Farmingdale, ME | 1.0 | 1.0 | 740 | $1,700 | $2.30 | 43d | 1 | 1.33mi |
HOA detail condo
- Monthly dues
- $362 · $4,344/yr
- Assessments
- None detected in remarks — confirm with the listing agent.
Listing history 20 events
-
2026-06-19pricedays on market $157,000 Active 31 DOM
-
2026-06-18days on market $160,000 Active 30 DOM
-
2026-06-18price $160,000 Active 29 DOM
-
2026-06-17days on market $165,000 Active 29 DOM
-
2026-06-16days on market $165,000 Active 28 DOM
-
2026-06-15days on market $165,000 Active 27 DOM
-
2026-06-14days on market $165,000 Active 25 DOM
-
2026-06-12days on market $165,000 Active 24 DOM
-
2026-06-09days on market $165,000 Active 21 DOM
-
2026-06-09price $165,000 Active 20 DOM
-
2026-06-08days on market $175,000 Active 20 DOM
-
2026-06-07days on market $175,000 Active 19 DOM
-
2026-06-05days on market $175,000 Active 16 DOM
-
2026-06-03days on market $175,000 Active 15 DOM
-
2026-06-02days on market $175,000 Active 14 DOM
-
2026-06-01days on market $175,000 Active 13 DOM
-
2026-05-31days on market $175,000 Active 12 DOM
-
2026-05-30days on market $175,000 Active 11 DOM
-
2026-05-19$175,000 Active
-
2025-10-14price $189,000
ⓘ Source: listings_history table (triggers on properties + properties_extension) + one-shot
backfill from property_details.listing_events for pre-trigger history.
Tax reassessment forecast ME · Partial reset (capped growth)
- Current annual tax
- $2,130 · $178/mo
- Projected year-2 tax
- $2,133 · $178/mo
- Expected delta
- +$3/yr ($0/mo · 0.1%)
ⓘ Screening estimate from a state-policy table — verify with the county assessor before closing.
Nearby sold comps map
Loading sold comps map…
Walkable amenities ~0.75 mi
Loading nearby amenities…
Taxation est. · year 1
- Rental income
- $23,981
- − Mortgage interest
- −$8,794
- − Property taxes
- −$2,130
- − Insurance
- −$785
- − Repairs & maintenance
- −$1,919
- − Management
- −$1,919
- − HOA
- −$4,344
- − Depreciation
- −$4,567
- Taxable loss
- −$476
- Est. tax savings @ 24.0%
- +$114
- After-tax cash flow
- $1,921/yr
For passive investors: Depreciation is non-cash, so a rental often shows a tax loss while cash-flowing — sheltering income. Rental losses are passive: they offset passive income freely, and up to $25,000/yr can offset ordinary (W-2) income if you actively participate and your MAGI is under $100k (phasing out to $0 by $150k); unused losses carry forward. On sale, claimed depreciation is recaptured at up to 25%, and gains may owe capital-gains tax (a 1031 exchange can defer both). Figures are a year-1 estimate at your 24.0% rate — not tax advice; consult a CPA.
Schools (NCES district)
- District
- RSU 02
- NCES district ID
- 2314776
- Math proficiency
- 83% ▲ 56.00%
- Reading proficiency
- 87% ▲ 34.00%
- Median HH income
- $52,565
- Composite
- 72.04/100
- National rank
- #208
- State rank
- #52 of 112 in ME
Livability — Hallowell
- Score
- 71/100
- State rank
- #60
- US rank
- #6567
Category grades
Schools grade is shown separately in the Schools card above.
Census & demographics
- Census place
- Hallowell, ME
- City population
- 2,570
- Population (ZIP)
- 2,570
Population outlook (Kennebec County) Hauer SSP2
- Today (2025)
- 115,421 people
- By 2030
- 111,852 · -3.1%
- By 2040
- 103,757 · -10.1%
- By 2050
- 95,710 · -17.1%
- By 2075
- 78,172 · -32.3%
- By 2100
- 59,500 · -48.4%
Race, ethnicity, and origin ACS 2023
- Neighborhood character
- Predominantly White (99%)
- Race & ethnicity
- White 99%
- Common ancestry
- Lithuanian 14% Slovak 6% Scotch-Irish 5%
- Foreign-born
- 3%
- Languages at home
- 94% English-only · French/Haitian/Cajun 3% German/W. Germanic 1% Russian/Polish/Slavic 1%
Political lean MEDSL · Kennebec
- 2024 margin
- Toss-up / Even · D 47.5% · R 50.2% · Other 2.4%
- 2008→2024 swing
- -17.5pp toward R · 2008: 14.8pp · 2024: -2.8pp
- All cycles
- 2024: R+2.8 2020: D+0.2 2016: R+3.7 2012: D+13.5 2008: D+14.8
Not yet ingested
- Civics
- —
Market trends
- HPI YoY
- ▼ -16.84%
- Current HPI
- 343.1609
- Rent YoY
- —
- Metro
- —
- State GDP YoY
- —
- F500 in state
- 0
Price history
-7.4% since first listed2 events — show timeline
- 2026-05-19 Listed $175,000 MREIS
- 2025-10-14 Price Changed $189,000 MREIS
Property tax history
+3.6%/yrLatest (2025): $2,130 · -4.0% YoY. Source: county tax records.
Cash-flow waterfall
monthlySold comps — $/sqft
last 12 mo · ≤1 miLoading sold comps…