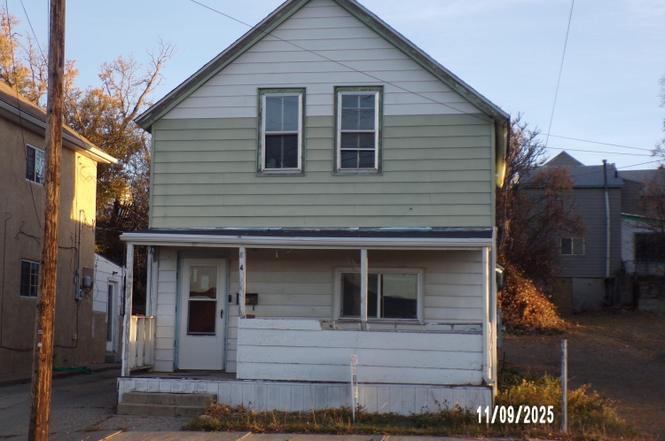
814 E Main St · Trinidad, CO
Flood risk No data
- FEMA flood zone
- —
- Chance of flooding over 30 yrs
- —
- Est. flood insurance / yr
- —
Fire risk No data
- Est. fire insurance / yr
- —
Heat risk No data
- Hot days now (above threshold)
- —
- Hot days in 30 yrs
- —
Wind risk No data
- Chance of severe wind over 30 yrs
- —
Air-quality risk No data
- Unhealthy air days now
- —
- Unhealthy air days in 30 yrs
- —
Risk factors via First Street. Map © Google.
Why this score? — see what drove the D grade
The composite is a weighted blend of 9 inputs, each scored 0–100. Each bar is that input's sub-score; the figure is the points it added to the 100-point composite (weight × sub-score).
- Cash flow +15.3/30.0
- ARV discount +12.0/15.0
- DSCR +4.7/10.0
- 1% rule +2.9/10.0
- Livability +2.9/5.0
- Rent growth +2.5/5.0
- Condition / age +2.5/5.0
- Schools +1.4/10.0
- Appreciation +0.0/10.0
$150,000
🖨 Deal sheet (PDF) 📄 Offer letter ✓ Due diligence
Listing remarks
Centrally located on Main Street. Walk to Businesses, Parks, Eateries and Convenience Store w/ gas station. Family Home with 4 bedrooms, two baths. carport and off street parking. Home needs some upgrading. Small yard to care for. View of Simpsons Rest.
Key facts
- Walk to eateries
- Walk to businesses
- Centrally located
Tags
Property features AI
Exterior
- Security: Smoke detector(s)
- Utilities: Public water; 100 Amp electrical service; Cable available; Phone service available
- Home design: Single family residence; One and one half levels; Residential property
- Construction: Frame construction; Vinyl siding; Composition roof
- Exterior features: Covered porch
Interior
- Kitchen: Electric range; Refrigerator
- Flooring: Carpet; Vinyl
- Bathrooms: 1 full bathroom; 1 three-quarter bathroom
- Heating & cooling: Forced air heating; Natural gas heating; Heating present
- Interior features: Ceiling fan(s); Partial basement; Has basement; 8 total rooms
Neighborhood map
What this means for you Summary
Snapshot
- This is a 3-bed/1.0-bath single-family listed at $150k.
Deal economics
- At list price, monthly cash flow is $54 ($643/yr) — positive.
- The deal already cash-flows at list — no discount required.
- To meet the 1% rule (rent ≥ 1% of price), the offer needs to be $118k (21.4% below list).
- Recommended offer: $118k (21.4% below list) — sets the bar for 1% rule.
- Cap rate 6.7% vs local median 3.1% in Trinidad — top-decile yield for the area; either an underpriced asset or a hidden risk that comps aren't pricing in. Stress-test before assuming the spread holds.
Location & tenants
- Location reads 58/100 on livability (#303 in CO) — a working-class tenant base; expect higher turnover. Strengths: cost of living A+, health & safety A+, housing A; Watch: crime F, amenities F, commute F.
- Trinidad School District 1 In The County Of Las Animas And (town): math 6% / reading 27% proficiency, ranked #82 of 86 in CO (top 95%) — low school quality limits family demand, transient renter base, plan for 1-2y turnover.
- Zoned schools: Fisher'S Peak Elementary School (math 5% / reading 22%, grade F, #824 of 966 statewide, top 88%, 403 students, 76% FRL); Trinidad Middle School (math 2% / reading 15%, grade F, #251 of 270 statewide, top 94%, 180 students, 74% FRL); Trinidad High School (math 15% / reading 44%, grade F, #233 of 381 statewide, top 64%, 213 students, 62% FRL).
- Market conditions: 264 active listings in the ZIP; 43 units permitted in Las Animas County in 2024 (0 in 5+ unit buildings).
Forward outlook
- Local home prices are declining (-3.0%/yr); year-one equity from $1k of loan paydown is wiped out by about $4k of value loss. Plan a longer hold.
- Las Animas County population projected at -40% by 2050 — secular population decline; favor cash flow + early exit over multi-decade hold.
Negotiation context
- It's been on market 227 days — a 12% lower offer ($132k) is reasonable based on typical stale-listing flexibility.
- 4 sale attempts; this cycle's ask is 13536% above the opening price — seller raised mid-cycle; expect resistance to lowballs.
Risks & watch-outs
- Watch-outs: built in 1917 — expect roof / HVAC / electrical / plumbing capex.
Questions for the listing agent
- It's been on market 227 days. Have you received any prior offers? Is the seller open to a 21% concession, seller financing, or rate buy-down credit?
- Built in 1917 — when were the roof, HVAC, electrical panel, plumbing, and water heater last replaced?
- Why hasn't it sold? Are there any deal-killer items the seller is aware of (foundation, flood, title, zoning, code violations)?
- Is there a deadline driving the sale (1031 exchange, divorce, estate, relocation)? That informs how much negotiation room exists.
- Schools are F-rated, which usually means shorter tenancies and higher turnover. Who's the typical renter profile here, and what's been the actual vacancy rate?
- Crime grade is F in this area — have there been break-ins, vandalism, or insurance claims at this property in the last 3 years? What carrier currently insures it and at what premium?
- The area grade is low — what's the realistic commute time and amenity access for the typical tenant pool here? Any planned neighborhood developments (good or bad) we should know about?
- What's the average days-on-market for RENTAL listings here right now (not sales)? A rising rental-DOM trend means longer vacancies and softer asking-rent achievability than the comps imply.
- What's the recent tenant-quality profile in this submarket — average credit score on applications, eviction rate, late-payment / NSF rate, and stable-employment percentage? A property-management company in the area should have these aggregated.
- How much new for-sale + rental construction is in the pipeline within 1–3 miles? Heavy new supply typically softens prices + rents 12–24 months out; constrained supply supports both.
Investment metrics
- 1% rule
- 0.79% ✗
- Cap rate
- 6.72%
- Cash-on-cash
- 1.53%
- DSCR
- 1.07
- GRM
- 10.6
CMA / ARV
- ARV (on-the-fly)
- $166,848
- Comps found
- 12
Show comp detail 12 sales within ~0.75 mi
| Address | Dist | Beds/Ba | Sqft | Sold | Price | $/sf | Match |
|---|---|---|---|---|---|---|---|
| 314 S Denver Ave | 0.16mi | 2/1.0 (-1) | 1,267 (+0%) | 1mo | $145,000 | $114 | 87 |
| 404 S Spruce Ave | 0.23mi | 3/1.0 | 1,194 (-6%) | 14mo | $33,000 | $28 | 68 |
| 301 S Convent St | 0.55mi | 3/1.0 | 1,216 (-4%) | 2mo | $185,000 | $152 | 67 |
| 601 E 8th St | 0.41mi | 2/1.0 (-1) | 1,321 (+4%) | 4mo | $154,500 | $117 | 66 |
| 323 E Baca St | 0.60mi | 3/1.0 | 1,269 (+0%) | 10mo | $255,000 | $201 | 63 |
| 409 S Oak St | 0.23mi | 2/2.5 (-1) | 1,134 (-10%) | 4mo | $150,000 | $132 | 58 |
| 114 N Gordon St | 0.25mi | 2/1.0 (-1) | 1,100 (-13%) | 5mo | $115,000 | $105 | 57 |
| 1009 Grant Ave | 0.73mi | 2/1.0 (-1) | 1,237 (-2%) | 4mo | $211,000 | $171 | 54 |
| 800 Baltimore Ave | 0.46mi | 3/1.0 | 1,079 (-15%) | 6mo | $105,000 | $97 | 49 |
| 403 High St | 0.74mi | 2/2.0 (-1) | 1,354 (+7%) | 1mo | $235,000 | $174 | 44 |
| 307 E Topeka Ave | 0.67mi | 2/1.0 (-1) | 1,135 (-10%) | 12mo | $145,000 | $128 | 37 |
| 315 High St | 0.74mi | 4/2.0 (+1) | 1,420 (+12%) | 3mo | $192,500 | $136 | 33 |
Match score weights: distance 35% · size 25% · config 20% · recency 20%. Top-matched comps best support the ARV.
Projected returns pro-forma
-3.0% appreciation · 3.0% rent growth · sell at horizon
- IRR
- -13.9%
- Equity multiple
- 0.50×
- Total profit
- $-20,975
- Equity at exit
- $22,365
- IRR
- -5.2%
- Equity multiple
- 0.66×
- Total profit
- $-14,196
- Equity at exit
- $12,969
Cash invested: $42,000 (down + closing). Projections, not guarantees.
Landlord ↔ Tenant lean methodology
- Overall (STATE)
- 38 Tenant-Leaning
- State Colorado
- 38 Tenant-Leaning · D+4
- County
- — inherits STATE
- City
- — inherits STATE
ZIP-level market 81082
- Home prices YoY
- -21.1%
- Active inventory
- 264
- Price-to-rent
- 10.6×
Monthly cashflow live
- Estimated rent
- $1,179 medium interval (Pro) →
- Mortgage (P&I)
- −$787
- Tax from tax record
- −$29 /mo · $345/yr
- Insurance
- −$62
- HOA
- −$0
- Vacancy / Maint / Mgmt
- −$248
- Net cashflow
- $54
Break-even live
Sensitivity live
| Price | -10% $138 | -5% $96 | +0% $54 | +5% $11 | +10% $-31 |
|---|---|---|---|---|---|
| Rent | -10% $-40 | -5% $7 | +0% $54 | +5% $100 | +10% $147 |
| Rate | -1.0pp $129 | -0.5pp $92 | base $54 | +0.5pp $15 | +1.0pp $-25 |
UW: 25.0% down · 7.5% · 30yr · 1.5% tax · 5.0% vac · 8.0% maint · 8.0% mgmt
Financing live
Cash to close
- Down payment
- $37,500
- Closing costs
- $4,500
- Reserves months
- —
- Total cash needed
- —
Loan-product check · same deal, 3 products live
Conventional
25% down · 7.5% · 30yr
- Down + closing
- —
- Monthly P&I
- —
- Monthly cashflow
- —
- DSCR
- —
- Eligible?
- —
Personal DTI + credit; lowest rate.
DSCR
20% down · 8.5% · 30yr
- Down + closing
- —
- Monthly P&I
- —
- Monthly cashflow
- —
- DSCR
- —
- Eligible?
- —
No personal income docs; deal must DSCR.
Hard money
10% down · 12.0% · 12mo
- Down + closing
- —
- Monthly P&I
- —
- Monthly cashflow
- —
- DSCR
- —
- Eligible?
- —
Short-term bridge; refi at stabilization.
Listing history 25 events
-
2026-06-21days on market $150,000 Active 227 DOM
-
2026-06-21days on market $150,000 Active 226 DOM
-
2026-06-18days on market $150,000 Active 224 DOM
-
2026-06-17days on market $150,000 Active 223 DOM
-
2026-06-16days on market $150,000 Active 222 DOM
-
2026-06-15days on market $150,000 Active 221 DOM
-
2026-06-13days on market $150,000 Active 219 DOM
-
2026-06-12days on market $150,000 Active 218 DOM
-
2026-06-09days on market $150,000 Active 215 DOM
-
2026-06-08days on market $150,000 Active 214 DOM
-
2026-06-07days on market $150,000 Active 213 DOM
-
2026-06-04days on market $150,000 Active 209 DOM
-
2026-06-02days on market $150,000 Active 208 DOM
-
2026-06-01days on market $150,000 Active 207 DOM
-
2026-05-31days on market $150,000 Active 206 DOM
-
2026-05-31days on market $150,000 Active 205 DOM
-
2026-05-01status Active
-
2026-05-01historical
-
2026-04-26historical $1,000
-
2026-04-23price $150,000
-
2026-03-27price $1,000
-
2026-03-26$1,100
-
2025-11-07historical $1,100
-
2025-11-06$169,000 Active
-
2025-09-30$1,100
ⓘ Source: listings_history table (triggers on properties + properties_extension) + one-shot
backfill from property_details.listing_events for pre-trigger history.
Tax reassessment forecast CO · Resets to sale price
- Current annual tax
- $345 · $29/mo
- Projected year-2 tax
- $825 · $69/mo
- Expected delta
- +$480/yr (+$40/mo · 139.2%)
ⓘ Screening estimate from a state-policy table — verify with the county assessor before closing.
Nearby sold comps map
Loading sold comps map…
Walkable amenities ~0.75 mi
Loading nearby amenities…
Taxation est. · year 1
- Rental income
- $14,148
- − Mortgage interest
- −$8,402
- − Property taxes
- −$345
- − Insurance
- −$750
- − Repairs & maintenance
- −$1,132
- − Management
- −$1,132
- − Depreciation
- −$4,364
- Taxable loss
- −$1,976
- Est. tax savings @ 24.0%
- +$474
- After-tax cash flow
- $1,117/yr
For passive investors: Depreciation is non-cash, so a rental often shows a tax loss while cash-flowing — sheltering income. Rental losses are passive: they offset passive income freely, and up to $25,000/yr can offset ordinary (W-2) income if you actively participate and your MAGI is under $100k (phasing out to $0 by $150k); unused losses carry forward. On sale, claimed depreciation is recaptured at up to 25%, and gains may owe capital-gains tax (a 1031 exchange can defer both). Figures are a year-1 estimate at your 24.0% rate — not tax advice; consult a CPA.
Schools (NCES district)
- District
- Trinidad School District 1 In The County Of Las Animas And
- NCES district ID
- 0806960
- Math proficiency
- 6% ▼ -9.00%
- Reading proficiency
- 27% ▼ -3.00%
- Median HH income
- $37,538
- Composite
- 13.74/100
- National rank
- #9493
- State rank
- #82 of 86 in CO
Livability — Trinidad
- Score
- 58/100
- State rank
- #303
- US rank
- #21409
Category grades
Schools grade is shown separately in the Schools card above.
Census & demographics
- Census place
- Trinidad, CO
- Population (ZIP)
- 11,750
Population outlook (Las Animas County) Hauer SSP2
- Today (2025)
- 12,072 people
- By 2030
- 10,972 · -9.1%
- By 2040
- 8,825 · -26.9%
- By 2050
- 7,245 · -40.0%
- By 2075
- 5,139 · -57.4%
- By 2100
- 3,922 · -67.5%
Race, ethnicity, and origin ACS 2023
- Neighborhood character
- Diverse neighborhood (Simpson 0.55)
- Race & ethnicity
- White 53% Hispanic / Latino 41% Two or more races 18% Native American 4% Asian 1% Black 1%
- Hispanic origin (detail)
- Mexican 20%
- Common ancestry
- Romanian 3% Lithuanian 3% Slovak 2%
- Foreign-born
- 3% · Canada
- Languages at home
- 90% English-only · Spanish 8% Other Asian/Pacific 1%
Political lean MEDSL · Las Animas
- 2024 margin
- R (+13.5) · D 42.0% · R 55.5% · Other 2.4%
- 2008→2024 swing
- -20.5pp toward R · 2008: 7.0pp · 2024: -13.5pp
- All cycles
- 2024: R+13.5 2020: R+9.9 2016: R+15.6 2012: D+2.7 2008: D+7.0
Not yet ingested
- Civics
- —
Market trends
- HPI YoY
- ▼ -69.04%
- Current HPI
- 258.5479
- Rent YoY
- —
- Metro
- —
- State GDP YoY
- ▲ 1.95%
- F500 in state
- 14
Industry mix (Fortune 500 HQ in CO)
| Industry | F500 HQs | Revenue |
|---|---|---|
| Technology Distribution | 1 | $31B |
|
||
| Food / Agriculture | 1 | $18B |
|
||
| Packaging | 1 | $14B |
|
||
| Healthcare | 1 | $13B |
|
||
| Energy | 1 | $10B |
|
||
| Technology | 1 | $4B |
|
||
Price history
-9.1% since first listed9 events — show timeline
- 2026-05-01 Relisted — SPMLS
- 2026-05-01 Delisted — SPMLS
- 2026-04-26 Rental Removed $1,000 BUILDIUM
- 2026-04-23 Price Changed $150,000 SPMLS
- 2026-03-27 Price Changed $1,000 BUILDIUM
- 2026-03-26 Listed for Rent $1,100 BUILDIUM
- 2025-11-07 Rental Removed $1,100 BUILDIUM
- 2025-11-06 Listed $169,000 SPMLS
- 2025-09-30 Listed for Rent $1,100 BUILDIUM
Property tax history
+5.3%/yrLatest (2025): $345 · +92.2% YoY. Source: county tax records.
Cash-flow waterfall
monthlySold comps — $/sqft
last 12 mo · ≤1 miLoading sold comps…