 🏗️ New Construction
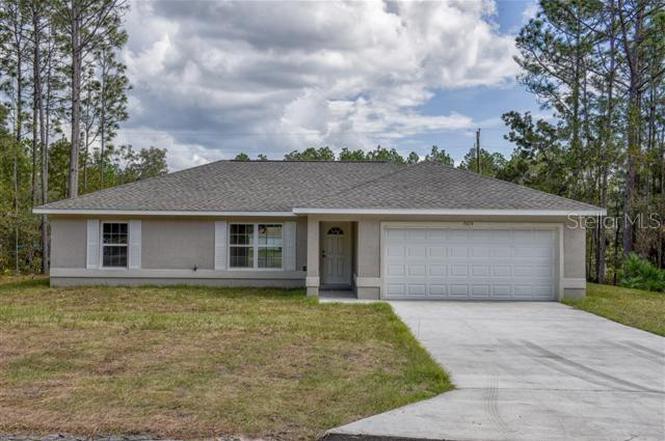
5970 NW 56th Ter · Ocala, FL
Flood risk No data
- FEMA flood zone
- —
- Chance of flooding over 30 yrs
- —
- Est. flood insurance / yr
- —
Fire risk No data
- Est. fire insurance / yr
- —
Heat risk No data
- Hot days now (above threshold)
- —
- Hot days in 30 yrs
- —
Wind risk No data
- Chance of severe wind over 30 yrs
- —
Air-quality risk No data
- Unhealthy air days now
- —
- Unhealthy air days in 30 yrs
- —
Risk factors via First Street. Map © Google.
Why this score? — see what drove the D+ grade
The composite is a weighted blend of 9 inputs, each scored 0–100. Each bar is that input's sub-score; the figure is the points it added to the 100-point composite (weight × sub-score).
- Cash flow +16.0/30.0
- ARV discount +7.5/15.0
- Rent growth +5.0/5.0
- DSCR +4.9/10.0
- 1% rule +4.4/10.0
- Schools +3.6/10.0
- Livability +3.5/5.0
- Condition / age +2.5/5.0
- Appreciation +0.0/10.0
$239,900
🖨 Deal sheet 📄 Offer letter ✓ Due diligence
Listing remarks
Under Construction. BEAUTIFUL BRAND-NEW Custom home. Pictures are of a Model Home and not the actual home. Block with stucco 3 bedroom, 2 bath with attached 2 car garage. Beautiful cabinets accent a gorgeous kitchen. Appliances include Refrigerator, Range with hood and Dishwasher. Walk-in closet in Master. High Efficiency windows.
Key facts
- 0.24 acre lot
- 2 garage spots
- Built 2026
Neighborhood map
What this means for you Summary
Snapshot
- This is a 3-bed/2.0-bath single-family listed at $240k.
Deal economics
- At list price, monthly cash flow is $117 ($1k/yr) — positive.
- The deal already cash-flows at list — no discount required.
- To meet the 1% rule (rent ≥ 1% of price), the offer needs to be $224k (6.5% below list).
- Recommended offer: $224k (6.5% below list) — sets the bar for 1% rule.
- Cap rate 6.9% vs local median 4.2% in Ocala — top-decile yield for the area; either an underpriced asset or a hidden risk that comps aren't pricing in. Stress-test before assuming the spread holds.
Location & tenants
- Location reads 69/100 on livability (#476 in FL) — a middle-class / working-renter tenant base. Strengths: cost of living A+, housing A+, health & safety A+; Watch: crime F, amenities F, commute F.
- Marion (rural): math 42% / reading 43% proficiency, ranked #61 of 73 in FL (top 84%) — families likely to look elsewhere, expect single-tenant / working-renter base with shorter leases; 61% free/reduced lunch — lower-income household profile, screen leases tightly.
- Market conditions: Rents rising fast (+11.1%/yr); 663 active listings in the ZIP; 18 comparable units currently listed for rent nearby; rentals at typical pace (median 21d on market — plan ~3-4 weeks tenant-placement turnaround); 7,071 units permitted in Marion County in 2024 (534 in 5+ unit buildings).
- This rent runs 41% of the median local income ($66k/yr) — at the standard rent-burdened threshold; future hikes will face affordability resistance.
Forward outlook
- Local home prices are declining (-3.0%/yr); year-one equity from $2k of loan paydown is wiped out by about $7k of value loss. Plan a longer hold.
- Marion County population projected at +13% by 2050 — modest demand growth; plan on rents tracking national, not racing it.
Negotiation context
- It's been on market 28 days — a 2% lower offer ($236k) is reasonable based on typical stale-listing flexibility.
Questions for the listing agent
- Is there a deadline driving the sale (1031 exchange, divorce, estate, relocation)? That informs how much negotiation room exists.
- Crime grade is F in this area — have there been break-ins, vandalism, or insurance claims at this property in the last 3 years? What carrier currently insures it and at what premium?
- The area grade is low — what's the realistic commute time and amenity access for the typical tenant pool here? Any planned neighborhood developments (good or bad) we should know about?
- What's the average days-on-market for RENTAL listings here right now (not sales)? A rising rental-DOM trend means longer vacancies and softer asking-rent achievability than the comps imply.
- What's the recent tenant-quality profile in this submarket — average credit score on applications, eviction rate, late-payment / NSF rate, and stable-employment percentage? A property-management company in the area should have these aggregated.
- How much new for-sale + rental construction is in the pipeline within 1–3 miles? Heavy new supply typically softens prices + rents 12–24 months out; constrained supply supports both.
Investment metrics
- 1% rule
- 0.94% ✗
- Cap rate
- 6.88%
- Cash-on-cash
- 2.09%
- DSCR
- 1.09
- GRM
- 8.9
CMA / ARV
- ARV (on-the-fly)
- $239,580
- Comps found
- 12
Show comp detail 12 sales within ~0.75 mi
| Address | Dist | Beds/Ba | Sqft | Sold | Price | $/sf | Match |
|---|---|---|---|---|---|---|---|
| 5632 NW 57th St | 0.21mi | 3/2.0 | 1,331 (0%) | 8mo | $239,900 | $180 | 84 |
| 6174 NW 58th Ter | 0.26mi | 3/2.0 | 1,380 (+4%) | 10mo | $239,900 | $174 | 74 |
| 5430 NW 55th Pl | 0.35mi | 3/2.0 | 1,384 (+4%) | 10mo | $247,000 | $178 | 69 |
| 5585 NW 56th Ter | 0.27mi | 3/2.0 | 1,473 (+11%) | 2mo | $295,000 | $200 | 68 |
| 6535 NW 52 Ave | 0.57mi | 3/2.0 | 1,331 (0%) | 8mo | $239,900 | $180 | 67 |
| 5463 NW 56th Ter | 0.34mi | 3/2.0 | 1,473 (+11%) | 1mo | $292,000 | $198 | 65 |
| 6276 NW 62nd Ave | 0.61mi | 3/2.0 | 1,380 (+4%) | 1mo | $237,000 | $172 | 64 |
| 6006 NW 62nd Pl | 0.40mi | 3/2.0 | 1,464 (+10%) | 2mo | $228,000 | $156 | 63 |
| 6086 NW 53rd Street Rd | 0.60mi | 3/2.0 | 1,331 (0%) | 11mo | $239,900 | $180 | 63 |
| 6445 NW 61st Ave | 0.56mi | 3/2.0 | 1,473 (+11%) | 1mo | $290,700 | $197 | 55 |
| 5787 NW 62nd Ave | 0.55mi | 3/2.0 | 1,473 (+11%) | 4mo | $290,700 | $197 | 54 |
| 6354 NW 61st Ln | 0.70mi | 3/2.0 | 1,232 (-7%) | 10mo | $225,000 | $183 | 47 |
Match score weights: distance 35% · size 25% · config 20% · recency 20%. Top-matched comps best support the ARV.
Projected returns pro-forma
-3.0% appreciation · 8.0% rent growth · sell at horizon
- IRR
- -7.5%
- Equity multiple
- 0.71×
- Total profit
- $-19,494
- Equity at exit
- $35,722
- IRR
- 7.5%
- Equity multiple
- 1.70×
- Total profit
- $46,704
- Equity at exit
- $20,714
Cash invested: $67,082 (down + closing). Projections, not guarantees.
Landlord ↔ Tenant lean methodology
- Overall (STATE)
- 87 Strongly Landlord-Friendly
- State Florida
- 87 Strongly Landlord-Friendly · R+3
- County
- — inherits STATE
- City
- — inherits STATE
ZIP-level market 34482
- Rents YoY
- 11.1%
- Active inventory
- 663
- Price-to-rent
- 8.9×
Monthly cashflow live
- Estimated rent
- $2,244 high interval (Pro) →
- Mortgage (P&I)
- −$1,256
- Tax est. 1.5%
- −$299 /mo · $3,594/yr
- Insurance
- −$100
- HOA
- −$0
- Vacancy / Maint / Mgmt
- −$471
- Net cashflow
- $117
Break-even live
UW: 25.0% down · 7.5% · 30yr · 1.5% tax · 5.0% vac · 8.0% maint · 8.0% mgmt
Financing live
Cash to close
- Down payment
- $59,895
- Closing costs
- $7,187
- Reserves months
- —
- Total cash needed
- —
Loan-product check · same deal, 3 products live
Conventional
25% down · 7.5% · 30yr
- Down + closing
- —
- Monthly P&I
- —
- Monthly cashflow
- —
- DSCR
- —
- Eligible?
- —
Personal DTI + credit; lowest rate.
DSCR
20% down · 8.5% · 30yr
- Down + closing
- —
- Monthly P&I
- —
- Monthly cashflow
- —
- DSCR
- —
- Eligible?
- —
No personal income docs; deal must DSCR.
Hard money
10% down · 12.0% · 12mo
- Down + closing
- —
- Monthly P&I
- —
- Monthly cashflow
- —
- DSCR
- —
- Eligible?
- —
Short-term bridge; refi at stabilization.
Rent comps 18 comps
| Address | Beds | Baths | Sqft | Rent | $/sqft | DOM | Units | Dist |
|---|---|---|---|---|---|---|---|---|
| 5532 NW 57th Pl Ocala, FL | 2.0 | 2.0 | 962 | $1,295 | $1.35 | 13d | 1 | 0.19mi |
| 6175 NW 59th Ave Ocala, FL | 3.0 | 2.0 | 1384 | $1,745 | $1.26 | 21d | 1 | 0.27mi |
| 5391 NW 55th Ct Ocala, FL | 3.0 | 2.0 | 1332 | $1,650 | $1.24 | 21d | 1 | 0.41mi |
| 5907 NW 64th St Ocala, FL | 4.0 | 2.0 | 1313 | $1,699 | $1.29 | 21d | 1 | 0.43mi |
| 6425 NW 62nd Ter Ocala, FL | 3.0 | 2.0 | 1349 | $3,000 | $2.22 | 21d | 1 | 0.68mi |
| 5389 NW 48th Pl Ocala, FL | 2.0 | 2.0 | 1552 | $2,300 | $1.48 | 21d | 1 | 0.82mi |
| 5375 NW 48th Pl Ocala, FL | 2.0 | 2.0 | 1565 | $2,350 | $1.50 | 21d | 1 | 0.83mi |
| 5293 NW 48th Pl Ocala, FL | 2.0 | 2.0 | 1552 | $2,450 | $1.58 | 21d | 1 | 0.84mi |
| 5358 NW 48th Pl Ocala, FL | 3.0 | 2.0 | 1565 | $2,500 | $1.60 | 21d | 1 | 0.86mi |
| 5237 NW 48th Pl Ocala, FL | 3.0 | 2.0 | 1552 | $4,500 | $2.90 | 21d | 1 | 0.86mi |
| 5416 NW 46th Lane Rd Ocala, FL | 3.0 | 2.0 | 1590 | $2,300 | $1.45 | 13d | 1 | 0.89mi |
| 5347 NW 46th Lane Rd Ocala, FL | 3.0 | 2.0 | 1552 | $2,550 | $1.64 | 21d | 1 | 0.93mi |
| 5254 NW 43rd Lane Rd Ocala, FL | 3.0 | 2.0 | 1728 | $3,500 | $2.03 | 21d | 1 | 0.95mi |
| 5521 NW 45th Ln Ocala, FL | 3.0 | 2.0 | 1862 | $2,600 | $1.40 | 13d | 1 | 0.97mi |
| 6440 NW 66th Ct Ocala, FL | 3.0 | 2.0 | 992 | $1,695 | $1.71 | 13d | 1 | 1.08mi |
| 4395 NW 55th Ter Ocala, FL | 3.0 | 2.0 | 1853 | $2,700 | $1.46 | 21d | 1 | 1.12mi |
| 5530 NW 40th Loop Ocala, FL | 3.0 | 2.0 | 1622 | $2,000 | $1.23 | 21d | 1 | 1.31mi |
| 4122 NW 48th Terrace Rd Ocala, FL | 2.0 | 2.0 | 1816 | $1,999 | $1.10 | 13d | 1 | 1.46mi |
Listing history 2 events
-
2026-03-25status Pending
-
2026-02-25$239,900 Active
ⓘ Source: listings_history table (triggers on properties + properties_extension) + one-shot
backfill from property_details.listing_events for pre-trigger history.
Nearby sold comps map
Loading sold comps map…
Walkable amenities ~0.75 mi
Loading nearby amenities…
Taxation est. · year 1
- Rental income
- $26,923
- − Mortgage interest
- −$13,420
- − Property taxes
- −$3,594
- − Insurance
- −$1,198
- − Repairs & maintenance
- −$2,154
- − Management
- −$2,154
- − Depreciation
- −$6,970
- Taxable loss
- −$2,566
- Est. tax savings @ 24.0%
- +$616
- After-tax cash flow
- $2,017/yr
For passive investors: Depreciation is non-cash, so a rental often shows a tax loss while cash-flowing — sheltering income. Rental losses are passive: they offset passive income freely, and up to $25,000/yr can offset ordinary (W-2) income if you actively participate and your MAGI is under $100k (phasing out to $0 by $150k); unused losses carry forward. On sale, claimed depreciation is recaptured at up to 25%, and gains may owe capital-gains tax (a 1031 exchange can defer both). Figures are a year-1 estimate at your 24.0% rate — not tax advice; consult a CPA.
Schools (NCES district)
- District
- Marion
- NCES district ID
- 1201260
- Math proficiency
- 42% ▼ -7.00%
- Reading proficiency
- 43% ▼ -4.00%
- Median HH income
- $40,015
- Composite
- 35.61/100
- National rank
- #4890
- State rank
- #61 of 73 in FL
Livability — Ocala
- Score
- 69/100
- State rank
- #476
- US rank
- #8461
Category grades
Schools grade is shown separately in the Schools card above.
Census & demographics
- County
- Marion County · 315,796 people
- City population
- 263,375
- Metro
- Ocala, FL
- Population (ZIP)
- 22,807
- Household income
- $65,901
- Rent vs Own
- Severe rent burden
- 282.0
Population outlook (Marion County) Hauer SSP2
- Today (2025)
- 365,905 people
- By 2030
- 376,768 · +3.0%
- By 2040
- 396,555 · +8.4%
- By 2050
- 412,723 · +12.8%
- By 2075
- 446,090 · +21.9%
- By 2100
- 436,193 · +19.2%
Race, ethnicity, and origin ACS 2023
- Neighborhood character
- Majority White (63%)
- Race & ethnicity
- White 63% Hispanic / Latino 19% Black 14% Two or more races 12%
- Hispanic origin (detail)
- Mexican 6% Puerto Rican 9% Cuban 2%
- Common ancestry
- Lithuanian 2% Romanian 2% Slovak 2%
- Foreign-born
- 10% · Canada
- Languages at home
- 81% English-only · Spanish 16% Other Indo-European 1%
Political lean MEDSL · Marion
- 2024 margin
- Solid R (+31.6) · D 33.8% · R 65.5%
- 2008→2024 swing
- -20.0pp toward R · 2008: -11.6pp · 2024: -31.6pp
- All cycles
- 2024: R+31.6 2020: R+25.9 2016: R+26.2 2012: R+16.2 2008: R+11.6
Not yet ingested
- Civics
- —
Market trends
- HPI YoY
- ▼ -133.62%
- Current HPI
- 194.3857
- Rent YoY
- ▲ 11.12%
- Metro
- Ocala, FL
- State GDP YoY
- ▲ 3.28%
- F500 in state
- 36
Industry mix (Fortune 500 HQ in FL)
| Industry | F500 HQs | Revenue |
|---|---|---|
| Industrial Technology | 2 | $29B |
|
||
| Insurance | 2 | $17B |
|
||
| Retail | 1 | $60B |
|
||
| Technology Distribution | 1 | $58B |
|
||
| Homebuilding | 1 | $35B |
|
||
| Technology Manufacturing | 1 | $35B |
|
||
Price history
2 events — show timeline
- 2026-03-25 Pending — Stellar MLS as Distributed by MLS Grid
- 2026-02-25 Listed $239,900 Stellar MLS as Distributed by MLS Grid
Cash-flow waterfall
monthlySold comps — $/sqft
last 12 mo · ≤1 miLoading sold comps…