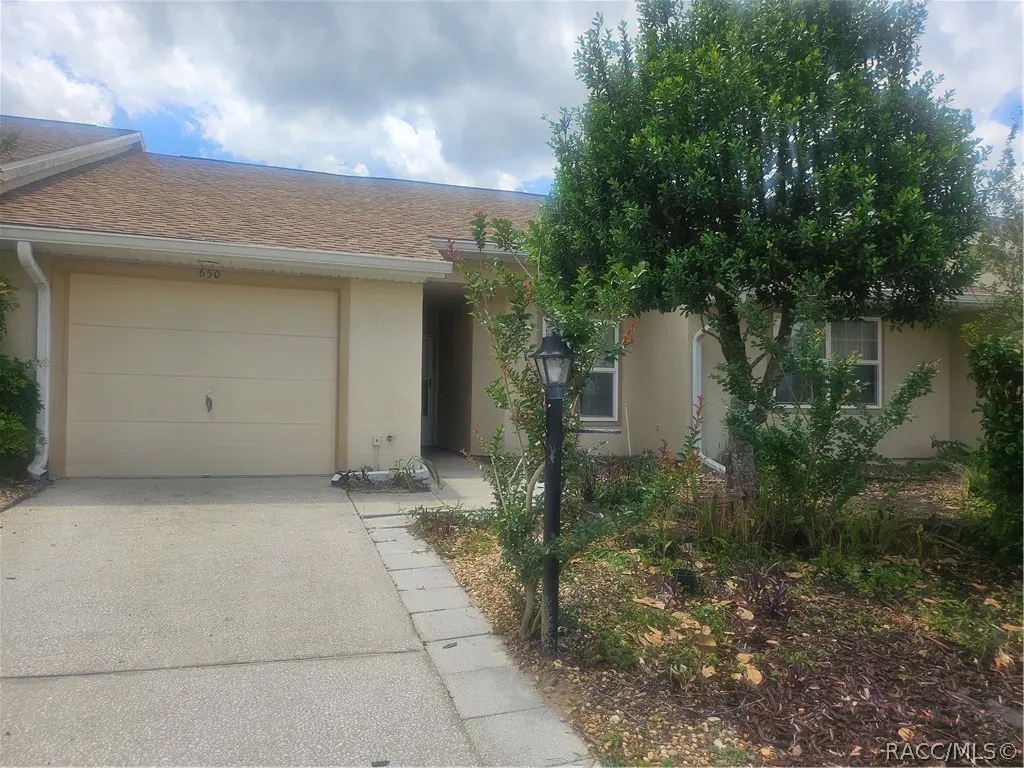
650 W Diamondbird Loop · Pine Ridge, FL
Flood risk 1/10 · Minimal
- FEMA flood zone
- X (unshaded)
- Chance of flooding over 30 yrs
- 0.0%
- Est. flood insurance / yr
- $507 – $1,088
Fire risk 3/10 · Minor
- Est. fire insurance / yr
- $947 – $1,759
Heat risk 9/10 · Severe
- Hot days now (above 108°F)
- 7 days/yr
- Hot days in 30 yrs
- 24 days/yr
Wind risk 9/10 · Severe
- Chance of severe wind over 30 yrs
- 99.0%
Air-quality risk 1/10 · Minimal
- Unhealthy air days now
- 0 days/yr
- Unhealthy air days in 30 yrs
- 0 days/yr
Risk factors via First Street. Map © Google.
Why this score? — see what drove the D grade
The composite is a weighted blend of 9 inputs, each scored 0–100. Each bar is that input's sub-score; the figure is the points it added to the 100-point composite (weight × sub-score).
- Cash flow +13.4/30.0
- ARV discount +7.5/15.0
- 1% rule +4.8/10.0
- Schools +4.1/10.0
- DSCR +4.0/10.0
- Livability +3.4/5.0
- Rent growth +2.5/5.0
- Condition / age +2.5/5.0
- Appreciation +0.0/10.0
$179,900
🖨 Deal sheet (PDF) 📄 Offer letter ✓ Due diligence
Listing remarks
Welcome to Forest Ridge Villas in a Maintenance Free Community. SELLER Financing Available to Qualified Buyer. The HOA includes cable, internet and lawn Service. The community has a pool and clubhouse that hosts many community wide activities. The community is within walking distance to the Shoppes at Black Diamond and the Tampa General Hospital that is coming soon. The Shoppes at Black Diamond are a few miles away. Jump on the Suncoast Parkway that is a great way to get to the airport and Tampa. The roof is newer and the AC was installed in 2016. The laundry room is large and located inside the living area. Enjoy your large Screened in lanai that looks out to the backyard. Make this one
Key facts
- Newer roof
- $323 HOA
- Garage
Tags
Property features AI
Finance
- HOA & community: Homeowners association with monthly fee of $323; HOA includes cable TV and grounds maintenance
Exterior
- Parking: Attached garage with 1 garage space; Driveway parking; Garage door opener; Paved parking
- Utilities: Public water; Public sewer
- Home design: Residential condominium; Single-story (one level); North-facing
- Construction: Frame and stucco construction; Asphalt shingle roof
- Exterior features: Community pool; Clubhouse; Paved road access; Rolling slope / hilly topography
Interior
- Kitchen: Dishwasher; Electric oven / Range; Refrigerator; Disposal
- Flooring: Carpet; Laminate
- Bathrooms: 2 full bathrooms
- Heating & cooling: Central heating (Electric, Heat Pump); Central air conditioning
- Interior features: Dryer, Dishwasher, Electric Oven, Disposal, Oven, Range, Refrigerator, Washer; 5 total rooms
- Laundry & utility: Washer and Dryer included
Neighborhood map
What this means for you Summary
Snapshot
- This is a 2-bed/2.0-bath condo listed at $180k.
Deal economics
- At list price, monthly cash flow is $2 ($22/yr) — positive.
- The deal already cash-flows at list — no discount required.
- To meet the 1% rule (rent ≥ 1% of price), the offer needs to be $177k (1.9% below list).
- Recommended offer: $175k (3.0% below list) — sets the bar for market timing.
- Cap rate 6.3% vs local median 3.4% in Pine Ridge — top-decile yield for the area; either an underpriced asset or a hidden risk that comps aren't pricing in. Stress-test before assuming the spread holds.
Location & tenants
- Location reads 67/100 on livability (#565 in FL) — a middle-class / working-renter tenant base. Strengths: crime A+, housing A+, cost of living A-; Watch: health & safety C-, amenities F, commute F.
- Citrus (rural): math 49% / reading 50% proficiency, ranked #44 of 73 in FL (top 60%) — families likely to look elsewhere, expect single-tenant / working-renter base with shorter leases.
- Zoned schools: Forest Ridge Elementary School (math 55% / reading 59%, grade C+, #781 of 2,144 statewide, top 38%, 708 students, 67% FRL); Lecanto Middle School (math 49% / reading 49%, grade C-, #265 of 571 statewide, top 48%, 809 students, 55% FRL); Lecanto High School (math 46% / reading 53%, grade D, #179 of 667 statewide, top 29%, 1,630 students, 46% FRL) — zoned schools at 56% FRL track the district average.
- Market conditions: 448 active listings in the ZIP; 26 comparable units currently listed for rent nearby; rentals at typical pace (median 23d on market — plan ~3-4 weeks tenant-placement turnaround); 2,443 units permitted in Citrus County in 2024 (0 in 5+ unit buildings).
- This rent runs 37% of the median local income ($57k/yr) — at the standard rent-burdened threshold; future hikes will face affordability resistance.
Forward outlook
- Local home prices are declining (-3.0%/yr); year-one equity from $1k of loan paydown is wiped out by about $5k of value loss. Plan a longer hold.
- Citrus County population projected to shrink 10% by 2050 — rents likely to lag national; underwrite the cash flow, not the appreciation.
Negotiation context
- It's been on market 47 days — a 3% lower offer ($175k) is reasonable based on typical stale-listing flexibility.
- Current owner paid $118k; list at $180k implies a 52% gain — meaningful room to come down on a strong offer.
Risks & watch-outs
- Climate carrying-cost: severe wind risk, 99% chance of damaging wind over 30y; extreme-heat days projected 7→24/yr by 2055 (HVAC capex compounding) — expect insurance premiums to compound above CPI over the hold.
Questions for the listing agent
- It's been on market 47 days. Have you received any prior offers? Is the seller open to a 3% concession, seller financing, or rate buy-down credit?
- What does the HOA fee cover, when was the last increase, and are there any pending special assessments or reserve-fund shortfalls?
- Any open or pending special assessments — roof, HVAC, plumbing, elevator, façade? What's the per-unit balance and payoff schedule, and is the seller paying it off at close or rolling it to the buyer?
- Is there a deadline driving the sale (1031 exchange, divorce, estate, relocation)? That informs how much negotiation room exists.
- Schools are F-rated, which usually means shorter tenancies and higher turnover. Who's the typical renter profile here, and what's been the actual vacancy rate?
- The area grade is low — what's the realistic commute time and amenity access for the typical tenant pool here? Any planned neighborhood developments (good or bad) we should know about?
- What's the average days-on-market for RENTAL listings here right now (not sales)? A rising rental-DOM trend means longer vacancies and softer asking-rent achievability than the comps imply.
- What's the recent tenant-quality profile in this submarket — average credit score on applications, eviction rate, late-payment / NSF rate, and stable-employment percentage? A property-management company in the area should have these aggregated.
- How much new apartment / multifamily construction is in the pipeline within 1–3 miles? Heavy new supply (>2% of stock underway) typically softens rents 12–24 months out; light construction supports rent growth.
Investment metrics
- 1% rule
- 0.98% ✗
- Cap rate
- 6.31%
- Cash-on-cash
- 0.04%
- DSCR
- 1.00
- GRM
- 8.5
CMA / ARV
No comps found within radius.
Projected returns pro-forma
-3.0% appreciation · 3.0% rent growth · sell at horizon
- IRR
- -16.2%
- Equity multiple
- 0.43×
- Total profit
- $-28,914
- Equity at exit
- $26,824
- IRR
- -7.7%
- Equity multiple
- 0.51×
- Total profit
- $-24,542
- Equity at exit
- $15,554
Cash invested: $50,372 (down + closing). Projections, not guarantees.
Landlord ↔ Tenant lean methodology
- Overall (STATE)
- 87 Strongly Landlord-Friendly
- State Florida
- 87 Strongly Landlord-Friendly · R+3
- County
- — inherits STATE
- City
- — inherits STATE
ZIP-level market 34442
- Home prices YoY
- -21.9%
- Active inventory
- 448
- Price-to-rent
- 8.5×
Monthly cashflow live
- Estimated rent
- $1,765 high interval (Pro) →
- Mortgage (P&I)
- −$943
- Tax from tax record
- −$51 /mo · $617/yr
- Insurance
- −$75
- HOA
- −$323
- Vacancy / Maint / Mgmt
- −$371
- Net cashflow
- $2
Break-even live
Sensitivity live
| Price | -10% $104 | -5% $53 | +0% $2 | +5% $-49 | +10% $-100 |
|---|---|---|---|---|---|
| Rent | -10% $-138 | -5% $-68 | +0% $2 | +5% $72 | +10% $141 |
| Rate | -1.0pp $92 | -0.5pp $48 | base $2 | +0.5pp $-45 | +1.0pp $-92 |
UW: 25.0% down · 7.5% · 30yr · 1.5% tax · 5.0% vac · 8.0% maint · 8.0% mgmt
Financing live
Cash to close
- Down payment
- $44,975
- Closing costs
- $5,397
- Reserves months
- —
- Total cash needed
- —
Loan-product check · same deal, 3 products live
Conventional
25% down · 7.5% · 30yr
- Down + closing
- —
- Monthly P&I
- —
- Monthly cashflow
- —
- DSCR
- —
- Eligible?
- —
Personal DTI + credit; lowest rate.
DSCR
20% down · 8.5% · 30yr
- Down + closing
- —
- Monthly P&I
- —
- Monthly cashflow
- —
- DSCR
- —
- Eligible?
- —
No personal income docs; deal must DSCR.
Hard money
10% down · 12.0% · 12mo
- Down + closing
- —
- Monthly P&I
- —
- Monthly cashflow
- —
- DSCR
- —
- Eligible?
- —
Short-term bridge; refi at stabilization.
Rent comps 26 comps
| Address | Beds | Baths | Sqft | Rent | $/sqft | DOM | Units | Dist |
|---|---|---|---|---|---|---|---|---|
| 703 W Sunbird Path Hernando, FL | 2.0 | 2.0 | 1298 | $1,700 | $1.31 | 23d | 1 | 0.03mi |
| 3263 N Maidencane Dr Beverly Hills, FL | 2.0 | 1.0 | 1380 | $1,350 | $0.98 | 23d | 1 | 0.46mi |
| 144 W Sugarmaple Ln Beverly Hills, FL | 3.0 | 2.0 | 1600 | $1,700 | $1.06 | 23d | 1 | 0.54mi |
| 229 W Casurina Pl Beverly Hills, FL | 3.0 | 2.0 | 1604 | $1,399 | $0.87 | 23d | 1 | 0.56mi |
| 877 W Silver Meadow Loop Hernando, FL | 3.0 | 2.0 | 1637 | $2,500 | $1.53 | 23d | 1 | 0.71mi |
| 3660 N Laurelwood Loop Beverly Hills, FL | 2.0 | 2.5 | 1543 | $1,800 | $1.17 | 23d | 1 | 0.74mi |
| 95 S Desoto St Beverly Hills, FL | 2.0 | 2.0 | 1152 | $1,435 | $1.25 | 23d | 1 | 0.74mi |
| 3442 N Tamarisk Ave Unit NA Beverly Hills, FL | 3.0 | 2.0 | 1530 | $1,800 | $1.18 | 23d | 1 | 0.75mi |
| 1240 W Diamond Shore Loop Hernando, FL | 2.0 | 2.0 | 1770 | $2,900 | $1.64 | 23d | 1 | 0.89mi |
| 1281 W Diamond Shore Loop Hernando, FL | 2.0 | 2.0 | 1686 | $3,000 | $1.78 | 23d | 1 | 0.92mi |
| 95 S Fillmore St Beverly Hills, FL | 2.0 | 1.0 | 1056 | $1,300 | $1.23 | 23d | 1 | 0.97mi |
| 42 Roosevelt Blvd Unit 1 Beverly Hills, FL | 3.0 | 1.5 | 1612 | $1,449 | $0.90 | 23d | 1 | 1.01mi |
| 17 N Davis St Beverly Hills, FL | 2.0 | 1.0 | 1108 | $1,000 | $0.90 | 23d | 1 | 1.06mi |
| 209 S Tyler St Beverly Hills, FL | 2.0 | 2.0 | 1604 | $1,500 | $0.94 | 23d | 1 | 1.06mi |
| 23 N Lee St Beverly Hills, FL | 2.0 | 1.0 | 1416 | $1,350 | $0.95 | 23d | 1 | 1.13mi |
| 45 S Jackson St Beverly Hills, FL | 2.0 | 1.0 | 1108 | $1,275 | $1.15 | 23d | 1 | 1.15mi |
| 41 S Monroe St Beverly Hills, FL | 2.0 | 1.0 | 932 | $1,300 | $1.39 | 23d | 1 | 1.21mi |
| 1882 W Angelica Loop Lecanto, FL | 3.0 | 2.0 | 1706 | $1,900 | $1.11 | 23d | 1 | 1.21mi |
| 1610 W Spring Meadow Loop Lecanto, FL | 2.0 | 2.5 | 1359 | $2,700 | $1.99 | 23d | 1 | 1.24mi |
| 1876 W Shanelle Path Lecanto, FL | 3.0 | 2.0 | 1675 | $2,100 | $1.25 | 23d | 1 | 1.24mi |
| 2280 N Hardee Pt Hernando, FL | 2.0 | 2.0 | 1118 | $1,700 | $1.52 | 23d | 1 | 1.26mi |
| 1984 W Marsten Ct Lecanto, FL | 3.0 | 2.0 | 1854 | $2,000 | $1.08 | 23d | 1 | 1.29mi |
| 1933 W Shanelle Path Lecanto, FL | 3.0 | 2.0 | 1690 | $2,300 | $1.36 | 23d | 1 | 1.29mi |
| 1658 W Spring Meadow Loop Lecanto, FL | 2.0 | 2.5 | 1359 | $1,775 | $1.31 | 23d | 1 | 1.30mi |
| 31 S Barbour St Beverly Hills, FL | 2.0 | 1.0 | 1027 | $1,525 | $1.48 | 23d | 1 | 1.39mi |
| 1559 N Killebrew Pt Unit NA Hernando, FL | 3.0 | 2.0 | 1771 | $2,900 | $1.64 | 23d | 1 | 1.45mi |
HOA detail condo
- Monthly dues
- $323 · $3,876/yr
- Likely covers
- internetcablepool
- Assessments
- None detected in remarks — confirm with the listing agent.
Listing history 22 events
-
2026-06-21days on market $179,900 Active 47 DOM
-
2026-06-19days on market $179,900 Active 45 DOM
-
2026-06-18days on market $179,900 Active 44 DOM
-
2026-06-17days on market $179,900 Active 43 DOM
-
2026-06-16days on market $179,900 Active 42 DOM
-
2026-06-15days on market $179,900 Active 41 DOM
-
2026-06-14days on market $179,900 Active 39 DOM
-
2026-06-13days on market $179,900 Active 38 DOM
-
2026-06-09days on market $179,900 Active 35 DOM
-
2026-06-08days on market $179,900 Active 34 DOM
-
2026-06-07remarks 699-char remark
-
2026-06-07days on market $179,900 Active 33 DOM
-
2026-06-03days on market $179,900 Active 29 DOM
-
2026-06-02days on market $179,900 Active 28 DOM
-
2026-06-01days on market $179,900 Active 27 DOM
-
2026-05-31days on market $179,900 Active 26 DOM
-
2026-05-30days on market $179,900 Active 25 DOM
-
2026-05-05$179,900 Active
-
2005-10-11soldstatus $118,000
-
2005-07-05soldstatus $102,000
-
1995-06-15soldstatus $57,000
-
1995-06-01soldstatus $57,000
ⓘ Source: listings_history table (triggers on properties + properties_extension) + one-shot
backfill from property_details.listing_events for pre-trigger history.
Tax reassessment forecast FL · Resets to sale price
- Current annual tax
- $617 · $51/mo
- Projected year-2 tax
- $1,493 · $124/mo
- Expected delta
- +$877/yr (+$73/mo · 142.2%)
ⓘ Screening estimate from a state-policy table — verify with the county assessor before closing.
Climate risk First Street
- Flood 1/10 Low FEMA zone X (unshaded) · 0% chance over 30 yrs
- Wildfire 3/10 Moderate
- Heat 9/10 Extreme 7 d/yr ≥108°F today · 24 d/yr by 30 yrs out
- Wind 9/10 Extreme 99% chance of damaging wind over 30 yrs
- Air quality 1/10 Low 0 unhealthy d/yr today · 0 by 30 yrs out
Nearby sold comps map
Loading sold comps map…
Walkable amenities ~0.75 mi
Loading nearby amenities…
Taxation est. · year 1
- Rental income
- $21,184
- − Mortgage interest
- −$10,077
- − Property taxes
- −$617
- − Insurance
- −$900
- − Repairs & maintenance
- −$1,695
- − Management
- −$1,695
- − HOA
- −$3,876
- − Depreciation
- −$5,233
- Taxable loss
- −$2,908
- Est. tax savings @ 24.0%
- +$698
- After-tax cash flow
- $720/yr
For passive investors: Depreciation is non-cash, so a rental often shows a tax loss while cash-flowing — sheltering income. Rental losses are passive: they offset passive income freely, and up to $25,000/yr can offset ordinary (W-2) income if you actively participate and your MAGI is under $100k (phasing out to $0 by $150k); unused losses carry forward. On sale, claimed depreciation is recaptured at up to 25%, and gains may owe capital-gains tax (a 1031 exchange can defer both). Figures are a year-1 estimate at your 24.0% rate — not tax advice; consult a CPA.
Schools (NCES district)
- District
- Citrus
- NCES district ID
- 1200270
- Math proficiency
- 49% ▼ -10.00%
- Reading proficiency
- 50% ▼ -6.00%
- Median HH income
- $38,618
- Composite
- 41.28/100
- National rank
- #3519
- State rank
- #44 of 73 in FL
Livability — Pine Ridge
- Score
- 67/100
- State rank
- #565
- US rank
- #10798
Category grades
Schools grade is shown separately in the Schools card above.
Census & demographics
- Census place
- Pine Ridge, FL
- County
- Citrus County · 111,314 people
- City population
- 18,514
- Metro
- Homosassa Springs, FL
- Population (ZIP)
- 17,281
- Household income
- $57,259
- Rent vs Own
- Severe rent burden
- 314.0
Population outlook (Citrus County) Hauer SSP2
- Today (2025)
- 138,622 people
- By 2030
- 136,886 · -1.3%
- By 2040
- 132,009 · -4.8%
- By 2050
- 125,196 · -9.7%
- By 2075
- 108,570 · -21.7%
- By 2100
- 84,454 · -39.1%
Race, ethnicity, and origin ACS 2023
- Neighborhood character
- Predominantly White (90%)
- Race & ethnicity
- White 90% Hispanic / Latino 4% Two or more races 3% Asian 2% Black 2%
- Common ancestry
- Romanian 4% Slovak 4% Lithuanian 3%
- Foreign-born
- 8% · Canada, China, South Korea
- Languages at home
- 93% English-only · Spanish 3% German/W. Germanic 2% Tagalog/Filipino 1%
Political lean MEDSL · Citrus
- 2024 margin
- Solid R (+45.9) · D 26.8% · R 72.6%
- 2008→2024 swing
- -29.8pp toward R · 2008: -16.1pp · 2024: -45.9pp
- All cycles
- 2024: R+45.9 2020: R+41.0 2016: R+39.7 2012: R+21.9 2008: R+16.1
Not yet ingested
- Civics
- —
Market trends
- HPI YoY
- ▼ -76.70%
- Current HPI
- 273.3262
- Rent YoY
- —
- Metro
- Homosassa Springs, FL
- State GDP YoY
- ▲ 3.28%
- F500 in state
- 36
Industry mix (Fortune 500 HQ in FL)
| Industry | F500 HQs | Revenue |
|---|---|---|
| Industrial Technology | 2 | $29B |
|
||
| Insurance | 2 | $17B |
|
||
| Retail | 1 | $60B |
|
||
| Technology Distribution | 1 | $58B |
|
||
| Homebuilding | 1 | $35B |
|
||
| Technology Manufacturing | 1 | $35B |
|
||
Price history
+215.6% since first listed5 events — show timeline
- 2026-05-05 Listed $179,900 RACC
- 2005-10-11 Sold (Public Records) $118,000 Public Records
- 2005-07-05 Sold (Public Records) $102,000 Public Records
- 1995-06-15 Sold (Public Records) $57,000 Public Records
- 1995-06-01 Sold (Public Records) $57,000 Public Records
Property tax history
+1.4%/yrLatest (2025): $617 · +9.5% YoY. Source: county tax records.
Cash-flow waterfall
monthlySold comps — $/sqft
last 12 mo · ≤1 miLoading sold comps…