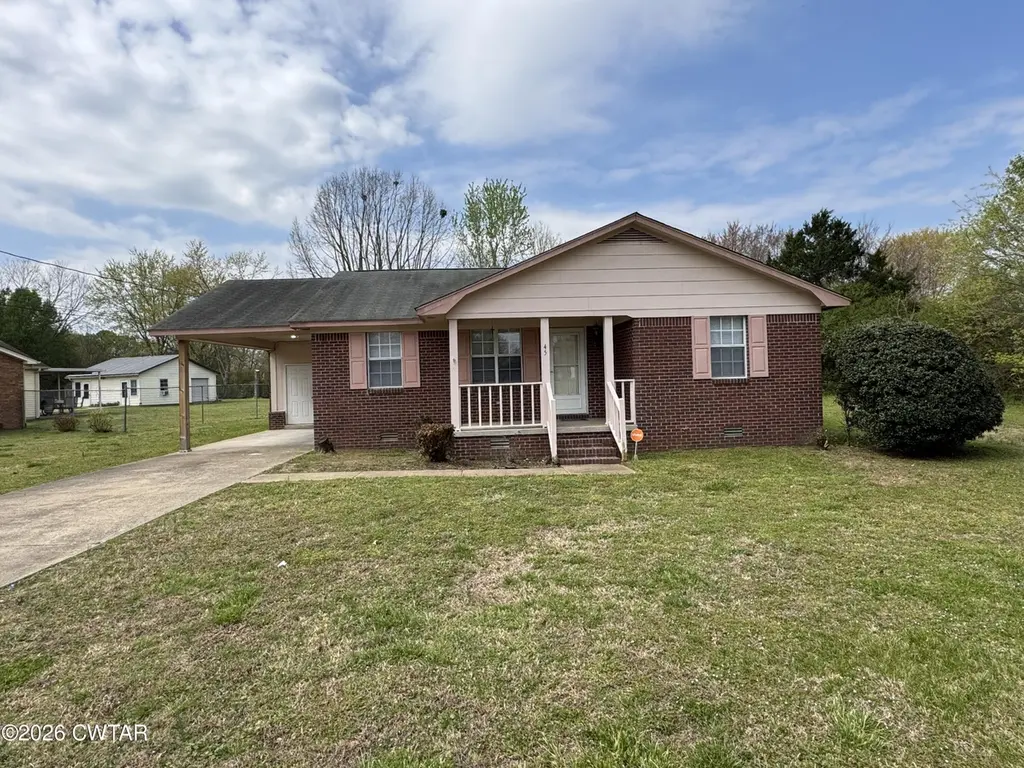
45 Ellendale Cv · Jackson, TN
Flood risk 1/10 · Minimal
- FEMA flood zone
- X (unshaded)
- Chance of flooding over 30 yrs
- 0.0%
- Est. flood insurance / yr
- $507 – $1,088
Fire risk 1/10 · Minimal
- Est. fire insurance / yr
- $949 – $1,763
Heat risk 6/10 · Moderate
- Hot days now (above 109°F)
- 7 days/yr
- Hot days in 30 yrs
- 20 days/yr
Wind risk 4/10 · Minor
- Chance of severe wind over 30 yrs
- 16.0%
Air-quality risk 2/10 · Minimal
- Unhealthy air days now
- 0 days/yr
- Unhealthy air days in 30 yrs
- 1 days/yr
Risk factors via First Street. Map © Google.
Why this score? — see what drove the C+ grade
The composite is a weighted blend of 9 inputs, each scored 0–100. Each bar is that input's sub-score; the figure is the points it added to the 100-point composite (weight × sub-score).
- Cash flow +23.8/30.0
- ARV discount +15.0/15.0
- DSCR +7.7/10.0
- 1% rule +5.0/10.0
- Livability +3.1/5.0
- Rent growth +2.9/5.0
- Condition / age +2.5/5.0
- Schools +1.2/10.0
- Appreciation +0.0/10.0
$159,900
🖨 Deal sheet 📄 Offer letter ✓ Due diligence
Listing remarks
Welcome to 45 Ellendale Cove — a move-in ready home tucked away in a quiet cove setting! This charming property sits on a spacious half-acre lot and features brand new tile flooring throughout, giving it a fresh, updated feel from the moment you walk in. Enjoy the convenience of public water and sewer while still benefiting from county taxes only — a rare and valuable combination! Perfect for first-time buyers, downsizers, or investors, this home offers affordability without sacrificing comfort or location. The large lot provides plenty of room to enjoy outdoor living, entertain, or simply relax in your own private space. Don't miss your chance to own a great home at an afford
Key facts
- Half-acre lot
- Public sewer
- Outdoor living
Tags
Property features AI
Exterior
- Parking: 3 parking spaces total; 1 covered carport space; 2 open parking spaces
- Utilities: Public water; Public sewer; 220 volt electric service; Natural gas available; natural gas connected; Electricity connected; Water connected
- Home design: Single family residence; One level / single-story; Raised foundation
- Construction: Brick construction
- Exterior features: Composition roof; County road frontage; Lot approximately 0.46 acres (125 x 161.5 irregular)
Interior
- Kitchen: Electric cooktop; Refrigerator
- Bedrooms: 1 bedroom on the main level
- Flooring: Carpet; Ceramic tile; Laminate
- Bathrooms: 1 full bathroom on the main level
- Heating & cooling: Central air; Forced air heating (natural gas)
- Interior features: Electric cooktop; Refrigerator; Ceiling fan(s); 6 total rooms
- Laundry & utility: Washer hookup; Electric dryer hookup
Neighborhood map
What this means for you Summary
Snapshot
- This is a 3-bed/1.0-bath single-family listed at $160k.
Deal economics
- At list price, monthly cash flow is $309 ($4k/yr) — positive.
- The deal already cash-flows at list — no discount required.
- Meets the 1% rule at list price ($2k rent vs $160k).
- Recommended offer: $155k (3.0% below list) — sets the bar for market timing.
- Cap rate 8.6% vs local median 3.5% in Jackson — top-decile yield for the area; either an underpriced asset or a hidden risk that comps aren't pricing in. Stress-test before assuming the spread holds.
Location & tenants
- Location reads 62/100 on livability (#216 in TN) — a middle-class / working-renter tenant base. Strengths: cost of living A+, housing A+; Watch: health & safety C-, schools F, crime F.
- Madison County (urban): math 10% / reading 17% proficiency, ranked #131 of 139 in TN (top 94%) — low school quality limits family demand, transient renter base, plan for 1-2y turnover; 68% free/reduced lunch — lower-income household profile, screen leases tightly.
- Market conditions: Rents rising (+1.6%/yr); 508 active listings in the ZIP; 247 units permitted in Madison County in 2024 (0 in 5+ unit buildings).
Forward outlook
- Local home prices are declining (-3.0%/yr); year-one equity from $1k of loan paydown is wiped out by about $5k of value loss. Plan a longer hold.
- Madison County population projected at -12% by 2050 — secular population decline; favor cash flow + early exit over multi-decade hold.
Negotiation context
- It's been on market 46 days — a 3% lower offer ($155k) is reasonable based on typical stale-listing flexibility.
- 2 sale attempts since 3y ago; this cycle's ask has dropped $20k (11%) from the opening price — seller is motivated, your offer sets the floor, not the list.
- Current owner paid $80k; list at $160k implies a 100% gain — meaningful room to come down on a strong offer.
Risks & watch-outs
- Climate carrying-cost: extreme-heat days projected 7→20/yr by 2055 (HVAC capex compounding) — expect insurance premiums to compound above CPI over the hold.
Questions for the listing agent
- It's been on market 46 days. Have you received any prior offers? Is the seller open to a 3% concession, seller financing, or rate buy-down credit?
- Is there a deadline driving the sale (1031 exchange, divorce, estate, relocation)? That informs how much negotiation room exists.
- Schools are F-rated, which usually means shorter tenancies and higher turnover. Who's the typical renter profile here, and what's been the actual vacancy rate?
- Crime grade is F in this area — have there been break-ins, vandalism, or insurance claims at this property in the last 3 years? What carrier currently insures it and at what premium?
- What's the average days-on-market for RENTAL listings here right now (not sales)? A rising rental-DOM trend means longer vacancies and softer asking-rent achievability than the comps imply.
- What's the recent tenant-quality profile in this submarket — average credit score on applications, eviction rate, late-payment / NSF rate, and stable-employment percentage? A property-management company in the area should have these aggregated.
- How much new for-sale + rental construction is in the pipeline within 1–3 miles? Heavy new supply typically softens prices + rents 12–24 months out; constrained supply supports both.
Investment metrics
- 1% rule
- 1.00% ✓
- Cap rate
- 8.61%
- Cash-on-cash
- 8.27%
- DSCR
- 1.37
- GRM
- 8.3
CMA / ARV
- ARV (on-the-fly)
- $216,070
- Comps found
- 12
Show comp detail 12 sales within ~0.75 mi
| Address | Dist | Beds/Ba | Sqft | Sold | Price | $/sf | Match |
|---|---|---|---|---|---|---|---|
| 24 Annondale Cv | 0.13mi | 3/2.0 | 1,408 (+1%) | 9mo | $228,000 | $162 | 81 |
| 71 Ellendale Dr | 0.14mi | 3/2.0 | 1,352 (-3%) | 5mo | $197,000 | $146 | 80 |
| 17 Rugby Cv | 0.23mi | 3/2.0 | 1,386 (-1%) | 6mo | $215,000 | $155 | 79 |
| 55 Annondale Cv | 0.14mi | 3/2.0 | 1,290 (-8%) | 1mo | $239,900 | $186 | 76 |
| 61 Madelyn Cv | 0.22mi | 3/2.0 | 1,409 (+1%) | 10mo | $229,900 | $163 | 75 |
| 2830 Christmasville Rd | 0.14mi | 4/2.0 (+1) | 1,275 (-8%) | 2mo | $140,000 | $110 | 69 |
| 101 Oakdale Dr | 0.15mi | 3/2.0 | 1,496 (+7%) | 12mo | $225,000 | $150 | 67 |
| 86 Ellendale Pl | 0.19mi | 3/2.0 | 1,246 (-11%) | 15mo | $130,000 | $104 | 57 |
| 142 Oakfield Rd | 0.68mi | 2/1.0 (-1) | 1,280 (-8%) | 1mo | $105,000 | $82 | 48 |
| 90 Rampart Dr | 0.56mi | 3/2.0 | 1,471 (+6%) | 14mo | $252,000 | $171 | 48 |
| 138 Wild Valley Dr | 0.45mi | 3/2.0 | 1,199 (-14%) | 7mo | $140,000 | $117 | 45 |
| 6 Hayworth Cv | 0.63mi | 4/2.0 (+1) | 1,506 (+8%) | 12mo | $249,900 | $166 | 38 |
Match score weights: distance 35% · size 25% · config 20% · recency 20%. Top-matched comps best support the ARV.
Projected returns pro-forma
-3.0% appreciation · 1.58% rent growth · sell at horizon
- IRR
- -5.2%
- Equity multiple
- 0.81×
- Total profit
- $-8,580
- Equity at exit
- $23,842
- IRR
- 2.8%
- Equity multiple
- 1.19×
- Total profit
- $8,554
- Equity at exit
- $13,825
Cash invested: $44,772 (down + closing). Projections, not guarantees.
Landlord ↔ Tenant lean methodology
- Overall (STATE)
- 87 Strongly Landlord-Friendly
- State Tennessee
- 87 Strongly Landlord-Friendly · R+13
- County
- — inherits STATE
- City
- — inherits STATE
ZIP-level market 38305
- Rents YoY
- 1.6%
- Active inventory
- 508
- Price-to-rent
- 8.3×
Monthly cashflow live
- Estimated rent
- $1,607 medium interval (Pro) →
- Mortgage (P&I)
- −$839
- Tax from tax record
- −$55 /mo · $665/yr
- Insurance
- −$67
- HOA
- −$0
- Vacancy / Maint / Mgmt
- −$337
- Net cashflow
- $309
Break-even live
UW: 25.0% down · 7.5% · 30yr · 1.5% tax · 5.0% vac · 8.0% maint · 8.0% mgmt
Financing live
Cash to close
- Down payment
- $39,975
- Closing costs
- $4,797
- Reserves months
- —
- Total cash needed
- —
Loan-product check · same deal, 3 products live
Conventional
25% down · 7.5% · 30yr
- Down + closing
- —
- Monthly P&I
- —
- Monthly cashflow
- —
- DSCR
- —
- Eligible?
- —
Personal DTI + credit; lowest rate.
DSCR
20% down · 8.5% · 30yr
- Down + closing
- —
- Monthly P&I
- —
- Monthly cashflow
- —
- DSCR
- —
- Eligible?
- —
No personal income docs; deal must DSCR.
Hard money
10% down · 12.0% · 12mo
- Down + closing
- —
- Monthly P&I
- —
- Monthly cashflow
- —
- DSCR
- —
- Eligible?
- —
Short-term bridge; refi at stabilization.
Listing history 9 events
-
2026-05-11status Pending
-
2026-05-05price $159,900
-
2026-04-08price $169,900
-
2026-03-26$179,900 Active
-
2023-11-10historical $1,195
-
2023-11-03price $1,195
-
2023-10-26price $1,295
-
2023-10-25$1,195
-
2006-02-23soldstatus $79,900
ⓘ Source: listings_history table (triggers on properties + properties_extension) + one-shot
backfill from property_details.listing_events for pre-trigger history.
Tax reassessment forecast TN · Resets to sale price
- Current annual tax
- $665 · $55/mo
- Projected year-2 tax
- $1,135 · $95/mo
- Expected delta
- +$470/yr (+$39/mo · 70.7%)
ⓘ Screening estimate from a state-policy table — verify with the county assessor before closing.
Climate risk First Street
- Flood 1/10 Low FEMA zone X (unshaded) · 0% chance over 30 yrs
- Wildfire 1/10 Low
- Heat 6/10 Major 7 d/yr ≥109°F today · 20 d/yr by 30 yrs out
- Wind 4/10 Moderate 16% chance of damaging wind over 30 yrs
- Air quality 2/10 Low 0 unhealthy d/yr today · 1 by 30 yrs out
Nearby sold comps map
Loading sold comps map…
Walkable amenities ~0.75 mi
Loading nearby amenities…
Taxation est. · year 1
- Rental income
- $19,280
- − Mortgage interest
- −$8,957
- − Property taxes
- −$665
- − Insurance
- −$800
- − Repairs & maintenance
- −$1,542
- − Management
- −$1,542
- − Depreciation
- −$4,652
- Taxable income
- $1,122
- Est. tax owed @ 24.0%
- −$269
- After-tax cash flow
- $3,435/yr
For passive investors: Depreciation is non-cash, so a rental often shows a tax loss while cash-flowing — sheltering income. Rental losses are passive: they offset passive income freely, and up to $25,000/yr can offset ordinary (W-2) income if you actively participate and your MAGI is under $100k (phasing out to $0 by $150k); unused losses carry forward. On sale, claimed depreciation is recaptured at up to 25%, and gains may owe capital-gains tax (a 1031 exchange can defer both). Figures are a year-1 estimate at your 24.0% rate — not tax advice; consult a CPA.
Schools (NCES district)
- District
- Madison County
- NCES district ID
- 4702580
- Math proficiency
- 10% ▼ -11.00%
- Reading proficiency
- 17% ▼ -4.00%
- Median HH income
- $42,015
- Composite
- 11.74/100
- National rank
- #9687
- State rank
- #131 of 139 in TN
Livability — Jackson
- Score
- 62/100
- State rank
- #216
- US rank
- #16488
Category grades
Schools grade is shown separately in the Schools card above.
Census & demographics
- County
- Madison County · 87,024 people
- City population
- 87,024
- Metro
- Jackson, TN
- Population (ZIP)
- 53,488
- Household income
- $68,977
- Rent vs Own
- Severe rent burden
- 2228.0
Population outlook (Madison County) Hauer SSP2
- Today (2025)
- 95,952 people
- By 2030
- 94,264 · -1.8%
- By 2040
- 89,607 · -6.6%
- By 2050
- 84,133 · -12.3%
- By 2075
- 72,215 · -24.7%
- By 2100
- 62,062 · -35.3%
Race, ethnicity, and origin ACS 2023
- Neighborhood character
- Diverse neighborhood (Simpson 0.57)
- Race & ethnicity
- White 57% Black 32% Hispanic / Latino 5% Two or more races 5% Asian 2%
- Hispanic origin (detail)
- Mexican 4%
- Common ancestry
- Serbian 2% Italian 2% Slovak 2%
- Foreign-born
- 4% · Canada
- Languages at home
- 94% English-only · Spanish 4% Other Indo-European 1% Arabic 1%
Political lean MEDSL · Madison
- 2024 margin
- R (+18.2) · D 40.3% · R 58.5% · Other 1.2%
- 2008→2024 swing
- +3.4pp toward D · 2008: -21.6pp · 2024: -18.2pp
- All cycles
- 2024: R+18.2 2020: R+12.9 2016: R+15.6 2012: R+8.9 2008: R+21.6
Not yet ingested
- Civics
- —
Market trends
- HPI YoY
- ▼ -118.63%
- Current HPI
- 195.4511
- Rent YoY
- ▲ 1.58%
- Metro
- Jackson, TN
- State GDP YoY
- ▲ 2.78%
- F500 in state
- 22
Industry mix (Fortune 500 HQ in TN)
| Industry | F500 HQs | Revenue |
|---|---|---|
| Healthcare | 3 | $91B |
|
||
| Retail | 3 | $72B |
|
||
| Transportation / Logistics | 1 | $88B |
|
||
| Paper / Packaging | 1 | $19B |
|
||
| Insurance | 1 | $13B |
|
||
| Energy | 1 | $12B |
|
||
Price history
+100.1% since first listed9 events — show timeline
- 2026-05-11 Pending — CWTAR
- 2026-05-05 Price Changed $159,900 CWTAR
- 2026-04-08 Price Changed $169,900 CWTAR
- 2026-03-26 Listed $179,900 CWTAR
- 2023-11-10 Rental Removed $1,195 RENTLY
- 2023-11-03 Price Changed $1,195 RENTLY
- 2023-10-26 Price Changed $1,295 RENTLY
- 2023-10-25 Listed for Rent $1,195 RENTLY
- 2006-02-23 Sold (Public Records) $79,900 Public Records
Property tax history
+3.3%/yrLatest (2025): $665 · +0.0% YoY. Source: county tax records.
Cash-flow waterfall
monthlySold comps — $/sqft
last 12 mo · ≤1 miLoading sold comps…