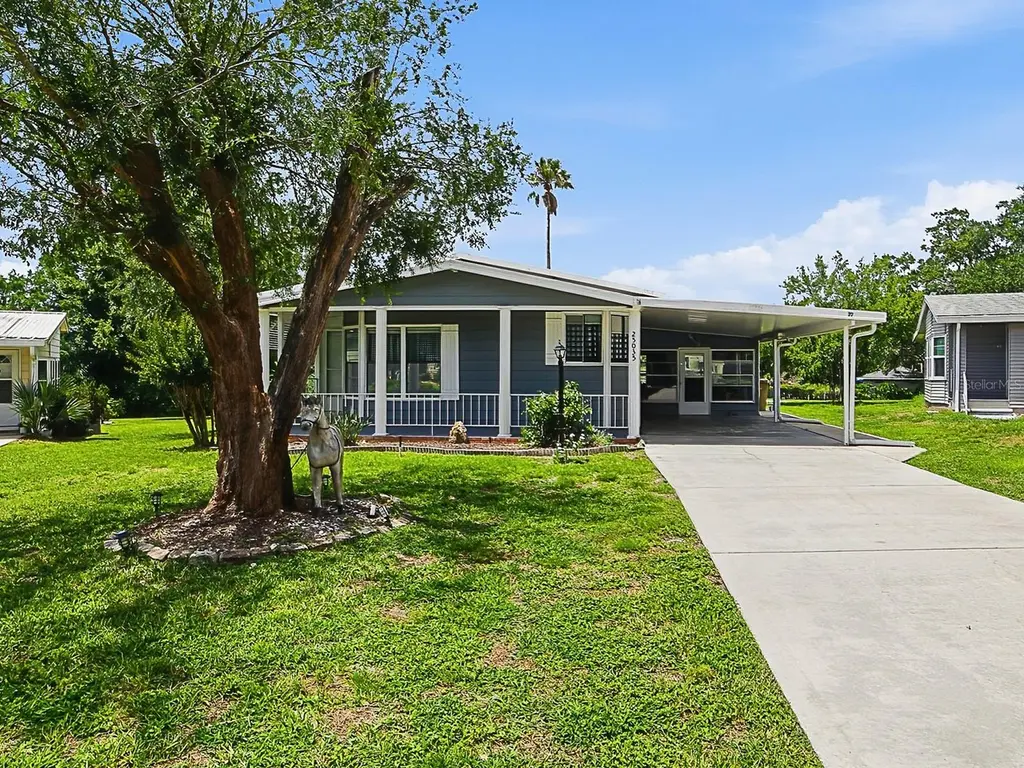
25035 Bellevue · Leesburg, FL
Flood risk 1/10 · Minimal
- FEMA flood zone
- X (unshaded)
- Chance of flooding over 30 yrs
- 0.0%
- Est. flood insurance / yr
- $507 – $1,088
Fire risk 3/10 · Minor
- Est. fire insurance / yr
- $947 – $1,759
Heat risk 8/10 · Major
- Hot days now (above 108°F)
- 6 days/yr
- Hot days in 30 yrs
- 18 days/yr
Wind risk 9/10 · Severe
- Chance of severe wind over 30 yrs
- 99.0%
Air-quality risk 2/10 · Minimal
- Unhealthy air days now
- 1 days/yr
- Unhealthy air days in 30 yrs
- 2 days/yr
Risk factors via First Street. Map © Google.
Why this score? — see what drove the D grade
The composite is a weighted blend of 9 inputs, each scored 0–100. Each bar is that input's sub-score; the figure is the points it added to the 100-point composite (weight × sub-score).
- Cash flow +19.2/30.0
- 1% rule +6.4/10.0
- DSCR +6.0/10.0
- Schools +4.2/10.0
- Livability +3.1/5.0
- Condition / age +2.5/5.0
- Rent growth +2.3/5.0
- ARV discount +0.0/15.0
- Appreciation +0.0/10.0
$179,000
🖨 Deal sheet (PDF) 📄 Offer letter ✓ Due diligence
Listing remarks
Welcome to this spacious 1,376-square-foot home featuring two beautiful Florida rooms! This well-maintained 2-bedroom, 2-bath home is ready for its next owner. The bright, open kitchen flows seamlessly into the combined living and dining area, creating a welcoming space for entertaining and everyday living. The primary suite offers a private bath with a relaxing soaking tub, separate walk-in shower, and ample space for comfort. A guest bedroom and additional full bathroom provide convenience for family and visitors. Relax year-round in the inviting front Florida room or enjoy the expansive 21' x 27' glass-enclosed rear Florida room, perfect for gatherings, hobbies, or simply taking in the F
Key facts
- Private bath
- Soaking tub
- Florida rooms
Tags
Property features AI
Finance
- Other: Partially furnished; Senior community
- Financial info: Total annual fees reported: $2,160; Lease restrictions apply
- HOA & community: HOA with monthly fee of $180; Association approval required; Association fee includes 24-hour guard, common area taxes, pool, escrow reserves, management, private road, recreational facilities, and security; Community amenities: clubhouse, fitness center, pool, tennis courts, pickleball and shuffleboard courts, basketball court, spa/hot tub, sauna, trails, storage, recreation facilities, gated entry, maintenance, vehicle restrictions, wheelchair access, deed restrictions, community mailbox, sidewalks, golf and golf course access, special community restrictions, buyer approval required, golf carts allowed, pets allowed (with limits)
Exterior
- Parking: Driveway; Off-street parking; 2-space carport
- Security: Gated community; Smoke detectors
- Utilities: Public water; Public sewer; Public utilities
- Home design: Manufactured home (double wide); One story; Faces east; Located in a PUD
- Construction: Metal frame construction; Metal roof; Crawlspace foundation; Built area reported (public records)
- Exterior features: Enclosed patio/porch; Front porch; Rear porch; Screened porch; Rain gutters; Storage; Irrigation equipment; Mature landscaping; Paved lot
Interior
- Kitchen: Built-in oven; Cooktop; Dishwasher; Refrigerator; Electric water heater
- Bedrooms: 2 bedrooms
- Flooring: Carpet; Laminate
- Bathrooms: 2 full bathrooms
- Heating & cooling: Electric heating; Central air conditioning; Electric fireplace
- Interior features: Eat-in kitchen; High ceilings; Open floor plan; Florida room; Great room; Inside utility
- Laundry & utility: Washer; Dryer; Electric dryer hookup; Laundry room inside
Neighborhood map
What this means for you Summary
Snapshot
- This is a 2-bed/2.0-bath manufactured listed at $179k.
Deal economics
- At list price, monthly cash flow is $192 ($2k/yr) — positive.
- The deal already cash-flows at list — no discount required.
- Meets the 1% rule at list price ($2k rent vs $179k).
- Recommended offer: $176k (1.5% below list) — sets the bar for market timing.
- Cap rate 7.6% vs local median 4.4% in Leesburg — top-decile yield for the area; either an underpriced asset or a hidden risk that comps aren't pricing in. Stress-test before assuming the spread holds.
Location & tenants
- Location reads 62/100 on livability (#751 in FL) — a middle-class / working-renter tenant base. Strengths: cost of living A+, housing A+; Watch: schools D+, crime D, amenities F.
- Lake (suburban): math 49% / reading 50% proficiency, ranked #37 of 73 in FL (top 51%) — families likely to look elsewhere, expect single-tenant / working-renter base with shorter leases.
- Market conditions: Rents soft (-0.9%/yr); 797 active listings in the ZIP; 6 comparable units currently listed for rent nearby; rentals at typical pace (median 25d on market — plan ~3-4 weeks tenant-placement turnaround); 4,799 units permitted in Lake County in 2024 (814 in 5+ unit buildings).
- This rent runs 42% of the median local income ($58k/yr) — at the standard rent-burdened threshold; future hikes will face affordability resistance.
Forward outlook
- Local home prices are declining (-3.0%/yr); year-one equity from $1k of loan paydown is wiped out by about $5k of value loss. Plan a longer hold.
- Lake County population projected at +37% by 2050 — long-run rental-demand tailwind backs the buy-and-hold thesis.
Negotiation context
- It's been on market 20 days — a 2% lower offer ($176k) is reasonable based on typical stale-listing flexibility.
- Current owner paid $146k; 23% above their basis — modest negotiation headroom, anchor on the comps not their cost.
Risks & watch-outs
- Climate carrying-cost: severe wind risk, 99% chance of damaging wind over 30y; extreme-heat days projected 6→18/yr by 2055 (HVAC capex compounding) — expect insurance premiums to compound above CPI over the hold.
Questions for the listing agent
- What does the HOA fee cover, when was the last increase, and are there any pending special assessments or reserve-fund shortfalls?
- Is there a deadline driving the sale (1031 exchange, divorce, estate, relocation)? That informs how much negotiation room exists.
- Schools are D-rated, which usually means shorter tenancies and higher turnover. Who's the typical renter profile here, and what's been the actual vacancy rate?
- Crime grade is D in this area — have there been break-ins, vandalism, or insurance claims at this property in the last 3 years? What carrier currently insures it and at what premium?
- The area grade is low — what's the realistic commute time and amenity access for the typical tenant pool here? Any planned neighborhood developments (good or bad) we should know about?
- What's the average days-on-market for RENTAL listings here right now (not sales)? A rising rental-DOM trend means longer vacancies and softer asking-rent achievability than the comps imply.
- What's the recent tenant-quality profile in this submarket — average credit score on applications, eviction rate, late-payment / NSF rate, and stable-employment percentage? A property-management company in the area should have these aggregated.
- How much new for-sale + rental construction is in the pipeline within 1–3 miles? Heavy new supply typically softens prices + rents 12–24 months out; constrained supply supports both.
Investment metrics
- 1% rule
- 1.14% ✓
- Cap rate
- 7.58%
- Cash-on-cash
- 4.59%
- DSCR
- 1.20
- GRM
- 7.3
CMA / ARV
- ARV (on-the-fly)
- $127,968
- Comps found
- 1
Show comp detail 1 sale within ~0.75 mi
| Address | Dist | Beds/Ba | Sqft | Sold | Price | $/sf | Match |
|---|---|---|---|---|---|---|---|
| 25101 Barrow Hl | 0.13mi | 2/2.0 | 1,446 (+5%) | 10mo | $135,000 | $93 | 77 |
Match score weights: distance 35% · size 25% · config 20% · recency 20%. Top-matched comps best support the ARV.
Projected returns pro-forma
-3.0% appreciation · 0.0% rent growth · sell at horizon
- IRR
- -13.0%
- Equity multiple
- 0.55×
- Total profit
- $-22,648
- Equity at exit
- $26,689
- IRR
- -10.3%
- Equity multiple
- 0.47×
- Total profit
- $-26,598
- Equity at exit
- $15,477
Cash invested: $50,120 (down + closing). Projections, not guarantees.
Landlord ↔ Tenant lean methodology
- Overall (STATE)
- 87 Strongly Landlord-Friendly
- State Florida
- 87 Strongly Landlord-Friendly · R+3
- County
- — inherits STATE
- City
- — inherits STATE
ZIP-level market 34748
- Home prices YoY
- -25.3%
- Rents YoY
- -0.9%
- Active inventory
- 797
- Price-to-rent
- 7.3×
Monthly cashflow live
- Estimated rent
- $2,049 high interval (Pro) →
- Mortgage (P&I)
- −$939
- Tax from tax record
- −$234 /mo · $2,803/yr
- Insurance
- −$75
- HOA
- −$180
- Vacancy / Maint / Mgmt
- −$430
- Net cashflow
- $192
Break-even live
Sensitivity live
| Price | -10% $293 | -5% $242 | +0% $192 | +5% $141 | +10% $90 |
|---|---|---|---|---|---|
| Rent | -10% $30 | -5% $111 | +0% $192 | +5% $273 | +10% $354 |
| Rate | -1.0pp $282 | -0.5pp $237 | base $192 | +0.5pp $145 | +1.0pp $98 |
UW: 25.0% down · 7.5% · 30yr · 1.5% tax · 5.0% vac · 8.0% maint · 8.0% mgmt
Financing live
Cash to close
- Down payment
- $44,750
- Closing costs
- $5,370
- Reserves months
- —
- Total cash needed
- —
Loan-product check · same deal, 3 products live
Conventional
25% down · 7.5% · 30yr
- Down + closing
- —
- Monthly P&I
- —
- Monthly cashflow
- —
- DSCR
- —
- Eligible?
- —
Personal DTI + credit; lowest rate.
DSCR
20% down · 8.5% · 30yr
- Down + closing
- —
- Monthly P&I
- —
- Monthly cashflow
- —
- DSCR
- —
- Eligible?
- —
No personal income docs; deal must DSCR.
Hard money
10% down · 12.0% · 12mo
- Down + closing
- —
- Monthly P&I
- —
- Monthly cashflow
- —
- DSCR
- —
- Eligible?
- —
Short-term bridge; refi at stabilization.
Rent comps 6 comps
| Address | Beds | Baths | Sqft | Rent | $/sqft | DOM | Units | Dist |
|---|---|---|---|---|---|---|---|---|
| 5009 El Destino Dr Leesburg, FL | 2.0 | 2.0 | 1428 | $2,450 | $1.72 | 25d | 1 | 0.25mi |
| 25049 Navel Ave Leesburg, FL | 2.0 | 2.0 | 1430 | $2,800 | $1.96 | 25d | 1 | 0.43mi |
| 25533 Belle Helene Leesburg, FL | 2.0 | 2.0 | 1352 | $1,650 | $1.22 | 6d | 1 | 0.67mi |
| 4728 Belle Grv Leesburg, FL | 2.0 | 2.0 | 1480 | $1,700 | $1.15 | 25d | 1 | 0.70mi |
| 10140 Huntingnet Way Leesburg, FL | 3.0 | 2.0 | 1589 | $2,250 | $1.42 | 25d | 1 | 1.08mi |
| 4501 River Ridge Dr Leesburg, FL | 2.0 | 2.0 | 1467 | $1,725 | $1.18 | 6d | 1 | 1.14mi |
HOA detail
- Monthly dues
- $180 · $2,160/yr
Listing history 13 events
-
2026-06-21days on market $179,000 Active 20 DOM
-
2026-06-18days on market $179,000 Active 17 DOM
-
2026-06-17days on market $179,000 Active 16 DOM
-
2026-06-16days on market $179,000 Active 15 DOM
-
2026-06-15days on market $179,000 Active 14 DOM
-
2026-06-13days on market $179,000 Active 12 DOM
-
2026-06-09days on market $179,000 Active 8 DOM
-
2026-06-08days on market $179,000 Active 7 DOM
-
2026-06-07days on market $179,000 Active 6 DOM
-
2026-06-04days on market $179,000 Active 3 DOM
-
2026-06-03days on market $179,000 Active 2 DOM
-
2026-06-02remarks 699-char remark
-
2026-06-02$179,000 Active 1 DOM
ⓘ Source: listings_history table (triggers on properties + properties_extension) + one-shot
backfill from property_details.listing_events for pre-trigger history.
Tax reassessment forecast FL · Resets to sale price
- Current annual tax
- $2,803 · $234/mo
- Projected year-2 tax
- $2,803 · $234/mo
- Expected delta
- $0/yr ($0/mo · 0.0%)
ⓘ Screening estimate from a state-policy table — verify with the county assessor before closing.
Climate risk First Street
- Flood 1/10 Low FEMA zone X (unshaded) · 0% chance over 30 yrs
- Wildfire 3/10 Moderate
- Heat 8/10 Severe 6 d/yr ≥108°F today · 18 d/yr by 30 yrs out
- Wind 9/10 Extreme 99% chance of damaging wind over 30 yrs
- Air quality 2/10 Low 1 unhealthy d/yr today · 2 by 30 yrs out
Nearby sold comps map
Loading sold comps map…
Walkable amenities ~0.75 mi
Loading nearby amenities…
Taxation est. · year 1
- Rental income
- $24,587
- − Mortgage interest
- −$10,027
- − Property taxes
- −$2,803
- − Insurance
- −$895
- − Repairs & maintenance
- −$1,967
- − Management
- −$1,967
- − HOA
- −$2,160
- − Depreciation
- −$5,207
- Taxable loss
- −$439
- Est. tax savings @ 24.0%
- +$105
- After-tax cash flow
- $2,407/yr
For passive investors: Depreciation is non-cash, so a rental often shows a tax loss while cash-flowing — sheltering income. Rental losses are passive: they offset passive income freely, and up to $25,000/yr can offset ordinary (W-2) income if you actively participate and your MAGI is under $100k (phasing out to $0 by $150k); unused losses carry forward. On sale, claimed depreciation is recaptured at up to 25%, and gains may owe capital-gains tax (a 1031 exchange can defer both). Figures are a year-1 estimate at your 24.0% rate — not tax advice; consult a CPA.
Schools (NCES district)
- District
- Lake
- NCES district ID
- 1201050
- Math proficiency
- 49% ▼ -7.00%
- Reading proficiency
- 50% ▼ -4.00%
- Median HH income
- $46,632
- Composite
- 42.05/100
- National rank
- #3327
- State rank
- #37 of 73 in FL
Livability — Leesburg
- Score
- 62/100
- State rank
- #751
- US rank
- #16429
Category grades
Schools grade is shown separately in the Schools card above.
Census & demographics
- County
- Lake County · 364,602 people
- City population
- 70,232
- Metro
- Orlando-Kissimmee-Sanford, FL
- Population (ZIP)
- 48,095
- Household income
- $58,192
- Rent vs Own
- Severe rent burden
- 1745.0
Population outlook (Lake County) Hauer SSP2
- Today (2025)
- 386,640 people
- By 2030
- 417,107 · +7.9%
- By 2040
- 476,676 · +23.3%
- By 2050
- 531,296 · +37.4%
- By 2075
- 648,303 · +67.7%
- By 2100
- 698,530 · +80.7%
Race, ethnicity, and origin ACS 2023
- Neighborhood character
- Majority White (64%)
- Race & ethnicity
- White 64% Black 16% Hispanic / Latino 15% Two or more races 9% Asian 1%
- Hispanic origin (detail)
- Mexican 4% Puerto Rican 5% Cuban 3%
- Common ancestry
- Romanian 3% Lithuanian 3% Slovak 2%
- Foreign-born
- 9% · Canada, Vietnam, Jamaica
- Languages at home
- 88% English-only · Spanish 10% French/Haitian/Cajun 1%
Political lean MEDSL · Lake
- 2024 margin
- Strong R (+24.7) · D 37.3% · R 62.0%
- 2008→2024 swing
- -11.2pp toward R · 2008: -13.5pp · 2024: -24.7pp
- All cycles
- 2024: R+24.7 2020: R+20.0 2016: R+23.1 2012: R+17.1 2008: R+13.5
Not yet ingested
- Civics
- —
Market trends
- HPI YoY
- ▼ -88.97%
- Current HPI
- 262.1766
- Rent YoY
- ▼ -0.95%
- Metro
- Orlando-Kissimmee-Sanford, FL
- State GDP YoY
- ▲ 3.28%
- F500 in state
- 36
Industry mix (Fortune 500 HQ in FL)
| Industry | F500 HQs | Revenue |
|---|---|---|
| Industrial Technology | 2 | $29B |
|
||
| Insurance | 2 | $17B |
|
||
| Retail | 1 | $60B |
|
||
| Technology Distribution | 1 | $58B |
|
||
| Homebuilding | 1 | $35B |
|
||
| Technology Manufacturing | 1 | $35B |
|
||
Price history
+86.5% since first listed6 events — show timeline
- 2026-06-01 Listed $179,000 Stellar MLS as Distributed by MLS Grid
- 2006-03-29 Sold (Public Records) $146,000 Public Records
- 2003-12-11 Sold (Public Records) $79,900 Public Records
- 1996-09-12 Sold (Public Records) $80,000 Public Records
- 1995-10-24 Sold (Public Records) $72,400 Public Records
- 1989-12-01 Sold (Public Records) $96,000 Public Records
Property tax history
+18.4%/yrLatest (2025): $2,803 · +4.9% YoY. Source: county tax records.
Cash-flow waterfall
monthlySold comps — $/sqft
last 12 mo · ≤1 miLoading sold comps…