5775 Koweta Rd · South Fulton, GA
Flood risk 1/10 · Minimal
- FEMA flood zone
- X (unshaded)
- Chance of flooding over 30 yrs
- 0.0%
- Est. flood insurance / yr
- $473 – $860
Fire risk 3/10 · Minor
- Est. fire insurance / yr
- $963 – $1,789
Heat risk 5/10 · Moderate
- Hot days now (above 103°F)
- 7 days/yr
- Hot days in 30 yrs
- 18 days/yr
Wind risk 5/10 · Moderate
- Chance of severe wind over 30 yrs
- 25.0%
Air-quality risk 3/10 · Minor
- Unhealthy air days now
- 3 days/yr
- Unhealthy air days in 30 yrs
- 4 days/yr
Risk factors via First Street. Map © Google.
Why this score? — see what drove the A- grade
The composite is a weighted blend of 9 inputs, each scored 0–100. Each bar is that input's sub-score; the figure is the points it added to the 100-point composite (weight × sub-score).
- Cash flow +28.0/30.0
- ARV discount +15.0/15.0
- Appreciation +10.0/10.0
- DSCR +9.9/10.0
- 1% rule +8.1/10.0
- Schools +4.5/10.0
- Rent growth +2.7/5.0
- Livability +2.5/5.0
- Condition / age +2.5/5.0
$165,000
🖨 Deal sheet 📄 Offer letter ✓ Due diligence
Listing remarks MLS
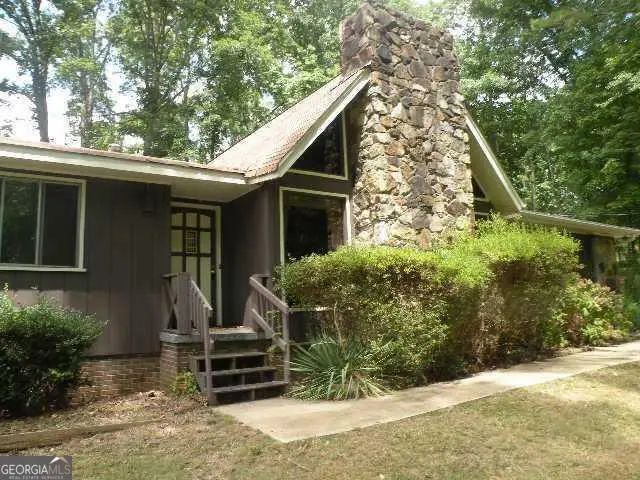
Investor Special on 1.01 Acres with Full Basement in Prime South Fulton Location! Unlock the potential and exceptional opportunity for savvy investors, builders, or buyers looking to create value. Sitting on 1.01 acres of land, this property offers space, flexibility, and strong upside for renovation, rental income, or resale. Featuring a full basement, the property provides additional square footage and endless possibilities-perfect for expanding living space, creating a separate unit, or maximizing after-repair value. With the right vision, this property can be transformed into a profitable asset. Ideal for cash buyers or those seeking a project with long-term equity growth. Conveniently located near major highways, Hartsfield-Jackson Atlanta International Airport, and the rapidly expanding South Fulton area. Sold as-is. No disclosures. Bring your highest and best offer-serious inquiries only. ESTATE SALE, PROBATE COMPLETE. Opportunities like this don't last-schedule your showing today!
Key facts
- Minutes from airport
- Shopping
- 1.01-acre property
Tags
Property features AI
Exterior
- Parking: Attached parking; Driveway parking; Open parking available
- Utilities: Public water; Septic tank sewer; 220 volt electrical service; Electricity available; Natural gas available
- Home design: Two levels; Brick on all four sides; Resale property; Combination foundation
- Construction: Composition roof
- Exterior features: Covered patio/porch; Back yard fencing; Shed(s) on property; Daylight basement
Interior
- Kitchen: Breakfast room; Dishwasher
- Bedrooms: Three main-level bedrooms; At least one accessible bedroom
- Flooring: Carpet; Concrete; Hardwood; Laminate
- Bathrooms: Two full bathrooms; One half bathroom; Master bath with tub only
- Heating & cooling: Central heating; Baseboard heating; Central air conditioning
- Interior features: Brick fireplace with a brick surround; Wood-framed windows; Other interior details
- Laundry & utility: Laundry located in the kitchen
Neighborhood map
What this means for you Summary
Snapshot
- This is a 3-bed/2.0-bath single-family listed at $165k.
Deal economics
- At list price, monthly cash flow is $511 ($6k/yr) — positive.
- The deal already cash-flows at list — no discount required.
- Meets the 1% rule at list price ($2k rent vs $165k).
- Recommended offer: $163k (1.5% below list) — sets the bar for market timing.
Location & tenants
- Location reads: area grade A — affects rentability + tenant quality, not the cash-flow math above.
- Fulton County (suburban): math 49% / reading 53% proficiency, ranked #12 of 174 in GA (top 7%) — acceptable for families but not a draw, mixed tenant base, ~2y average lease.
- Zoned schools: Campbell Elementary School (math 27% / reading 22%, grade F, #753 of 1,228 statewide, top 64%, 568 students, 100% FRL); Creekside High School (math 30% / reading 24%, grade F, #160 of 424 statewide, top 38%, 1,768 students, 100% FRL) — zoned schools average 100% FRL vs 41% district-wide (59 pts higher); higher-poverty schools than district average — tighter screening recommended.
- Zoned-school proficiency averages 26% at this address vs 51% district-wide (-25 pts) — the specific schools serving this property underperform the Fulton County average; the district grade overstates school quality for this exact location.
- Market conditions: Rents flat; 651 active listings in the ZIP; 34 comparable units currently listed for rent nearby; rentals at typical pace (median 24d on market — plan ~3-4 weeks tenant-placement turnaround); 11,565 units permitted in Fulton County in 2024 (8,159 in 5+ unit buildings).
Forward outlook
- In year one you build about $18k of equity ($1k loan paydown + $16k appreciation (10.0% local appreciation)).
- Fulton County population projected at +38% by 2050 — long-run rental-demand tailwind backs the buy-and-hold thesis.
- At projected returns (10.0% appreciation + 0.9% rent growth), your $46k cash investment doubles in ~2 years — after that, you're playing with house money.
- By year 3, paydown + projected appreciation supports a ~$45k cash-out refi (75% LTV) — recoverable capital for the next deal without selling this one.
Negotiation context
- It's been on market 25 days — a 2% lower offer ($163k) is reasonable based on typical stale-listing flexibility.
- 4 sale attempts since 17y ago with the ask held roughly flat each time — persistent listings suggest the price (not the market) is what's stuck; bring a comps-based counter.
- Current owner paid $47k; list at $165k implies a 251% gain — meaningful room to come down on a strong offer.
Risks & watch-outs
- Climate carrying-cost: moderate wind risk, 25% chance of damaging wind over 30y; extreme-heat days projected 7→18/yr by 2055 (HVAC capex compounding) — expect insurance premiums to compound above CPI over the hold.
Questions for the listing agent
- Is there a deadline driving the sale (1031 exchange, divorce, estate, relocation)? That informs how much negotiation room exists.
- What's the average days-on-market for RENTAL listings here right now (not sales)? A rising rental-DOM trend means longer vacancies and softer asking-rent achievability than the comps imply.
- What's the recent tenant-quality profile in this submarket — average credit score on applications, eviction rate, late-payment / NSF rate, and stable-employment percentage? A property-management company in the area should have these aggregated.
- How much new for-sale + rental construction is in the pipeline within 1–3 miles? Heavy new supply typically softens prices + rents 12–24 months out; constrained supply supports both.
Investment metrics
- 1% rule
- 1.31% ✓
- Cap rate
- 10.01%
- Cash-on-cash
- 13.28%
- DSCR
- 1.59
- GRM
- 6.4
CMA / ARV
- ARV (on-the-fly)
- $277,648
- Comps found
- 11
Show comp detail 11 sales within ~0.75 mi
| Address | Dist | Beds/Ba | Sqft | Sold | Price | $/sf | Match |
|---|---|---|---|---|---|---|---|
| 5835 Raventree Ct | 0.13mi | 4/2.5 (+1) | 2,002 (+7%) | 0mo | $296,900 | $148 | 75 |
| 5945 Raventree Ct | 0.19mi | 4/2.0 (+1) | 1,724 (-8%) | 2mo | $265,000 | $154 | 71 |
| 4108 Robin Cir | 0.41mi | 3/2.5 | 1,786 (-5%) | 3mo | $240,000 | $134 | 68 |
| 4405 Roche St | 0.46mi | 3/2.5 | 1,936 (+3%) | 4mo | $245,000 | $127 | 68 |
| 5985 Raventree Ct | 0.24mi | 3/2.5 | 1,830 (-2%) | 22mo | $279,000 | $152 | 65 |
| 4510 Swan Trce | 0.47mi | 3/2.5 | 1,744 (-7%) | 4mo | $200,000 | $115 | 61 |
| 135 Jennah Gln | 0.33mi | 4/2.5 (+1) | 2,110 (+12%) | 2mo | $305,000 | $145 | 55 |
| 4205 Reeshemah St | 0.50mi | 4/3.0 (+1) | 1,881 (+0%) | 18mo | $290,000 | $154 | 52 |
| 5715 Graywind Trl | 0.24mi | 4/2.5 (+1) | 2,116 (+13%) | 12mo | $325,000 | $154 | 50 |
| 4410 Roche St | 0.50mi | 3/3.5 | 1,680 (-10%) | 6mo | $235,000 | $140 | 48 |
| 4040 Robin Cir | 0.62mi | 3/2.5 | 1,644 (-12%) | 21mo | $244,000 | $148 | 31 |
Match score weights: distance 35% · size 25% · config 20% · recency 20%. Top-matched comps best support the ARV.
Projected returns pro-forma
10.0% appreciation · 0.95% rent growth · sell at horizon
- IRR
- 33.1%
- Equity multiple
- 3.56×
- Total profit
- $118,121
- Equity at exit
- $148,645
- IRR
- 27.9%
- Equity multiple
- 7.80×
- Total profit
- $314,253
- Equity at exit
- $320,559
Cash invested: $46,200 (down + closing). Projections, not guarantees.
Landlord ↔ Tenant lean methodology
- Overall (STATE)
- 90 Strongly Landlord-Friendly
- State Georgia
- 90 Strongly Landlord-Friendly · R+3
- County
- — inherits STATE
- City
- — inherits STATE
ZIP-level market 30349
- Home prices YoY
- 4.6%
- Rents YoY
- 0.9%
- Active inventory
- 651
- Price-to-rent
- 6.4×
Monthly cashflow live
- Estimated rent
- $2,156 high interval (Pro) →
- Mortgage (P&I)
- −$865
- Tax from tax record
- −$258 /mo · $3,100/yr
- Insurance
- −$69
- HOA
- −$0
- Vacancy / Maint / Mgmt
- −$453
- Net cashflow
- $511
Break-even live
UW: 25.0% down · 7.5% · 30yr · 1.5% tax · 5.0% vac · 8.0% maint · 8.0% mgmt
Financing live
Cash to close
- Down payment
- $41,250
- Closing costs
- $4,950
- Reserves months
- —
- Total cash needed
- —
Loan-product check · same deal, 3 products live
Conventional
25% down · 7.5% · 30yr
- Down + closing
- —
- Monthly P&I
- —
- Monthly cashflow
- —
- DSCR
- —
- Eligible?
- —
Personal DTI + credit; lowest rate.
DSCR
20% down · 8.5% · 30yr
- Down + closing
- —
- Monthly P&I
- —
- Monthly cashflow
- —
- DSCR
- —
- Eligible?
- —
No personal income docs; deal must DSCR.
Hard money
10% down · 12.0% · 12mo
- Down + closing
- —
- Monthly P&I
- —
- Monthly cashflow
- —
- DSCR
- —
- Eligible?
- —
Short-term bridge; refi at stabilization.
Rent comps 34 comps
| Address | Beds | Baths | Sqft | Rent | $/sqft | DOM | Units | Dist |
|---|---|---|---|---|---|---|---|---|
| 4407 Sparrow Cir Atlanta, GA | 3.0–5.0 | 2.5–3.0 | 2055 | $2,335 | $1.14 | 1d | 10 | 0.33mi |
| 4108 Robin Cir Atlanta, GA | 3.0 | 2.5 | 1786 | $2,400 | $1.34 | 43d | 1 | 0.38mi |
| 4095 Robin Cir Atlanta, GA | 3.0 | 2.5 | 2196 | $2,023 | $0.92 | 43d | 1 | 0.42mi |
| 4407 Roche St Atlanta, GA | 3.0 | 2.0 | 1650 | $1,875 | $1.14 | 43d | 1 | 0.45mi |
| 4420 Roche St Atlanta, GA | 3.0 | 2.5 | 1622 | $2,130 | $1.31 | 43d | 1 | 0.52mi |
| 4223 Reeshemah St Atlanta, GA | 3.0 | 2.5 | 1843 | $1,995 | $1.08 | 5d | 1 | 0.54mi |
| 4064 Robin Cir Atlanta, GA | 3.0 | 2.5 | 1874 | $1,895 | $1.01 | 24d | 1 | 0.57mi |
| 4062 Robin Cir Atlanta, GA | 3.0 | 3.0 | 1874 | $1,910 | $1.02 | 24d | 1 | 0.58mi |
| 4122 Ravenwood Ct Union City, GA | 3.0 | 3.0 | 1394 | $1,849 | $1.33 | 24d | 1 | 0.84mi |
| 4509 Ravenwood Pl Union City, GA | 3.0 | 2.5 | 1394 | $1,970 | $1.41 | 12d | 1 | 0.86mi |
| 4037 Ravenwood Ct Union City, GA | 2.0 | 2.5 | 1394 | $1,595 | $1.14 | 1d | 1 | 0.86mi |
| 4037 Ravenwood Ct Union City, GA | 2.0 | 2.5 | 1394 | $1,625 | $1.17 | 43d | 1 | 0.86mi |
| 4037 Ravenwood Ct Union City, GA | 2.0 | 2.5 | 1394 | $1,595 | $1.14 | 24d | 1 | 0.86mi |
| 4037 Ravenwood Ct Union City, GA | 2.0 | 2.5 | 1394 | $1,595 | $1.14 | 15d | 1 | 0.86mi |
| 4660 Derrick Rd Atlanta, GA | 1.0–3.0 | 1.0–2.0 | 1029 | $2,724 | $2.65 | 1d | 32 | 1.10mi |
| 12076 Crosswicks Rd Union City, GA | 3.0–4.0 | 2.0–2.5 | 1617 | $2,731 | $1.69 | 1d | 6 | 1.15mi |
| 12006 Crosswicks Rd Union City, GA | 3.0 | 2.0 | 1413 | $2,545 | $1.80 | 15d | 1 | 1.15mi |
| 12006 Crosswicks Rd Union City, GA | 4.0 | 3.0 | 1821 | $3,468 | $1.90 | 44d | 1 | 1.15mi |
| 12006 Crosswicks Rd Unit 105 Union City, GA | 3.0 | 2.5 | 1413 | $2,455 | $1.74 | 43d | 1 | 1.15mi |
| 4666 Ravenwood Loop Union City, GA | 4.0 | 3.0 | 1916 | $2,175 | $1.14 | 24d | 1 | 1.16mi |
| 12006 Crosswicks Rd Unit Sunshine Union City, GA | 4.0 | 2.5 | 1821 | $2,770 | $1.52 | 3d | 1 | 1.19mi |
| 4681 Ravenwood Loop Union City, GA | 4.0 | 2.5 | 1593 | $1,999 | $1.25 | 43d | 1 | 1.21mi |
| 3228 Diamond Blf Union City, GA | 4.0 | 2.5 | 1922 | $2,195 | $1.14 | 43d | 1 | 1.24mi |
| 1008 Eldon Ln Fairburn, GA | 4.0 | 3.0 | 2402 | $2,539 | $1.06 | 11d | 1 | 1.24mi |
| 3416 Stonewall Ct Atlanta, GA | 3.0 | 2.5 | 1690 | $2,450 | $1.45 | 24d | 1 | 1.25mi |
| 3234 Diamond Blf Union City, GA | 4.0 | 2.5 | 1922 | $2,360 | $1.23 | 5d | 1 | 1.25mi |
| 1013 Eldon Ln Fairburn, GA | 4.0 | 2.5 | 2440 | $2,379 | $0.97 | 16d | 1 | 1.26mi |
| 4497 Ravenwood Dr Union City, GA | 3.0 | 2.5 | 1694 | $2,000 | $1.18 | 20d | 1 | 1.30mi |
| 4497 Ravenwood Dr Union City, GA | 3.0 | 2.5 | 1694 | $2,000 | $1.18 | 43d | 1 | 1.30mi |
| 4980 Stonewall Tell Rd Atlanta, GA | 3.0 | 2.0 | 1573 | $3,612 | $2.30 | 24d | 1 | 1.31mi |
| 5131 Forest Downs Ln Atlanta, GA | 4.0 | 2.0 | 2112 | $1,580 | $0.75 | 3d | 1 | 1.38mi |
| 4812 Station Ln Atlanta, GA | 3.0 | 2.5 | 1695 | $2,100 | $1.24 | 1d | 1 | 1.43mi |
| 8317 Hunters Grove Rd Union City, GA | 4.0 | 2.5 | 1821 | $5,500 | $3.02 | 43d | 1 | 1.45mi |
| 5163 Rapahoe Trl Atlanta, GA | 4.0 | 2.5 | 2060 | $2,520 | $1.22 | 1d | 1 | 1.49mi |
Listing history 22 events
-
2026-06-18days on market $165,000 Active 25 DOM
-
2026-06-17days on market $165,000 Active 24 DOM
-
2026-06-16days on market $165,000 Active 23 DOM
-
2026-06-15days on market $165,000 Active 22 DOM
-
2026-06-13days on market $165,000 Active 20 DOM
-
2026-06-09days on market $165,000 Active 16 DOM
-
2026-06-08days on market $165,000 Active 15 DOM
-
2026-06-07days on market $165,000 Active 14 DOM
-
2026-06-04days on market $165,000 Active 11 DOM
-
2026-06-03days on market $165,000 Active 10 DOM
-
2026-06-01days on market $165,000 Active 8 DOM
-
2026-05-31days on market $165,000 Active 7 DOM
-
2026-05-08status Pending Offer Approval 1010-char remark
Show marketing remark (1010 chars)
Investor Special on 1.01 Acres with Full Basement in Prime South Fulton Location! Unlock the potential and exceptional opportunity for savvy investors, builders, or buyers looking to create value. Sitting on 1.01 acres of land, this property offers space, flexibility, and strong upside for renovation, rental income, or resale. Featuring a full basement, the property provides additional square footage and endless possibilities-perfect for expanding living space, creating a separate unit, or maximizing after-repair value. With the right vision, this property can be transformed into a profitable asset. Ideal for cash buyers or those seeking a project with long-term equity growth. Conveniently located near major highways, Hartsfield-Jackson Atlanta International Airport, and the rapidly expanding South Fulton area. Sold as-is. No disclosures. Bring your highest and best offer-serious inquiries only. ESTATE SALE, PROBATE COMPLETE. Opportunities like this don't last-schedule your showing today!
-
2026-05-03price $165,000
-
2026-05-03historical
-
2026-04-10price $155,000
-
2026-03-09$165,000 New 1010-char remark
Show marketing remark (1010 chars)
Investor Special on 1.01 Acres with Full Basement in Prime South Fulton Location! Unlock the potential and exceptional opportunity for savvy investors, builders, or buyers looking to create value. Sitting on 1.01 acres of land, this property offers space, flexibility, and strong upside for renovation, rental income, or resale. Featuring a full basement, the property provides additional square footage and endless possibilities-perfect for expanding living space, creating a separate unit, or maximizing after-repair value. With the right vision, this property can be transformed into a profitable asset. Ideal for cash buyers or those seeking a project with long-term equity growth. Conveniently located near major highways, Hartsfield-Jackson Atlanta International Airport, and the rapidly expanding South Fulton area. Sold as-is. No disclosures. Bring your highest and best offer-serious inquiries only. ESTATE SALE, PROBATE COMPLETE. Opportunities like this don't last-schedule your showing today!
-
2026-03-09$229,000 New
Show marketing remark (1010 chars)
Investor Special on 1.01 Acres with Full Basement in Prime South Fulton Location! Unlock the potential and exceptional opportunity for savvy investors, builders, or buyers looking to create value. Sitting on 1.01 acres of land, this property offers space, flexibility, and strong upside for renovation, rental income, or resale. Featuring a full basement, the property provides additional square footage and endless possibilities-perfect for expanding living space, creating a separate unit, or maximizing after-repair value. With the right vision, this property can be transformed into a profitable asset. Ideal for cash buyers or those seeking a project with long-term equity growth. Conveniently located near major highways, Hartsfield-Jackson Atlanta International Airport, and the rapidly expanding South Fulton area. Sold as-is. No disclosures. Bring your highest and best offer-serious inquiries only. ESTATE SALE, PROBATE COMPLETE. Opportunities like this don't last-schedule your showing today!
-
2009-09-30soldstatus $47,000
-
2009-08-26$42,900
-
2001-08-15soldstatus $155,000
-
1990-04-10soldstatus $105,000
ⓘ Source: listings_history table (triggers on properties + properties_extension) + one-shot
backfill from property_details.listing_events for pre-trigger history.
Tax reassessment forecast GA · Resets to sale price
- Current annual tax
- $3,100 · $258/mo
- Projected year-2 tax
- $3,100 · $258/mo
- Expected delta
- $0/yr ($0/mo · 0.0%)
ⓘ Screening estimate from a state-policy table — verify with the county assessor before closing.
Climate risk First Street
- Flood 1/10 Low FEMA zone X (unshaded) · 0% chance over 30 yrs
- Wildfire 3/10 Moderate
- Heat 5/10 Major 7 d/yr ≥103°F today · 18 d/yr by 30 yrs out
- Wind 5/10 Major 25% chance of damaging wind over 30 yrs
- Air quality 3/10 Moderate 3 unhealthy d/yr today · 4 by 30 yrs out
Nearby sold comps map
Loading sold comps map…
Walkable amenities ~0.75 mi
Loading nearby amenities…
Taxation est. · year 1
- Rental income
- $25,875
- − Mortgage interest
- −$9,243
- − Property taxes
- −$3,100
- − Insurance
- −$825
- − Repairs & maintenance
- −$2,070
- − Management
- −$2,070
- − Depreciation
- −$4,800
- Taxable income
- $3,768
- Est. tax owed @ 24.0%
- −$904
- After-tax cash flow
- $5,229/yr
For passive investors: Depreciation is non-cash, so a rental often shows a tax loss while cash-flowing — sheltering income. Rental losses are passive: they offset passive income freely, and up to $25,000/yr can offset ordinary (W-2) income if you actively participate and your MAGI is under $100k (phasing out to $0 by $150k); unused losses carry forward. On sale, claimed depreciation is recaptured at up to 25%, and gains may owe capital-gains tax (a 1031 exchange can defer both). Figures are a year-1 estimate at your 24.0% rate — not tax advice; consult a CPA.
Schools (NCES district)
- District
- Fulton County
- NCES district ID
- 1302280
- Math proficiency
- 49% ▼ -2.00%
- Reading proficiency
- 53% ▬ 0.00%
- Median HH income
- $68,035
- Composite
- 45.33/100
- National rank
- #2640
- State rank
- #12 of 174 in GA
Livability — South Fulton
No livability data for this city. (Only ~50 U.S. cities are tracked.)
Census & demographics
- Census place
- South Fulton, GA
- County
- Fulton County · 1,094,430 people
- City population
- 127,674
- Metro
- Atlanta-Sandy Springs-Alpharetta, GA
- Population (ZIP)
- 79,872
- Household income
- $67,023
- Rent vs Own
- Severe rent burden
- 4258.0
Population outlook (Fulton County) Hauer SSP2
- Today (2025)
- 1,203,707 people
- By 2030
- 1,299,706 · +8.0%
- By 2040
- 1,488,256 · +23.6%
- By 2050
- 1,664,580 · +38.3%
- By 2075
- 2,036,072 · +69.2%
- By 2100
- 2,222,402 · +84.6%
Race, ethnicity, and origin ACS 2023
- Neighborhood character
- Predominantly Black (89%)
- Race & ethnicity
- Black 89% Hispanic / Latino 5% Two or more races 4% White 3%
- Foreign-born
- 9% · Canada
- Languages at home
- 88% English-only · Spanish 6% French/Haitian/Cajun 1%
Political lean MEDSL · Fulton
- 2024 margin
- Solid D (+44.9) · D 71.9% · R 27.0% · Other 1.1%
- 2008→2024 swing
- +9.8pp toward D · 2008: 35.0pp · 2024: 44.9pp
- All cycles
- 2024: D+44.9 2020: D+46.4 2016: D+42.1 2012: D+29.6 2008: D+35.0
Not yet ingested
- Civics
- —
Market trends
- HPI YoY
- ▲ 18.01%
- Current HPI
- 407.99
- Rent YoY
- ▲ 0.95%
- Metro
- Atlanta-Sandy Springs-Alpharetta, GA
- State GDP YoY
- ▲ 2.66%
- F500 in state
- 28
Industry mix (Fortune 500 HQ in GA)
| Industry | F500 HQs | Revenue |
|---|---|---|
| Paper / Packaging | 2 | $29B |
|
||
| Retail | 1 | $160B |
|
||
| Transportation / Logistics | 1 | $91B |
|
||
| Airlines | 1 | $62B |
|
||
| Consumer Goods | 1 | $47B |
|
||
| Utilities | 1 | $25B |
|
||
Price history
+57.1% since first listed12 events — show timeline
- 2026-05-24 Pending — GAMLS
- 2026-05-24 Listed $165,000 FMLS
- 2026-05-08 Pending — GAMLS
- 2026-05-03 Price Changed $165,000 GAMLS
- 2026-05-03 Listing Removed — GAMLS
- 2026-04-10 Price Changed $155,000 GAMLS
- 2026-03-09 Listed $229,000 GAMLS
- 2026-03-09 Listed $165,000 GAMLS
- 2009-09-30 Sold (MLS) $47,000 FMLS
- 2009-08-26 Listed $42,900 FMLS
- 2001-08-15 Sold (Public Records) $155,000 Public Records
- 1990-04-10 Sold (Public Records) $105,000 Public Records
Property tax history
+4.2%/yrLatest (2025): $3,100 · -42.1% YoY. Source: county tax records.
Cash-flow waterfall
monthlySold comps — $/sqft
last 12 mo · ≤1 miLoading sold comps…