4318 Michigan St · Bartlesville, OK
Flood risk 1/10 · Minimal
- FEMA flood zone
- X (unshaded)
- Chance of flooding over 30 yrs
- 0.0%
- Est. flood insurance / yr
- $507 – $1,088
Fire risk 6/10 · Moderate
- Est. fire insurance / yr
- $2,463 – $4,575
Heat risk 6/10 · Moderate
- Hot days now (above 112°F)
- 7 days/yr
- Hot days in 30 yrs
- 18 days/yr
Wind risk 2/10 · Minimal
- Chance of severe wind over 30 yrs
- 4.0%
Air-quality risk 2/10 · Minimal
- Unhealthy air days now
- 2 days/yr
- Unhealthy air days in 30 yrs
- 2 days/yr
Risk factors via First Street. Map © Google.
Why this score? — see what drove the D+ grade
The composite is a weighted blend of 9 inputs, each scored 0–100. Each bar is that input's sub-score; the figure is the points it added to the 100-point composite (weight × sub-score).
- Cash flow +23.4/30.0
- DSCR +7.5/10.0
- 1% rule +5.0/10.0
- Livability +3.2/5.0
- ARV discount +3.0/15.0
- Schools +2.6/10.0
- Rent growth +2.5/5.0
- Condition / age +2.5/5.0
- Appreciation +0.0/10.0
$150,000
🖨 Deal sheet 📄 Offer letter ✓ Due diligence
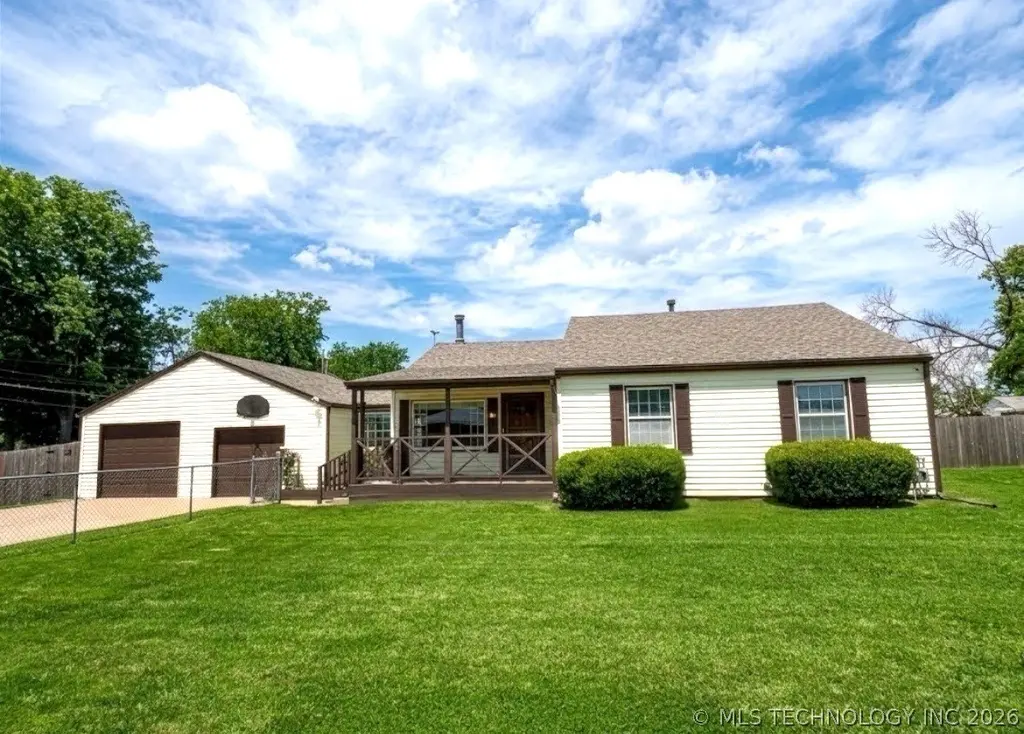
Listing remarks
Charming 2 bedroom, 2 full bath home sits on a spacious . 38 acre fully fenced corner lot. An outdoor lovers paradise starts with a fully fenced front yard & covered front porch. Screened-in back porch with mini fridge, above-ground pool, just in time for summer, with a newly painted deck & newer sand filter, plus a garden area! The fully fenced lot includes a double gate, ideal for RV or boat parking and building a shop. Inside, the remodeled 2019 kitchen is a standout with granite countertops, stainless appliances including a 5-burner gas stove, LG microwave & Samsung refrigerator, apron front sink, updated faucet, & a center island with 3 swivel barstools. The invi
Key facts
- 0.38 acre lot
- 2 garage spots
- Pool
Property features AI
Finance
- HOA & community: Community gutters
Exterior
- Parking: Attached 2-car garage; Boat parking; RV access/parking
- Security: Storm shelter
- Utilities: Public water; Public sewer; Electricity available; Natural gas available; Cable available; Phone available
- Home design: Single-story home
- Construction: Vinyl siding with wood frame construction; Asphalt/fiberglass roof; Crawlspace foundation; Year built from public records
- Exterior features: Concrete driveway; Rain gutters; Covered deck/enclosed patio/porch; Above-ground pool with liner; Shed(s); Chain link/full privacy fencing; Corner lot; Faces south; Storm shelter
Interior
- Kitchen: Country-style kitchen with island and pantry; Dishwasher; Disposal; Microwave; Oven/Range/Stove; Refrigerator; Gas range connection
- Bedrooms: Master bedroom with private bath and separate closets; Additional bedroom with walk-in closet
- Flooring: Laminate flooring; Vinyl flooring
- Bathrooms: Two full bathrooms (including master bath with shower-only configuration and a hall/full bath)
- Heating & cooling: Central heating (gas); Central air conditioning
- Interior features: Granite counters; High-speed Internet; Wired for data; Ceiling fan(s); Electric oven connection; Gas range connection; Programmable thermostat; Vinyl insulated windows; Insulated doors; Storm door(s)
- Laundry & utility: Washer hookup; Electric dryer hookup; Utility room (inside, separate)
Neighborhood map
What this means for you Summary
Snapshot
- This is a 3-bed/1.0-bath single-family listed at $150k.
Deal economics
- At list price, monthly cash flow is $277 ($3k/yr) — positive.
- The deal already cash-flows at list — no discount required.
- To meet the 1% rule (rent ≥ 1% of price), the offer needs to be $150k (0.1% below list).
- Recommended offer: $150k (0.1% below list) — sets the bar for 1% rule.
- Cap rate 8.5% vs local median 4.7% in Bartlesville — top-decile yield for the area; either an underpriced asset or a hidden risk that comps aren't pricing in. Stress-test before assuming the spread holds.
Location & tenants
- Location reads 64/100 on livability (#175 in OK) — a middle-class / working-renter tenant base. Strengths: cost of living A+, housing A+; Watch: employment C-, schools D+, crime D+.
- Bartlesville (town): math 30% / reading 29% proficiency, ranked #59 of 270 in OK (top 22%) — low school quality limits family demand, transient renter base, plan for 1-2y turnover.
- Market conditions: 231 active listings in the ZIP; 6 comparable units currently listed for rent nearby; rentals at typical pace (median 16d on market — plan ~3-4 weeks tenant-placement turnaround); 46 units permitted in Washington County in 2024 (0 in 5+ unit buildings).
Forward outlook
- Local home prices are declining (-3.0%/yr); year-one equity from $1k of loan paydown is wiped out by about $4k of value loss. Plan a longer hold.
- Washington County population projected at +12% by 2050 — modest demand growth; plan on rents tracking national, not racing it.
Negotiation context
- Only 13 days on market — expect competitive offers; lowballing is unlikely to land.
Risks & watch-outs
- Watch-outs: built in 1948 — expect roof / HVAC / electrical / plumbing capex.
- Climate carrying-cost: major wildfire risk; extreme-heat days projected 7→18/yr by 2055 (HVAC capex compounding) — expect insurance premiums to compound above CPI over the hold.
Questions for the listing agent
- Built in 1948 — when were the roof, HVAC, electrical panel, plumbing, and water heater last replaced?
- Is there a deadline driving the sale (1031 exchange, divorce, estate, relocation)? That informs how much negotiation room exists.
- Schools are D-rated, which usually means shorter tenancies and higher turnover. Who's the typical renter profile here, and what's been the actual vacancy rate?
- Crime grade is D in this area — have there been break-ins, vandalism, or insurance claims at this property in the last 3 years? What carrier currently insures it and at what premium?
- The area grade is low — what's the realistic commute time and amenity access for the typical tenant pool here? Any planned neighborhood developments (good or bad) we should know about?
- What's the average days-on-market for RENTAL listings here right now (not sales)? A rising rental-DOM trend means longer vacancies and softer asking-rent achievability than the comps imply.
- What's the recent tenant-quality profile in this submarket — average credit score on applications, eviction rate, late-payment / NSF rate, and stable-employment percentage? A property-management company in the area should have these aggregated.
- How much new for-sale + rental construction is in the pipeline within 1–3 miles? Heavy new supply typically softens prices + rents 12–24 months out; constrained supply supports both.
Investment metrics
- 1% rule
- 1.00% ✗
- Cap rate
- 8.51%
- Cash-on-cash
- 7.91%
- DSCR
- 1.35
- GRM
- 8.3
CMA / ARV
- ARV (on-the-fly)
- $136,448
- Comps found
- 12
Show comp detail 12 sales within ~0.75 mi
| Address | Dist | Beds/Ba | Sqft | Sold | Price | $/sf | Match |
|---|---|---|---|---|---|---|---|
| 3816 Indiana St | 0.40mi | 3/1.0 | 1,300 (-1%) | 3mo | $130,000 | $100 | 78 |
| 243 NE Elmhurst Ave | 0.16mi | 3/1.0 | 1,200 (-8%) | 2mo | $125,000 | $104 | 77 |
| 348 N Fenway Ave | 0.32mi | 3/1.0 | 1,356 (+3%) | 5mo | $139,900 | $103 | 76 |
| 328 SE Waverly Ave | 0.46mi | 3/1.0 | 1,365 (+4%) | 4mo | $144,000 | $105 | 69 |
| 420 N Cummings Ave | 0.42mi | 3/2.0 | 1,374 (+5%) | 4mo | $120,000 | $87 | 65 |
| 521 NE Elmhurst Ave | 0.45mi | 3/1.0 | 1,224 (-7%) | 4mo | $121,997 | $100 | 65 |
| 429 NE Elmhurst Ave | 0.25mi | 2/1.0 (-1) | 1,140 (-13%) | 2mo | $101,000 | $89 | 60 |
| 129 Fleetwood Pl | 0.69mi | 3/2.0 | 1,260 (-4%) | 0mo | $134,000 | $106 | 57 |
| 413 Nebraska Ct | 0.32mi | 3/2.0 | 1,504 (+15%) | 4mo | $150,000 | $100 | 53 |
| 3816 Nebraska St | 0.48mi | 3/1.5 | 1,462 (+11%) | 5mo | $159,000 | $109 | 52 |
| 624 NE Fenway Ave | 0.48mi | 3/2.0 | 1,157 (-12%) | 2mo | $173,000 | $150 | 52 |
| 428 N Spruce Ave | 0.50mi | 3/2.0 | 1,505 (+15%) | 2mo | $158,000 | $105 | 46 |
Match score weights: distance 35% · size 25% · config 20% · recency 20%. Top-matched comps best support the ARV.
Projected returns pro-forma
-3.0% appreciation · 3.0% rent growth · sell at horizon
- IRR
- -4.3%
- Equity multiple
- 0.84×
- Total profit
- $-6,736
- Equity at exit
- $22,365
- IRR
- 5.4%
- Equity multiple
- 1.40×
- Total profit
- $16,600
- Equity at exit
- $12,969
Cash invested: $42,000 (down + closing). Projections, not guarantees.
Landlord ↔ Tenant lean methodology
- Overall (STATE)
- 83 Strongly Landlord-Friendly
- State Oklahoma
- 83 Strongly Landlord-Friendly · R+20
- County
- — inherits STATE
- City
- — inherits STATE
ZIP-level market 74006
- Home prices YoY
- -33.2%
- Active inventory
- 231
- Price-to-rent
- 8.3×
Monthly cashflow live
- Estimated rent
- $1,498 high interval (Pro) →
- Mortgage (P&I)
- −$787
- Tax from tax record
- −$58 /mo · $694/yr
- Insurance
- −$62
- HOA
- −$0
- Vacancy / Maint / Mgmt
- −$315
- Net cashflow
- $277
Break-even live
UW: 25.0% down · 7.5% · 30yr · 1.5% tax · 5.0% vac · 8.0% maint · 8.0% mgmt
Financing live
Cash to close
- Down payment
- $37,500
- Closing costs
- $4,500
- Reserves months
- —
- Total cash needed
- —
Loan-product check · same deal, 3 products live
Conventional
25% down · 7.5% · 30yr
- Down + closing
- —
- Monthly P&I
- —
- Monthly cashflow
- —
- DSCR
- —
- Eligible?
- —
Personal DTI + credit; lowest rate.
DSCR
20% down · 8.5% · 30yr
- Down + closing
- —
- Monthly P&I
- —
- Monthly cashflow
- —
- DSCR
- —
- Eligible?
- —
No personal income docs; deal must DSCR.
Hard money
10% down · 12.0% · 12mo
- Down + closing
- —
- Monthly P&I
- —
- Monthly cashflow
- —
- DSCR
- —
- Eligible?
- —
Short-term bridge; refi at stabilization.
Rent comps 6 comps
| Address | Beds | Baths | Sqft | Rent | $/sqft | DOM | Units | Dist |
|---|---|---|---|---|---|---|---|---|
| 437 NE Myers Ave Bartlesville, OK | 4.0 | 2.0 | 1405 | $1,500 | $1.07 | 11d | 1 | 0.35mi |
| 4714 NE Wisconsin St Bartlesville, OK | 3.0 | 2.0 | 1500 | $1,350 | $0.90 | 15d | 1 | 0.66mi |
| 4716 NE Wisconsin St Bartlesville, OK | 3.0 | 2.0 | 1161 | $1,350 | $1.16 | 23d | 1 | 0.66mi |
| 5610 Baylor Dr Bartlesville, OK | 3.0 | 2.0 | 1407 | $1,500 | $1.07 | 3d | 1 | 1.12mi |
| 4715 SE Adams Blvd Unit 905D Bartlesville, OK | 2.0 | 2.0 | 953 | $900 | $0.94 | 11d | 1 | 1.22mi |
| 5530 Colony Way Bartlesville, OK | 1.0–2.0 | 1.0–2.5 | 1176 | $1,399 | $1.19 | 23d | 4 | 1.37mi |
Listing history 9 events
-
2026-06-07statusdays on market $150,000 Pending 13 DOM
-
2026-06-05days on market $150,000 Active 12 DOM
-
2026-06-03days on market $150,000 Active 11 DOM
-
2026-06-02days on market $150,000 Active 10 DOM
-
2026-06-01days on market $150,000 Active 9 DOM
-
2026-05-31days on market $150,000 Active 8 DOM
-
2026-05-30days on market $150,000 Active 7 DOM
-
2026-05-10status Pending
-
2026-05-05$140,000 Active
ⓘ Source: listings_history table (triggers on properties + properties_extension) + one-shot
backfill from property_details.listing_events for pre-trigger history.
Tax reassessment forecast OK · Resets to sale price
- Current annual tax
- $694 · $58/mo
- Projected year-2 tax
- $1,350 · $112/mo
- Expected delta
- +$656/yr (+$55/mo · 94.5%)
ⓘ Screening estimate from a state-policy table — verify with the county assessor before closing.
Climate risk First Street
- Flood 1/10 Low FEMA zone X (unshaded) · 0% chance over 30 yrs
- Wildfire 6/10 Major
- Heat 6/10 Major 7 d/yr ≥112°F today · 18 d/yr by 30 yrs out
- Wind 2/10 Low 4% chance of damaging wind over 30 yrs
- Air quality 2/10 Low 2 unhealthy d/yr today · 2 by 30 yrs out
Nearby sold comps map
Loading sold comps map…
Walkable amenities ~0.75 mi
Loading nearby amenities…
Taxation est. · year 1
- Rental income
- $17,980
- − Mortgage interest
- −$8,402
- − Property taxes
- −$694
- − Insurance
- −$750
- − Repairs & maintenance
- −$1,438
- − Management
- −$1,438
- − Depreciation
- −$4,364
- Taxable income
- $894
- Est. tax owed @ 24.0%
- −$214
- After-tax cash flow
- $3,107/yr
For passive investors: Depreciation is non-cash, so a rental often shows a tax loss while cash-flowing — sheltering income. Rental losses are passive: they offset passive income freely, and up to $25,000/yr can offset ordinary (W-2) income if you actively participate and your MAGI is under $100k (phasing out to $0 by $150k); unused losses carry forward. On sale, claimed depreciation is recaptured at up to 25%, and gains may owe capital-gains tax (a 1031 exchange can defer both). Figures are a year-1 estimate at your 24.0% rate — not tax advice; consult a CPA.
Schools (NCES district)
- District
- Bartlesville
- NCES district ID
- 4003630
- Math proficiency
- 30% ▼ -13.00%
- Reading proficiency
- 29% ▼ -10.00%
- Median HH income
- $48,889
- Composite
- 25.69/100
- National rank
- #7389
- State rank
- #59 of 270 in OK
Livability — Bartlesville
- Score
- 64/100
- State rank
- #175
- US rank
- #13940
Category grades
Schools grade is shown separately in the Schools card above.
Census & demographics
- Census place
- Bartlesville, OK
- County
- Washington County · 41,935 people
- City population
- 41,935
- Metro
- Bartlesville, OK
- Population (ZIP)
- 27,911
- Household income
- $71,796
- Rent vs Own
- Severe rent burden
- 563.0
Population outlook (Washington County) Hauer SSP2
- Today (2025)
- 54,946 people
- By 2030
- 56,249 · +2.4%
- By 2040
- 58,867 · +7.1%
- By 2050
- 61,600 · +12.1%
- By 2075
- 69,355 · +26.2%
- By 2100
- 73,067 · +33.0%
Race, ethnicity, and origin ACS 2023
- Neighborhood character
- Predominantly White (74%)
- Race & ethnicity
- White 74% Two or more races 9% Native American 7% Hispanic / Latino 6% Asian 3% Black 3%
- Hispanic origin (detail)
- Mexican 5%
- Common ancestry
- Lithuanian 3% Slovak 2% Serbian 2%
- Foreign-born
- 5% · Canada, China, Vietnam
- Languages at home
- 93% English-only · Spanish 4% Vietnamese 1% Chinese 1%
Political lean MEDSL · Washington
- 2024 margin
- Solid R (+47.6) · D 25.0% · R 72.7% · Other 2.4%
- 2008→2024 swing
- -3.1pp toward R · 2008: -44.6pp · 2024: -47.6pp
- All cycles
- 2024: R+47.6 2020: R+48.0 2016: R+48.5 2012: R+47.8 2008: R+44.6
Not yet ingested
- Civics
- —
Market trends
- HPI YoY
- ▼ -118.35%
- Current HPI
- 237.9056
- Rent YoY
- —
- Metro
- Bartlesville, OK
- State GDP YoY
- ▲ 1.55%
- F500 in state
- 6
Industry mix (Fortune 500 HQ in OK)
| Industry | F500 HQs | Revenue |
|---|---|---|
| Energy | 3 | $48B |
|
||
Price history
2 events — show timeline
- 2026-05-10 Pending — MLS Technology, Inc.
- 2026-05-05 Listed $140,000 MLS Technology, Inc.
Property tax history
+3.4%/yrLatest (2025): $694 · +0.3% YoY. Source: county tax records.
Cash-flow waterfall
monthlySold comps — $/sqft
last 12 mo · ≤1 miLoading sold comps…