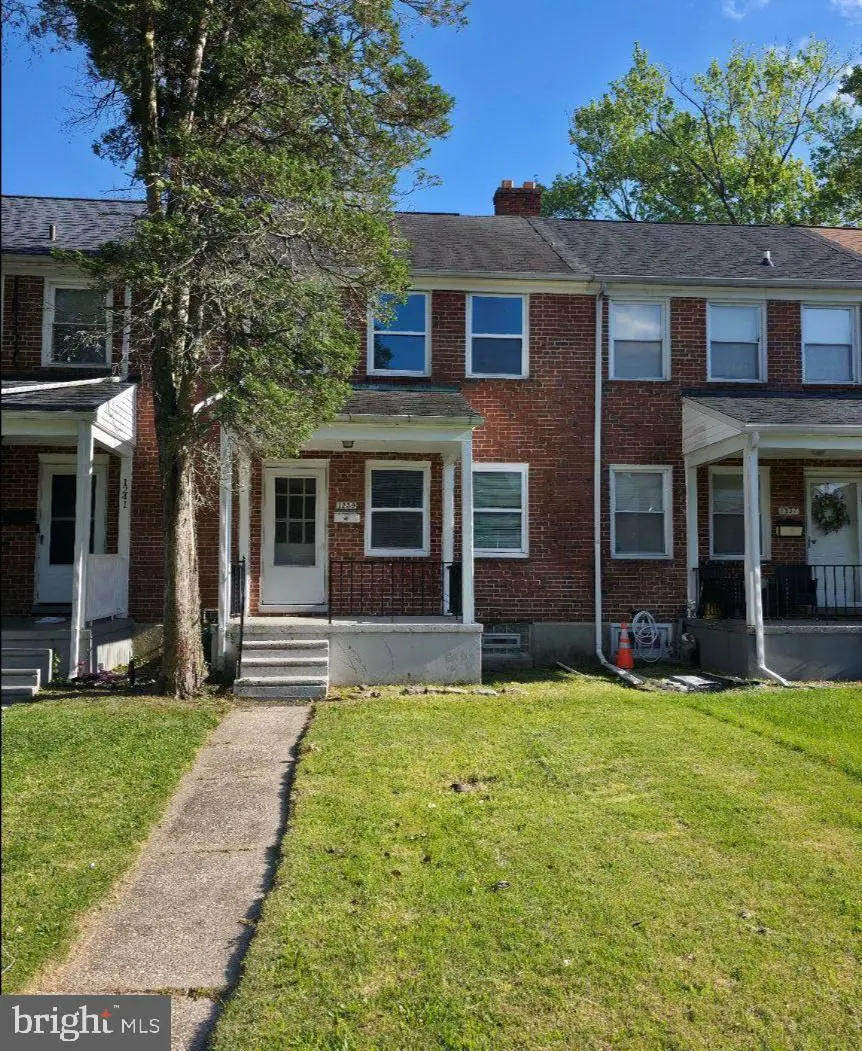
1239 Walters Ave · Baltimore, MD
Flood risk 1/10 · Minimal
- FEMA flood zone
- X (unshaded)
- Chance of flooding over 30 yrs
- 0.0%
- Est. flood insurance / yr
- $473 – $860
Fire risk 1/10 · Minimal
- Est. fire insurance / yr
- $755 – $1,403
Heat risk 7/10 · Major
- Hot days now (above 103°F)
- 7 days/yr
- Hot days in 30 yrs
- 15 days/yr
Wind risk 6/10 · Moderate
- Chance of severe wind over 30 yrs
- 27.0%
Air-quality risk 4/10 · Minor
- Unhealthy air days now
- 3 days/yr
- Unhealthy air days in 30 yrs
- 6 days/yr
Risk factors via First Street. Map © Google.
Why this score? — see what drove the C grade
The composite is a weighted blend of 9 inputs, each scored 0–100. Each bar is that input's sub-score; the figure is the points it added to the 100-point composite (weight × sub-score).
- Cash flow +19.3/30.0
- ARV discount +15.0/15.0
- DSCR +6.1/10.0
- 1% rule +5.3/10.0
- Livability +3.8/5.0
- Rent growth +3.2/5.0
- Condition / age +2.5/5.0
- Schools +1.0/10.0
- Appreciation +0.0/10.0
$158,500
🖨 Deal sheet 📄 Offer letter ✓ Due diligence
Listing remarks
Investor Special! Welcome to 1239 Walters Ave, a charming Baltimore rowhome offering great space, functionality, and opportunity. This home features 3 bedrooms and 1.5 bathrooms, with a comfortable main-level layout, separate living and dining areas, and a partially finished lower level that provides added flexibility for storage, recreation, office space, or future improvements. Enjoy the convenience of city living with easy access to nearby shopping, dining, major commuter routes, local parks, and area universities. Whether you are an owner-occupant looking for an affordable home or an investor seeking a strong rental opportunity, this property offers excellent potential.
Key facts
- Built 1950
- Listed 37 days
Property features AI
Finance
- Other: Fee simple ownership
Exterior
- Parking: On-street parking
- Utilities: Public water; Public sewer; Electric available; Natural gas available; Natural gas hot water
- Home design: Semi-detached property; Estimated year built
- Construction: Brick construction; Brick/mortar foundation; Fiberglass roof
- Exterior features: Not in a federal flood zone
Interior
- Kitchen: Gas oven/range; Refrigerator
- Bedrooms: Three bedrooms on the first upper level
- Flooring: Carpet
- Bathrooms: One full bathroom (all upper levels); One half bathroom (lower level)
- Heating & cooling: Forced air heating (natural gas); Ceiling fan cooling
- Interior features: Carpeted areas; Ceiling fans; Dining area; Traditional floor plan; Partially finished basement
- Laundry & utility: Washer/dryer hookups
Neighborhood map
What this means for you Summary
Snapshot
- This is a 3-bed/1.0-bath townhouse listed at $158k.
Deal economics
- At list price, monthly cash flow is $173 ($2k/yr) — positive.
- The deal already cash-flows at list — no discount required.
- Meets the 1% rule at list price ($2k rent vs $158k).
- Recommended offer: $154k (3.0% below list) — sets the bar for market timing.
- Cap rate 7.6% vs local median 6.0% in Baltimore — meaningfully above typical; check what's discounted (condition, days-on-market, listing class) to confirm the premium yield is real.
Location & tenants
- Location reads 76/100 on livability (#90 in MD, #3,396 nationally) — a middle-class / working-renter tenant base. Strengths: amenities A+, commute A+, housing A+; Watch: schools D, crime F.
- Baltimore City Public Schools (urban): math 7% / reading 16% proficiency, ranked #24 of 24 in MD (top 100%) — low school quality limits family demand, transient renter base, plan for 1-2y turnover; 79% free/reduced lunch — lower-income household profile, screen leases tightly.
- Market conditions: Rents rising (+2.9%/yr); 71 active listings in the ZIP; 40 comparable units currently listed for rent nearby; rentals at typical pace (median 24d on market — plan ~3-4 weeks tenant-placement turnaround); 40% of comp listings sitting > 30 days — soft ceiling on asking rent; 1,273 units permitted in Baltimore city in 2024 (1,104 in 5+ unit buildings).
- This rent runs 31% of the median local income ($63k/yr) — at the standard rent-burdened threshold; future hikes will face affordability resistance.
Forward outlook
- Local home prices are declining (-3.0%/yr); year-one equity from $1k of loan paydown is wiped out by about $5k of value loss. Plan a longer hold.
- Baltimore County population projected to shrink 4% by 2050 — rents likely to lag national; underwrite the cash flow, not the appreciation.
Negotiation context
- It's been on market 37 days — a 3% lower offer ($154k) is reasonable based on typical stale-listing flexibility.
- 4 sale attempts since 24y ago with the ask held roughly flat each time — persistent listings suggest the price (not the market) is what's stuck; bring a comps-based counter.
- Current owner paid $78k; list at $158k implies a 105% gain — meaningful room to come down on a strong offer.
Risks & watch-outs
- Watch-outs: built in 1950 — expect roof / HVAC / electrical / plumbing capex.
- Climate carrying-cost: major wind risk, 27% chance of damaging wind over 30y; extreme-heat days projected 7→15/yr by 2055 (HVAC capex compounding) — expect insurance premiums to compound above CPI over the hold.
Questions for the listing agent
- It's been on market 37 days. Have you received any prior offers? Is the seller open to a 3% concession, seller financing, or rate buy-down credit?
- Built in 1950 — when were the roof, HVAC, electrical panel, plumbing, and water heater last replaced?
- Is there a deadline driving the sale (1031 exchange, divorce, estate, relocation)? That informs how much negotiation room exists.
- Schools are D-rated, which usually means shorter tenancies and higher turnover. Who's the typical renter profile here, and what's been the actual vacancy rate?
- Crime grade is F in this area — have there been break-ins, vandalism, or insurance claims at this property in the last 3 years? What carrier currently insures it and at what premium?
- What's the average days-on-market for RENTAL listings here right now (not sales)? A rising rental-DOM trend means longer vacancies and softer asking-rent achievability than the comps imply.
- What's the recent tenant-quality profile in this submarket — average credit score on applications, eviction rate, late-payment / NSF rate, and stable-employment percentage? A property-management company in the area should have these aggregated.
- How much new for-sale + rental construction is in the pipeline within 1–3 miles? Heavy new supply typically softens prices + rents 12–24 months out; constrained supply supports both.
Investment metrics
- 1% rule
- 1.03% ✓
- Cap rate
- 7.60%
- Cash-on-cash
- 4.68%
- DSCR
- 1.21
- GRM
- 8.1
CMA / ARV
- ARV (median comp)
- $217,314
- List price
- $158,500
- Delta
- -27.06%
- Verdict
- UNDERPRICED
- Comps
- 20 within 1.0 mi
Show comp detail 12 sales within ~0.75 mi
| Address | Dist | Beds/Ba | Sqft | Sold | Price | $/sf | Match |
|---|---|---|---|---|---|---|---|
| 1224 Sheridan Ave | 0.49mi | 3/1.0 | 1,064 (0%) | 8mo | $160,000 | $150 | 71 |
| 1649 Gleneagle Rd | 0.48mi | 3/1.0 | 1,064 (0%) | 9mo | $200,000 | $188 | 70 |
| 5533 Midwood Ave | 0.47mi | 3/1.0 | 1,032 (-3%) | 8mo | $74,000 | $72 | 66 |
| 1018 Cameron Rd | 0.43mi | 2/2.0 (-1) | 1,032 (-3%) | 1mo | $169,000 | $164 | 65 |
| 5603 Purdue Ave | 0.20mi | 3/2.0 | 1,160 (+9%) | 12mo | $236,000 | $203 | 62 |
| 1720 Wadsworth Way | 0.69mi | 3/1.0 | 1,064 (0%) | 11mo | $160,100 | $150 | 58 |
| 1076 Tunbridge Rd | 0.37mi | 3/2.0 | 1,144 (+8%) | 11mo | $210,000 | $184 | 57 |
| 5102 Hillen Rd | 0.75mi | 3/2.0 | 1,008 (-5%) | 7mo | $149,900 | $149 | 46 |
| 1225 Silverthorne Rd | 0.62mi | 3/1.5 | 1,216 (+14%) | 11mo | $167,500 | $138 | 36 |
| 1534 Wadsworth Way | 0.57mi | 4/2.0 (+1) | 1,216 (+14%) | 7mo | $282,000 | $232 | 35 |
| 1420 Cedarcroft Rd | 0.75mi | 2/1.5 (-1) | 1,192 (+12%) | 6mo | $160,714 | $135 | 33 |
| 1703 Swansea Rd | 0.62mi | 2/2.0 (-1) | 1,190 (+12%) | 12mo | $170,000 | $143 | 33 |
Match score weights: distance 35% · size 25% · config 20% · recency 20%. Top-matched comps best support the ARV.
Projected returns pro-forma
-3.0% appreciation · 2.86% rent growth · sell at horizon
- IRR
- -9.1%
- Equity multiple
- 0.67×
- Total profit
- $-14,862
- Equity at exit
- $23,633
- IRR
- 0.1%
- Equity multiple
- 1.01×
- Total profit
- $457
- Equity at exit
- $13,704
Cash invested: $44,380 (down + closing). Projections, not guarantees.
Landlord ↔ Tenant lean methodology
- Overall (CITY)
- 12 Strongly Tenant-Friendly
- State Maryland
- 27 Tenant-Leaning · D+14
- County
- — inherits STATE
- City Baltimore
- 12 Strongly Tenant-Friendly · D+58
ZIP-level market 21239
- Rents YoY
- 2.9%
- Active inventory
- 71
- Price-to-rent
- 8.1×
Monthly cashflow live
- Estimated rent
- $1,635 high interval (Pro) →
- Mortgage (P&I)
- −$831
- Tax from tax record
- −$221 /mo · $2,656/yr
- Insurance
- −$66
- HOA
- −$0
- Vacancy / Maint / Mgmt
- −$343
- Net cashflow
- $173
Break-even live
UW: 25.0% down · 7.5% · 30yr · 1.5% tax · 5.0% vac · 8.0% maint · 8.0% mgmt
Financing live
Cash to close
- Down payment
- $39,625
- Closing costs
- $4,755
- Reserves months
- —
- Total cash needed
- —
Loan-product check · same deal, 3 products live
Conventional
25% down · 7.5% · 30yr
- Down + closing
- —
- Monthly P&I
- —
- Monthly cashflow
- —
- DSCR
- —
- Eligible?
- —
Personal DTI + credit; lowest rate.
DSCR
20% down · 8.5% · 30yr
- Down + closing
- —
- Monthly P&I
- —
- Monthly cashflow
- —
- DSCR
- —
- Eligible?
- —
No personal income docs; deal must DSCR.
Hard money
10% down · 12.0% · 12mo
- Down + closing
- —
- Monthly P&I
- —
- Monthly cashflow
- —
- DSCR
- —
- Eligible?
- —
Short-term bridge; refi at stabilization.
Rent comps 40 comps
| Address | Beds | Baths | Sqft | Rent | $/sqft | DOM | Units | Dist |
|---|---|---|---|---|---|---|---|---|
| 5664 Woodmont Ave Baltimore, MD | 1.0–2.0 | 1.0 | 710 | $1,175 | $1.65 | 3d | 10 | 0.13mi |
| 1090 Cameron Rd Baltimore, MD | 2.0 | 1.0 | 832 | $1,675 | $2.01 | 4d | 1 | 0.28mi |
| 1111 Gleneagle Rd Unit 2 Baltimore, MD | 2.0 | 1.0 | 1452 | $1,050 | $0.72 | 44d | 1 | 0.35mi |
| 1129 Gleneagle Rd Unit B Baltimore, MD | 2.0 | 1.0 | 700 | $1,200 | $1.71 | 44d | 1 | 0.35mi |
| 5307 Leith Rd Baltimore, MD | 2.0 | 1.0 | 630 | $1,350 | $2.14 | 13d | 1 | 0.35mi |
| 1116 Gleneagle Rd Unit 2 Baltimore, MD | 2.0 | 1.0 | 726 | $1,750 | $2.41 | 24d | 1 | 0.38mi |
| 1116 Gleneagle Rd Unit 2 Baltimore, MD | 2.0 | 1.0 | 876 | $1,750 | $2.00 | 44d | 1 | 0.38mi |
| 1116 Gleneagle Rd Unit 1 Baltimore, MD | 2.0 | 1.0 | 726 | $1,695 | $2.33 | 4d | 1 | 0.38mi |
| 1106 Gleneagle Rd Unit 2 Baltimore, MD | 2.0 | 1.0 | 1100 | $1,450 | $1.32 | 44d | 1 | 0.38mi |
| 1006 Cameron Rd Baltimore, MD | 2.0 | 1.0 | 1032 | $950 | $0.92 | 44d | 1 | 0.41mi |
| 5626 Midwood Ave Unit 2 Baltimore, MD | 2.0 | 1.0 | 1452 | $1,100 | $0.76 | 24d | 1 | 0.42mi |
| 5622 Midwood Ave Baltimore, MD | 3.0 | 2.0 | 1452 | $2,300 | $1.58 | 44d | 1 | 0.42mi |
| 5618 Midwood Ave Unit 1 Baltimore, MD | 2.0 | 1.0 | 800 | $1,250 | $1.56 | 24d | 1 | 0.42mi |
| 917 Reverdy Rd Unit A Baltimore, MD | 3.0 | 1.0 | 1200 | $2,100 | $1.75 | 44d | 1 | 0.53mi |
| 1221 Glenwood Ave Baltimore, MD | 3.0 | 2.0 | 1390 | $2,595 | $1.87 | 44d | 1 | 0.53mi |
| 818 Bradhurst Rd Baltimore, MD | 2.0 | 1.0 | 1216 | $1,250 | $1.03 | 44d | 1 | 0.61mi |
| 818 Bradhurst Rd Baltimore, MD | 2.0 | 1.0 | 1216 | $1,350 | $1.11 | 4d | 1 | 0.61mi |
| 1275 Kitmore Rd Unit 1262B-A Baltimore, MD | 2.0 | 1.0 | 923 | $1,320 | $1.43 | 2d | 1 | 0.64mi |
| 1275 Kitmore Rd Unit 1215B-T Baltimore, MD | 2.0 | 1.0 | 811 | $1,435 | $1.77 | 4d | 1 | 0.64mi |
| 1275 Kitmore Rd Unit 1263K-T Baltimore, MD | 2.0 | 1.0 | 811 | $1,485 | $1.83 | 4d | 1 | 0.64mi |
| 1275 Kitmore Rd Unit 1259K-T Baltimore, MD | 2.0 | 1.0 | 811 | $1,535 | $1.89 | 4d | 1 | 0.64mi |
| 1275 Kitmore Rd Unit 1221B-T Baltimore, MD | 2.0 | 1.0 | 811 | $1,560 | $1.92 | 24d | 1 | 0.64mi |
| 1275 Kitmore Rd Unit 1245K-T Baltimore, MD | 3.0 | 1.0 | 935 | $1,895 | $2.03 | 4d | 1 | 0.64mi |
| 1275 Kitmore Rd Unit 1267K-T Baltimore, MD | 2.0 | 1.0 | 827 | $1,585 | $1.92 | 44d | 1 | 0.64mi |
| 1275 Kitmore Rd Baltimore, MD | 2.0 | 1.0 | 827 | $1,525 | $1.84 | 44d | 1 | 0.64mi |
| 1275 Kitmore Rd Unit 1276B-A Baltimore, MD | 2.0 | 1.0 | 812 | $1,360 | $1.67 | 44d | 1 | 0.64mi |
| 1275 Kitmore Rd Unit 1248B-A Baltimore, MD | 2.0 | 1.0 | 812 | $1,360 | $1.67 | 4d | 1 | 0.64mi |
| 1275 Kitmore Rd Unit 1260K-T Baltimore, MD | 2.0 | 1.0 | 811 | $1,410 | $1.74 | 4d | 1 | 0.64mi |
| 1726 E Belvedere Ave Baltimore, MD | 3.0 | 2.0 | 1140 | $1,895 | $1.66 | 22d | 1 | 0.65mi |
| 6105 Chinquapin Pkwy Unit 1st Floor Baltimore, MD | 2.0 | 1.0 | 726 | $1,299 | $1.79 | 18d | 1 | 0.65mi |
| 1020 Dartmouth Glen Way Baltimore, MD | 3.0 | 2.5 | 1152 | $2,250 | $1.95 | 24d | 1 | 0.68mi |
| 6149 Dunroming Rd Baltimore, MD | 3.0 | 1.5 | 1400 | $1,895 | $1.35 | 11d | 1 | 0.70mi |
| 1224 Winston Ave Baltimore, MD | 3.0 | 2.0 | 1248 | $2,100 | $1.68 | 18d | 1 | 0.71mi |
| 6121 Chinquapin Pkwy Unit 1 Baltimore, MD | 2.0 | 1.0 | 700 | $1,350 | $1.93 | 18d | 1 | 0.71mi |
| 1104 Meridene Dr Unit 1 Baltimore, MD | 2.0 | 1.0 | 1098 | $1,350 | $1.23 | 44d | 1 | 0.72mi |
| 1908 E Belvedere Ave Baltimore, MD | 4.0 | 2.0 | 1425 | $1,950 | $1.37 | 20d | 1 | 0.74mi |
| 1900 Ramblewood Rd Apt A Baltimore, MD | 2.0 | 2.0 | 903 | $1,847 | $2.05 | 44d | 1 | 0.74mi |
| 6116 Northwood Dr Unit B Baltimore, MD | 2.0 | 1.0 | 810 | $1,329 | $1.64 | 44d | 1 | 0.77mi |
| 6106 Northwood Dr Baltimore, MD | 1.0–2.0 | 1.0 | 750 | $1,299 | $1.73 | 4d | 2 | 0.78mi |
| 1408 Cedarcroft Rd Baltimore, MD | 3.0 | 2.0 | 912 | $1,957 | $2.15 | 44d | 1 | 0.78mi |
Listing history 22 events
-
2026-06-15statusdays on market $158,500 Pending 37 DOM
-
2026-06-13days on market $158,500 Active 36 DOM
-
2026-06-09days on market $158,500 Active 32 DOM
-
2026-06-08days on market $158,500 Active 31 DOM
-
2026-06-07days on market $158,500 Active 30 DOM
-
2026-06-04days on market $158,500 Active 27 DOM
-
2026-06-03days on market $158,500 Active 26 DOM
-
2026-06-02days on market $158,500 Active 25 DOM
-
2026-06-01days on market $158,500 Active 24 DOM
-
2026-05-31days on market $158,500 Active 23 DOM
-
2026-05-08$158,500 Active 682-char remark
-
2026-05-03historical $158,500 682-char remark
-
2022-05-07historical
-
2022-03-12$195,999 Active
-
2003-06-12soldstatus $77,500
-
2003-05-29soldstatus $77,500
-
2003-05-04historical
-
2002-10-23$79,900
-
2002-07-08soldstatus $36,000
-
2002-07-02soldstatus $36,000
-
2002-05-21historical
-
2002-03-18$49,000
ⓘ Source: listings_history table (triggers on properties + properties_extension) + one-shot
backfill from property_details.listing_events for pre-trigger history.
Tax reassessment forecast MD · Partial reset (capped growth)
- Current annual tax
- $2,656 · $221/mo
- Projected year-2 tax
- $2,656 · $221/mo
- Expected delta
- $0/yr ($0/mo · 0.0%)
ⓘ Screening estimate from a state-policy table — verify with the county assessor before closing.
Climate risk First Street
- Flood 1/10 Low FEMA zone X (unshaded) · 0% chance over 30 yrs
- Wildfire 1/10 Low
- Heat 7/10 Severe 7 d/yr ≥103°F today · 15 d/yr by 30 yrs out
- Wind 6/10 Major 27% chance of damaging wind over 30 yrs
- Air quality 4/10 Moderate 3 unhealthy d/yr today · 6 by 30 yrs out
Nearby sold comps map
Loading sold comps map…
Walkable amenities ~0.75 mi
Loading nearby amenities…
Taxation est. · year 1
- Rental income
- $19,618
- − Mortgage interest
- −$8,878
- − Property taxes
- −$2,656
- − Insurance
- −$792
- − Repairs & maintenance
- −$1,569
- − Management
- −$1,569
- − Depreciation
- −$4,611
- Taxable loss
- −$459
- Est. tax savings @ 24.0%
- +$110
- After-tax cash flow
- $2,185/yr
For passive investors: Depreciation is non-cash, so a rental often shows a tax loss while cash-flowing — sheltering income. Rental losses are passive: they offset passive income freely, and up to $25,000/yr can offset ordinary (W-2) income if you actively participate and your MAGI is under $100k (phasing out to $0 by $150k); unused losses carry forward. On sale, claimed depreciation is recaptured at up to 25%, and gains may owe capital-gains tax (a 1031 exchange can defer both). Figures are a year-1 estimate at your 24.0% rate — not tax advice; consult a CPA.
Schools (NCES district)
- District
- Baltimore City Public Schools
- NCES district ID
- 2400090
- Math proficiency
- 7% ▼ -9.00%
- Reading proficiency
- 16% ▼ -5.00%
- Median HH income
- $42,108
- Composite
- 10.08/100
- National rank
- #9805
- State rank
- #24 of 24 in MD
Livability — Baltimore
- Score
- 76/100
- State rank
- #90
- US rank
- #3396
Category grades
Schools grade is shown separately in the Schools card above.
Census & demographics
- Census place
- Baltimore, MD
- County
- Baltimore City · 558,601 people
- City population
- 588,727
- Metro
- Baltimore-Columbia-Towson, MD
- Population (ZIP)
- 27,346
- Household income
- $62,650
- Rent vs Own
- Severe rent burden
- 1103.0
Population outlook (Baltimore County) Hauer SSP2
- Today (2025)
- 624,249 people
- By 2030
- 621,541 · -0.4%
- By 2040
- 609,756 · -2.3%
- By 2050
- 597,249 · -4.3%
- By 2075
- 552,236 · -11.5%
- By 2100
- 513,934 · -17.7%
Race, ethnicity, and origin ACS 2023
- Neighborhood character
- Predominantly Black (76%)
- Race & ethnicity
- Black 76% White 12% Asian 4% Hispanic / Latino 4% Two or more races 4%
- Common ancestry
- Lithuanian 1% Romanian 1% Russian 1%
- Foreign-born
- 10% · Canada, United Kingdom, China
- Languages at home
- 88% English-only · Other Indo-European 3% Spanish 2% French/Haitian/Cajun 2%
Political lean MEDSL · Baltimore
- 2024 margin
- Solid D (+73.0) · D 85.2% · R 12.2% · Other 2.6%
- 2008→2024 swing
- -2.5pp toward R · 2008: 75.5pp · 2024: 73.0pp
- All cycles
- 2024: D+73.0 2020: D+76.6 2016: D+74.6 2012: D+76.4 2008: D+75.5
Not yet ingested
- Civics
- —
Market trends
- HPI YoY
- ▼ -164.48%
- Current HPI
- 258.094
- Rent YoY
- ▲ 2.86%
- Metro
- Baltimore-Columbia-Towson, MD
- State GDP YoY
- ▲ 2.97%
- F500 in state
- 12
Industry mix (Fortune 500 HQ in MD)
| Industry | F500 HQs | Revenue |
|---|---|---|
| Aerospace / Defense | 1 | $71B |
|
||
| Utilities | 1 | $25B |
|
||
| Hotels | 1 | $24B |
|
||
| Consumer Goods | 1 | $7B |
|
||
| Real Estate | 1 | $6B |
|
||
| Chemicals | 1 | $2B |
|
||
Price history
+223.5% since first listed13 events — show timeline
- 2026-06-15 Pending — BRIGHT MLS
- 2026-05-08 Listed $158,500 BRIGHT MLS
- 2026-05-03 Coming Soon $158,500 BRIGHT MLS
- 2022-05-07 Listing Removed — BRIGHT MLS
- 2022-03-12 Listed $195,999 BRIGHT MLS
- 2003-06-12 Sold (Public Records) $77,500 Public Records
- 2003-05-29 Sold (MLS) $77,500 MRIS
- 2003-05-04 Delisted — MRIS
- 2002-10-23 Listed $79,900 MRIS
- 2002-07-08 Sold (Public Records) $36,000 Public Records
- 2002-07-02 Sold (MLS) $36,000 MRIS
- 2002-05-21 Delisted — MRIS
- 2002-03-18 Listed $49,000 MRIS
Property tax history
+0.3%/yrLatest (2025): $2,656 · +7.6% YoY. Source: county tax records.
Cash-flow waterfall
monthlySold comps — $/sqft
last 12 mo · ≤1 miLoading sold comps…