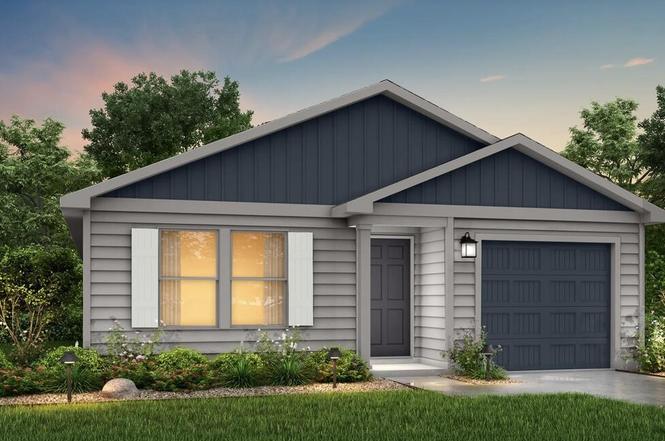
106 Lillian Ct · Roxboro, NC
Flood risk No data
- FEMA flood zone
- —
- Chance of flooding over 30 yrs
- —
- Est. flood insurance / yr
- —
Fire risk No data
- Est. fire insurance / yr
- —
Heat risk No data
- Hot days now (above threshold)
- —
- Hot days in 30 yrs
- —
Wind risk No data
- Chance of severe wind over 30 yrs
- —
Air-quality risk No data
- Unhealthy air days now
- —
- Unhealthy air days in 30 yrs
- —
Risk factors via First Street. Map © Google.
Why this score? — see what drove the D- grade
The composite is a weighted blend of 9 inputs, each scored 0–100. Each bar is that input's sub-score; the figure is the points it added to the 100-point composite (weight × sub-score).
- Cash flow +8.7/30.0
- Appreciation +8.5/10.0
- ARV discount +3.5/15.0
- Schools +3.4/10.0
- Livability +2.8/5.0
- 1% rule +2.7/10.0
- Rent growth +2.5/5.0
- Condition / age +2.5/5.0
- DSCR +2.4/10.0
$234,990
🖨 Deal sheet (PDF) 📄 Offer letter ✓ Due diligence
Listing remarks MLS
Model 1401 A1 - Yellowstone
Key facts
- Central island
- Open-concept kitchen
- Walk-in closet
Tags
Property features AI
Finance
- Other: Lot size approximately 0.29 acres; Living area reported as 1,401 above-grade square feet
- HOA & community: No homeowners association; Not a senior community
Exterior
- Parking: Attached garage (1 space)
- Utilities: Public water; Public sewer
- Home design: One-story house; Yellowstone model
- Construction: Frame construction; Shingle roof; Slab foundation; Built as part of the Yellowstone builder model
- Exterior features: Public-maintained road access; Zoned SFR (single-family residential)
Interior
- Bedrooms: 4 bedrooms (all on the main level)
- Flooring: Carpet; Vinyl
- Bathrooms: 2 full bathrooms
- Heating & cooling: Central heating (electric heat pump); Central air conditioning (electric)
- Interior features: Carpet and vinyl flooring
Neighborhood map
What this means for you Summary
Snapshot
- This is a 4-bed/2.0-bath single-family listed at $235k.
Deal economics
- At list price, monthly cash flow is $-200 ($-2k/yr) — negative.
- To cash-flow at today's rent, offer at most $206k (12.3% below list).
- To meet the 1% rule (rent ≥ 1% of price), the offer needs to be $180k (23.3% below list).
- Recommended offer: $180k (23.3% below list) — sets the bar for 1% rule.
Location & tenants
- Location reads 55/100 on livability (#649 in NC) — a working-class tenant base; expect higher turnover. Strengths: cost of living A+; Watch: crime F, amenities F, commute F.
- Person County Schools (rural): math 39% / reading 42% proficiency, ranked #110 of 178 in NC (top 62%) — families likely to look elsewhere, expect single-tenant / working-renter base with shorter leases.
- Zoned schools: Person High (math 45% / reading 44%, grade F, #352 of 535 statewide, top 68%, 1,079 students, 60% FRL).
- Market conditions: 99 active listings in the ZIP; 113 units permitted in Person County in 2024 (0 in 5+ unit buildings).
Forward outlook
- In year one you build about $18k of equity ($2k loan paydown + $16k appreciation (7.0% local appreciation)).
- Person County population projected at -15% by 2050 — secular population decline; favor cash flow + early exit over multi-decade hold.
- By year 3, paydown + projected appreciation supports a ~$45k cash-out refi (75% LTV) — recoverable capital for the next deal without selling this one.
Negotiation context
- It's been on market 162 days — a 12% lower offer ($207k) is reasonable based on typical stale-listing flexibility.
- 2 sale attempts; this cycle's ask has dropped $22k (9%) from the opening price — seller is motivated, your offer sets the floor, not the list.
Questions for the listing agent
- What do current leases actually rent for vs. the listed asking? Can we see a recent rent roll and the last 12 months of T-12 income?
- It's been on market 162 days. Have you received any prior offers? Is the seller open to a 23% concession, seller financing, or rate buy-down credit?
- Why hasn't it sold? Are there any deal-killer items the seller is aware of (foundation, flood, title, zoning, code violations)?
- Is there a deadline driving the sale (1031 exchange, divorce, estate, relocation)? That informs how much negotiation room exists.
- Schools are D-rated, which usually means shorter tenancies and higher turnover. Who's the typical renter profile here, and what's been the actual vacancy rate?
- Crime grade is F in this area — have there been break-ins, vandalism, or insurance claims at this property in the last 3 years? What carrier currently insures it and at what premium?
- The area grade is low — what's the realistic commute time and amenity access for the typical tenant pool here? Any planned neighborhood developments (good or bad) we should know about?
- What's the average days-on-market for RENTAL listings here right now (not sales)? A rising rental-DOM trend means longer vacancies and softer asking-rent achievability than the comps imply.
- What's the recent tenant-quality profile in this submarket — average credit score on applications, eviction rate, late-payment / NSF rate, and stable-employment percentage? A property-management company in the area should have these aggregated.
- How much new for-sale + rental construction is in the pipeline within 1–3 miles? Heavy new supply typically softens prices + rents 12–24 months out; constrained supply supports both.
Investment metrics
- 1% rule
- 0.77% ✗
- Cap rate
- 5.27%
- Cash-on-cash
- -3.64%
- DSCR
- 0.84
- GRM
- 10.9
CMA / ARV
- ARV (on-the-fly)
- $215,754
- Comps found
- 12
Show comp detail 12 sales within ~0.75 mi
| Address | Dist | Beds/Ba | Sqft | Sold | Price | $/sf | Match |
|---|---|---|---|---|---|---|---|
| 86 Maggie Ln | 0.08mi | 3/2.0 (-1) | 1,265 (-10%) | 3mo | $219,000 | $173 | 73 |
| 137 Lillian Ct | 0.00mi | 4/2.5 | 1,600 (+14%) | 4mo | $240,990 | $151 | 71 |
| 51 Landon Pl | 0.17mi | 4/2.5 | 1,600 (+14%) | 4mo | $238,990 | $149 | 63 |
| 176 Lillian Ct | 0.20mi | 4/2.5 | 1,600 (+14%) | 7mo | $241,993 | $151 | 59 |
| 132 Lillian Ct | 0.15mi | 3/2.0 (-1) | 1,202 (-14%) | 6mo | $224,488 | $187 | 59 |
| 250 Landon Pl | 0.18mi | 3/2.5 (-1) | 1,600 (+14%) | 6mo | $246,190 | $154 | 56 |
| 140 Lillian Ct | 0.17mi | 3/2.5 (-1) | 1,600 (+14%) | 8mo | $248,993 | $156 | 55 |
| 225 Landon Pl | 0.18mi | 3/2.5 (-1) | 1,600 (+14%) | 8mo | $255,490 | $160 | 54 |
| 142 Yarborough St | 0.42mi | 3/1.0 (-1) | 1,280 (-9%) | 3mo | $59,900 | $47 | 54 |
| 76 Landon Pl | 0.20mi | 3/2.5 (-1) | 1,600 (+14%) | 8mo | $246,601 | $154 | 54 |
| 224 Landon Pl | 0.27mi | 3/2.0 (-1) | 1,202 (-14%) | 7mo | $219,997 | $183 | 53 |
| 245 Lillian Ct | 0.29mi | 3/2.5 (-1) | 1,600 (+14%) | 8mo | $238,000 | $149 | 50 |
Match score weights: distance 35% · size 25% · config 20% · recency 20%. Top-matched comps best support the ARV.
Projected returns pro-forma
7.01% appreciation · 3.0% rent growth · sell at horizon
- IRR
- 14.9%
- Equity multiple
- 2.06×
- Total profit
- $69,454
- Equity at exit
- $162,945
- IRR
- 14.8%
- Equity multiple
- 4.21×
- Total profit
- $211,445
- Equity at exit
- $309,615
Cash invested: $65,797 (down + closing). Projections, not guarantees.
Landlord ↔ Tenant lean methodology
- Overall (STATE)
- 85 Strongly Landlord-Friendly
- State North Carolina
- 85 Strongly Landlord-Friendly · R+3
- County
- — inherits STATE
- City
- — inherits STATE
ZIP-level market 27573
- Home prices YoY
- 2.5%
- Active inventory
- 99
- Price-to-rent
- 10.9×
Monthly cashflow live
- Estimated rent
- $1,803 medium interval (Pro) →
- Mortgage (P&I)
- −$1,232
- Tax est. 1.5%
- −$294 /mo · $3,525/yr
- Insurance
- −$98
- HOA
- −$0
- Vacancy / Maint / Mgmt
- −$379
- Net cashflow
- $-200
Break-even live
Sensitivity live
| Price | -10% $-37 | -5% $-119 | +0% $-200 | +5% $-281 | +10% $-362 |
|---|---|---|---|---|---|
| Rent | -10% $-342 | -5% $-271 | +0% $-200 | +5% $-129 | +10% $-57 |
| Rate | -1.0pp $-81 | -0.5pp $-140 | base $-200 | +0.5pp $-261 | +1.0pp $-323 |
UW: 25.0% down · 7.5% · 30yr · 1.5% tax · 5.0% vac · 8.0% maint · 8.0% mgmt
Financing live
Cash to close
- Down payment
- $58,748
- Closing costs
- $7,050
- Reserves months
- —
- Total cash needed
- —
Loan-product check · same deal, 3 products live
Conventional
25% down · 7.5% · 30yr
- Down + closing
- —
- Monthly P&I
- —
- Monthly cashflow
- —
- DSCR
- —
- Eligible?
- —
Personal DTI + credit; lowest rate.
DSCR
20% down · 8.5% · 30yr
- Down + closing
- —
- Monthly P&I
- —
- Monthly cashflow
- —
- DSCR
- —
- Eligible?
- —
No personal income docs; deal must DSCR.
Hard money
10% down · 12.0% · 12mo
- Down + closing
- —
- Monthly P&I
- —
- Monthly cashflow
- —
- DSCR
- —
- Eligible?
- —
Short-term bridge; refi at stabilization.
Listing history 26 events
-
2026-06-21days on market $234,990 Active 162 DOM
-
2026-06-21days on market $234,990 Active 161 DOM
-
2026-06-18days on market $234,990 Active 159 DOM
-
2026-06-17days on market $234,990 Active 158 DOM
-
2026-06-17price $234,990 Active 157 DOM
-
2026-06-16days on market $235,990 Active 157 DOM
-
2026-06-15days on market $235,990 Active 156 DOM
-
2026-06-13pricedays on market $235,990 Active 154 DOM
-
2026-06-12days on market $238,990 Active 153 DOM
-
2026-06-09days on market $238,990 Active 150 DOM
-
2026-06-08days on market $238,990 Active 149 DOM
-
2026-06-07days on market $238,990 Active 148 DOM
-
2026-06-05days on market $238,990 Active 146 DOM
-
2026-06-04days on market $238,990 Active 144 DOM
-
2026-06-02days on market $238,990 Active 143 DOM
-
2026-06-01days on market $238,990 Active 142 DOM
-
2026-05-31days on market $238,990 Active 141 DOM
-
2026-05-22price $238,990 27-char remark
Show marketing remark (27 chars)
Model 1401 A1 - Yellowstone
-
2026-05-22price $238,990
Show marketing remark (27 chars)
Model 1401 A1 - Yellowstone
-
2026-05-14price $242,990
-
2026-05-13price $242,990 27-char remark
Show marketing remark (27 chars)
Model 1401 A1 - Yellowstone
-
2026-03-18price $244,990
-
2026-03-05price $244,990 27-char remark
Show marketing remark (27 chars)
Model 1401 A1 - Yellowstone
-
2026-01-09$256,990 Active
-
2026-01-03price $256,990 27-char remark
Show marketing remark (27 chars)
Model 1401 A1 - Yellowstone
-
2026-01-02$257,740 Active 27-char remark
Show marketing remark (27 chars)
Model 1401 A1 - Yellowstone
ⓘ Source: listings_history table (triggers on properties + properties_extension) + one-shot
backfill from property_details.listing_events for pre-trigger history.
Nearby sold comps map
Loading sold comps map…
Walkable amenities ~0.75 mi
Loading nearby amenities…
Taxation est. · year 1
- Rental income
- $21,632
- − Mortgage interest
- −$13,163
- − Property taxes
- −$3,525
- − Insurance
- −$1,175
- − Repairs & maintenance
- −$1,731
- − Management
- −$1,731
- − Depreciation
- −$6,836
- Taxable loss
- −$6,528
- Est. tax savings @ 24.0%
- +$1,567
- After-tax cash flow
- $-831/yr
For passive investors: Depreciation is non-cash, so a rental often shows a tax loss while cash-flowing — sheltering income. Rental losses are passive: they offset passive income freely, and up to $25,000/yr can offset ordinary (W-2) income if you actively participate and your MAGI is under $100k (phasing out to $0 by $150k); unused losses carry forward. On sale, claimed depreciation is recaptured at up to 25%, and gains may owe capital-gains tax (a 1031 exchange can defer both). Figures are a year-1 estimate at your 24.0% rate — not tax advice; consult a CPA.
Schools (NCES district)
- District
- Person County Schools
- NCES district ID
- 3703630
- Math proficiency
- 39% ▬ 0.00%
- Reading proficiency
- 42% ▲ 2.00%
- Median HH income
- $43,729
- Composite
- 34.3/100
- National rank
- #5242
- State rank
- #110 of 178 in NC
Livability — Roxboro
- Score
- 55/100
- State rank
- #649
- US rank
- #23536
Category grades
Schools grade is shown separately in the Schools card above.
Census & demographics
- City population
- 11,954
- Population (ZIP)
- 11,954
Population outlook (Person County) Hauer SSP2
- Today (2025)
- 38,577 people
- By 2030
- 37,847 · -1.9%
- By 2040
- 35,740 · -7.4%
- By 2050
- 32,683 · -15.3%
- By 2075
- 24,979 · -35.2%
- By 2100
- 15,779 · -59.1%
Race, ethnicity, and origin ACS 2023
- Neighborhood character
- Diverse neighborhood (Simpson 0.65)
- Race & ethnicity
- White 45% Black 36% Hispanic / Latino 11% Two or more races 11% Native American 2%
- Hispanic origin (detail)
- Mexican 9%
- Common ancestry
- Slovak 3% Romanian 2% Italian 1%
- Foreign-born
- 5% · Canada
- Languages at home
- 90% English-only · Spanish 8% Other Asian/Pacific 1% Other Indo-European 1%
Political lean MEDSL · Person
- 2024 margin
- Strong R (+23.7) · D 37.7% · R 61.4%
- 2008→2024 swing
- -15.2pp toward R · 2008: -8.5pp · 2024: -23.7pp
- All cycles
- 2024: R+23.7 2020: R+21.6 2016: R+17.3 2012: R+11.0 2008: R+8.5
Not yet ingested
- Civics
- —
Market trends
- HPI YoY
- ▲ 7.01%
- Current HPI
- 286.1496
- Rent YoY
- —
- Metro
- —
- State GDP YoY
- ▲ 3.28%
- F500 in state
- 26
Industry mix (Fortune 500 HQ in NC)
| Industry | F500 HQs | Revenue |
|---|---|---|
| Financial Services | 2 | $213B |
|
||
| Retail | 2 | $95B |
|
||
| Industrial Conglomerate | 1 | $38B |
|
||
| Metals / Steel | 1 | $35B |
|
||
| Utilities | 1 | $30B |
|
||
| Industrial Machinery | 1 | $19B |
|
||
Price history
-7.3% since first listed9 events — show timeline
- 2026-05-22 Price Changed $238,990 Zillow
- 2026-05-22 Price Changed $238,990 TMLS
- 2026-05-14 Price Changed $242,990 TMLS
- 2026-05-13 Price Changed $242,990 Zillow
- 2026-03-18 Price Changed $244,990 TMLS
- 2026-03-05 Price Changed $244,990 Zillow
- 2026-01-09 Listed $256,990 TMLS
- 2026-01-03 Price Changed $256,990 Zillow
- 2026-01-02 Listed $257,740 Zillow
Cash-flow waterfall
monthlySold comps — $/sqft
last 12 mo · ≤1 miLoading sold comps…