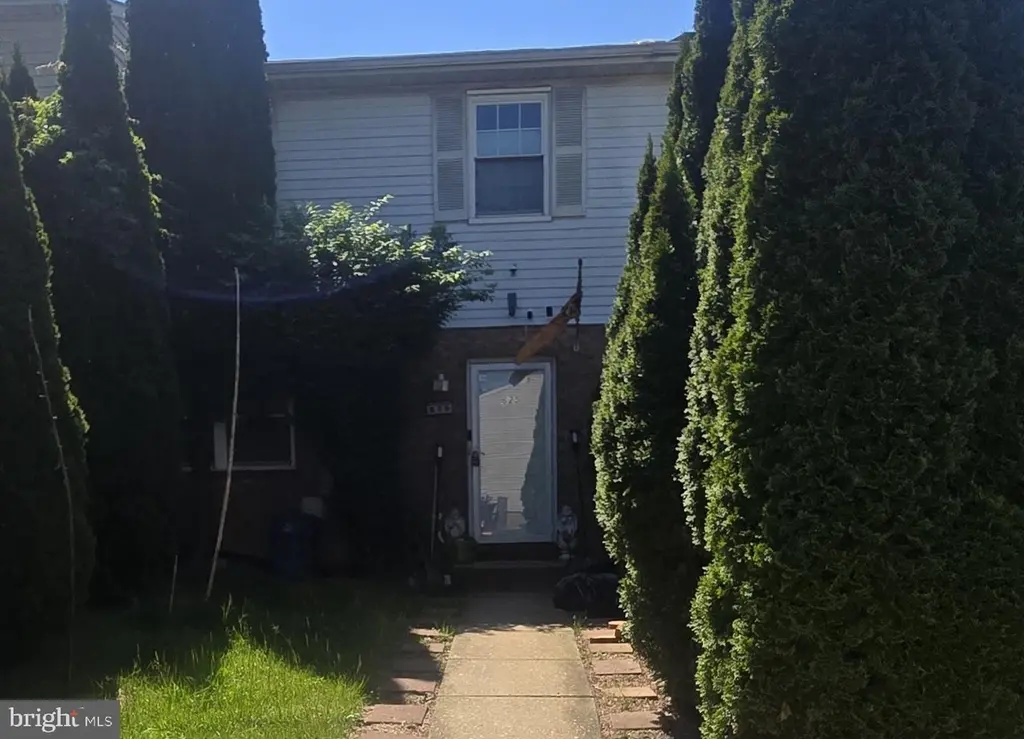
625 Glynlee Ct · Reisterstown, MD
Flood risk 1/10 · Minimal
- FEMA flood zone
- X (unshaded)
- Chance of flooding over 30 yrs
- 0.0%
- Est. flood insurance / yr
- $473 – $860
Fire risk 3/10 · Minor
- Est. fire insurance / yr
- $755 – $1,403
Heat risk 6/10 · Moderate
- Hot days now (above 105°F)
- 7 days/yr
- Hot days in 30 yrs
- 16 days/yr
Wind risk 4/10 · Minor
- Chance of severe wind over 30 yrs
- 13.0%
Air-quality risk 3/10 · Minor
- Unhealthy air days now
- 2 days/yr
- Unhealthy air days in 30 yrs
- 4 days/yr
Risk factors via First Street. Map © Google.
Why this score? — see what drove the D- grade
The composite is a weighted blend of 9 inputs, each scored 0–100. Each bar is that input's sub-score; the figure is the points it added to the 100-point composite (weight × sub-score).
- Cash flow +12.9/30.0
- ARV discount +6.8/15.0
- Rent growth +4.2/5.0
- DSCR +3.9/10.0
- Livability +3.6/5.0
- 1% rule +3.2/10.0
- Condition / age +2.5/5.0
- Schools +2.3/10.0
- Appreciation +0.0/10.0
$280,000
🖨 Deal sheet 📄 Offer letter ✓ Due diligence
Key facts
- Large deck
- Dead end street
- Built 1985
Tags
Property features AI
Exterior
- Parking: On-street parking
- Utilities: Public water; Public sewer; Cable TV available
- Home design: Interior townhouse/rowhouse; Combination brick and vinyl siding exterior
- Construction: Combination of brick and vinyl siding construction; Concrete perimeter foundation; Double-pane windows with screens
- Exterior features: Sidewalks; Deck(s); Patio(s); Partially fenced yard; Outside and rear entrances to basement; Walkout basement (partially finished)
Interior
- Kitchen: Dishwasher; Disposal; Electric oven/range; Range hood; Refrigerator; Exhaust fan
- Bedrooms: Three bedrooms on the upper level
- Bathrooms: Two full bathrooms; One half bathroom
- Heating & cooling: Heat pump heating; Central air; Ceiling fans; Electric heating and cooling systems; Electric hot water
- Interior features: Combination kitchen and dining area; Window treatments; Traditional floor plan; Sliding glass and storm doors
- Laundry & utility: Washer; Dryer
Neighborhood map
What this means for you Summary
Snapshot
- This is a 3-bed/2.5-bath townhouse listed at $280k.
Deal economics
- At list price, monthly cash flow is $-20 ($-238/yr) — negative.
- To cash-flow at today's rent, offer at most $276k (1.3% below list).
- To meet the 1% rule (rent ≥ 1% of price), the offer needs to be $228k (18.5% below list).
- Recommended offer: $228k (18.5% below list) — sets the bar for 1% rule.
- Cap rate 6.2% vs local median 3.5% in Reisterstown — top-decile yield for the area; either an underpriced asset or a hidden risk that comps aren't pricing in. Stress-test before assuming the spread holds.
Location & tenants
- Location reads 72/100 on livability (#147 in MD) — a middle-class / working-renter tenant base. Strengths: commute A+, housing A+, employment A-; Watch: schools D+, crime F, amenities F.
- Baltimore County Public Schools (suburban): math 15% / reading 34% proficiency, ranked #11 of 24 in MD (top 46%) — low school quality limits family demand, transient renter base, plan for 1-2y turnover.
- Market conditions: Rents rising fast (+6.7%/yr); 150 active listings in the ZIP; 17 comparable units currently listed for rent nearby; rentals at typical pace (median 18d on market — plan ~3-4 weeks tenant-placement turnaround); 41% of comp listings sitting > 30 days — soft ceiling on asking rent; high-income renter base; 1,511 units permitted in Baltimore County in 2024 (643 in 5+ unit buildings).
Forward outlook
- Local home prices are declining (-3.0%/yr); year-one equity from $2k of loan paydown is wiped out by about $8k of value loss. Plan a longer hold.
- Baltimore County population projected at +12% by 2050 — modest demand growth; plan on rents tracking national, not racing it.
Negotiation context
- It's been on market 22 days — a 2% lower offer ($276k) is reasonable based on typical stale-listing flexibility.
- 2 sale attempts since 27y ago with the ask held roughly flat each time — persistent listings suggest the price (not the market) is what's stuck; bring a comps-based counter.
- Current owner paid $93k; list at $280k implies a 201% gain — meaningful room to come down on a strong offer.
Risks & watch-outs
- Climate carrying-cost: extreme-heat days projected 7→16/yr by 2055 (HVAC capex compounding) — expect insurance premiums to compound above CPI over the hold.
Questions for the listing agent
- What do current leases actually rent for vs. the listed asking? Can we see a recent rent roll and the last 12 months of T-12 income?
- Is there a deadline driving the sale (1031 exchange, divorce, estate, relocation)? That informs how much negotiation room exists.
- Schools are D-rated, which usually means shorter tenancies and higher turnover. Who's the typical renter profile here, and what's been the actual vacancy rate?
- Crime grade is F in this area — have there been break-ins, vandalism, or insurance claims at this property in the last 3 years? What carrier currently insures it and at what premium?
- The area grade is low — what's the realistic commute time and amenity access for the typical tenant pool here? Any planned neighborhood developments (good or bad) we should know about?
- What's the average days-on-market for RENTAL listings here right now (not sales)? A rising rental-DOM trend means longer vacancies and softer asking-rent achievability than the comps imply.
- What's the recent tenant-quality profile in this submarket — average credit score on applications, eviction rate, late-payment / NSF rate, and stable-employment percentage? A property-management company in the area should have these aggregated.
- How much new for-sale + rental construction is in the pipeline within 1–3 miles? Heavy new supply typically softens prices + rents 12–24 months out; constrained supply supports both.
Investment metrics
- 1% rule
- 0.82% ✗
- Cap rate
- 6.21%
- Cash-on-cash
- -0.30%
- DSCR
- 0.99
- GRM
- 10.2
CMA / ARV
- ARV (on-the-fly)
- $276,000
- Comps found
- 12
Show comp detail 12 sales within ~0.75 mi
| Address | Dist | Beds/Ba | Sqft | Sold | Price | $/sf | Match |
|---|---|---|---|---|---|---|---|
| 12325 Boncrest Dr | 0.08mi | 3/1.5 | 1,540 (+3%) | 4mo | $277,000 | $180 | 85 |
| 26 Bonbon Ct | 0.22mi | 3/1.5 | 1,540 (+3%) | 4mo | $280,000 | $182 | 78 |
| 17 Craftsman Ct | 0.10mi | 4/2.5 (+1) | 1,620 (+8%) | 3mo | $320,000 | $198 | 74 |
| 616 Saint Georges Station Rd | 0.15mi | 3/2.0 | 1,400 (-7%) | 7mo | $290,000 | $207 | 74 |
| 736 Kennington Rd #736 | 0.45mi | 2/2.0 (-1) | 1,440 (-4%) | 1mo | $245,000 | $170 | 64 |
| 1 Brampton Ct | 0.25mi | 3/2.5 | 1,710 (+14%) | 5mo | $365,000 | $213 | 60 |
| 611 Brickston Rd | 0.38mi | 3/2.5 | 1,344 (-10%) | 7mo | $325,000 | $242 | 59 |
| 409 Fox View Ct | 0.48mi | 3/1.5 | 1,580 (+5%) | 7mo | $235,000 | $149 | 59 |
| 10944 Baskerville Rd | 0.33mi | 4/3.5 (+1) | 1,662 (+11%) | 5mo | $380,000 | $229 | 53 |
| 29 Hunting Horn Cir | 0.51mi | 2/3.0 (-1) | 1,640 (+9%) | 5mo | $290,000 | $177 | 50 |
| 1 Glyndale Ct | 0.66mi | 3/2.0 | 1,710 (+14%) | 1mo | $315,000 | $184 | 43 |
| 5 Cherry Tree Ct | 0.73mi | 3/1.5 | 1,712 (+14%) | 8mo | $290,000 | $169 | 32 |
Match score weights: distance 35% · size 25% · config 20% · recency 20%. Top-matched comps best support the ARV.
Projected returns pro-forma
-3.0% appreciation · 6.73% rent growth · sell at horizon
- IRR
- -13.0%
- Equity multiple
- 0.52×
- Total profit
- $-37,784
- Equity at exit
- $41,749
- IRR
- 0.7%
- Equity multiple
- 1.06×
- Total profit
- $4,713
- Equity at exit
- $24,209
Cash invested: $78,400 (down + closing). Projections, not guarantees.
Landlord ↔ Tenant lean methodology
- Overall (STATE)
- 27 Tenant-Leaning
- State Maryland
- 27 Tenant-Leaning · D+14
- County
- — inherits STATE
- City
- — inherits STATE
ZIP-level market 21136
- Rents YoY
- 6.7%
- Active inventory
- 150
- Price-to-rent
- 10.2×
Monthly cashflow live
- Estimated rent
- $2,283 high interval (Pro) →
- Mortgage (P&I)
- −$1,468
- Tax from tax record
- −$238 /mo · $2,858/yr
- Insurance
- −$117
- HOA
- −$0
- Vacancy / Maint / Mgmt
- −$479
- Net cashflow
- $-20
Break-even live
UW: 25.0% down · 7.5% · 30yr · 1.5% tax · 5.0% vac · 8.0% maint · 8.0% mgmt
Financing live
Cash to close
- Down payment
- $70,000
- Closing costs
- $8,400
- Reserves months
- —
- Total cash needed
- —
Loan-product check · same deal, 3 products live
Conventional
25% down · 7.5% · 30yr
- Down + closing
- —
- Monthly P&I
- —
- Monthly cashflow
- —
- DSCR
- —
- Eligible?
- —
Personal DTI + credit; lowest rate.
DSCR
20% down · 8.5% · 30yr
- Down + closing
- —
- Monthly P&I
- —
- Monthly cashflow
- —
- DSCR
- —
- Eligible?
- —
No personal income docs; deal must DSCR.
Hard money
10% down · 12.0% · 12mo
- Down + closing
- —
- Monthly P&I
- —
- Monthly cashflow
- —
- DSCR
- —
- Eligible?
- —
Short-term bridge; refi at stabilization.
Rent comps 17 comps
| Address | Beds | Baths | Sqft | Rent | $/sqft | DOM | Units | Dist |
|---|---|---|---|---|---|---|---|---|
| 12308 Bonfire Dr Reisterstown, MD | 3.0 | 3.0 | 1540 | $2,630 | $1.71 | 43d | 1 | 0.03mi |
| 16 Craftsman Ct Reisterstown, MD | 3.0 | 2.5 | 1420 | $2,200 | $1.55 | 43d | 1 | 0.08mi |
| 13 Craftsman Ct Reisterstown, MD | 2.0 | 2.5 | 1120 | $2,199 | $1.96 | 2d | 1 | 0.11mi |
| 12367 Boncrest Dr Reisterstown, MD | 3.0 | 2.5 | 1840 | $2,399 | $1.30 | 2d | 1 | 0.16mi |
| 12390 Boncrest Dr Reisterstown, MD | 3.0 | 2.5 | 1540 | $2,700 | $1.75 | 2d | 1 | 0.20mi |
| 40 Bon Oak Ct Reisterstown, MD | 3.0 | 1.5 | 1540 | $2,000 | $1.30 | 24d | 1 | 0.35mi |
| 26 Wessex Ct Reisterstown, MD | 4.0 | 3.5 | 1780 | $2,875 | $1.62 | 43d | 1 | 0.47mi |
| 632 Kennington Rd #632 Reisterstown, MD | 2.0 | 2.0 | 1122 | $2,000 | $1.78 | 17d | 1 | 0.47mi |
| 605 Shirley Manor Rd Reisterstown, MD | 4.0 | 2.0 | 1808 | $2,800 | $1.55 | 43d | 1 | 0.99mi |
| 32 Mission Wood Way Reisterstown, MD | 2.0 | 1.0 | 1478 | $1,650 | $1.12 | 43d | 1 | 1.09mi |
| 437 Woodhill Dr Owings Mills, MD | 3.0 | 2.5 | 1320 | $2,395 | $1.81 | 43d | 1 | 1.20mi |
| 133 Hammershire Rd Unit C Reisterstown, MD | 3.0 | 2.0 | 1812 | $2,300 | $1.27 | 17d | 1 | 1.21mi |
| 401 Chartley Park Rd Reisterstown, MD | 1.0–3.0 | 1.0–2.0 | 1266 | $2,155 | $1.70 | 1d | 42 | 1.22mi |
| 263 Hammershire Rd Unit 263 Reisterstown, MD | 2.0 | 1.5 | 1168 | $1,950 | $1.67 | 43d | 1 | 1.23mi |
| 38 Glyndon Gate Way Reisterstown, MD | 3.0 | 3.5 | 2016 | $2,799 | $1.39 | 3d | 1 | 1.25mi |
| 10 Brookebury Dr Reisterstown, MD | 1.0–3.0 | 1.0–1.5 | 931 | $1,920 | $2.06 | 1d | 53 | 1.39mi |
| 208 Persimmon Cir Reisterstown, MD | 3.0 | 2.5 | 1660 | $2,700 | $1.63 | 5d | 1 | 1.49mi |
Listing history 20 events
-
2026-06-18days on market $280,000 Active 22 DOM
-
2026-06-17days on market $280,000 Active 21 DOM
-
2026-06-16days on market $280,000 Active 20 DOM
-
2026-06-15days on market $280,000 Active 19 DOM
-
2026-06-13days on market $280,000 Active 17 DOM
-
2026-06-09days on market $280,000 Active 13 DOM
-
2026-06-08days on market $280,000 Active 12 DOM
-
2026-06-07days on market $280,000 Active 11 DOM
-
2026-06-04days on market $280,000 Active 8 DOM
-
2026-06-03days on market $280,000 Active 7 DOM
-
2026-06-02days on market $280,000 Active 6 DOM
-
2026-06-01days on market $280,000 Active 5 DOM
-
2026-05-31days on market $280,000 Active 4 DOM
-
2026-05-27$280,000 Active
-
1999-06-29soldstatus $92,900
-
1999-06-23soldstatus $92,900
-
1999-05-01historical
-
1999-03-29$92,900
-
1993-10-20soldstatus $86,900
-
1987-10-06soldstatus $66,000
ⓘ Source: listings_history table (triggers on properties + properties_extension) + one-shot
backfill from property_details.listing_events for pre-trigger history.
Tax reassessment forecast MD · Partial reset (capped growth)
- Current annual tax
- $2,858 · $238/mo
- Projected year-2 tax
- $2,955 · $246/mo
- Expected delta
- +$97/yr (+$8/mo · 3.4%)
ⓘ Screening estimate from a state-policy table — verify with the county assessor before closing.
Climate risk First Street
- Flood 1/10 Low FEMA zone X (unshaded) · 0% chance over 30 yrs
- Wildfire 3/10 Moderate
- Heat 6/10 Major 7 d/yr ≥105°F today · 16 d/yr by 30 yrs out
- Wind 4/10 Moderate 13% chance of damaging wind over 30 yrs
- Air quality 3/10 Moderate 2 unhealthy d/yr today · 4 by 30 yrs out
Nearby sold comps map
Loading sold comps map…
Walkable amenities ~0.75 mi
Loading nearby amenities…
Taxation est. · year 1
- Rental income
- $27,392
- − Mortgage interest
- −$15,684
- − Property taxes
- −$2,858
- − Insurance
- −$1,400
- − Repairs & maintenance
- −$2,191
- − Management
- −$2,191
- − Depreciation
- −$8,145
- Taxable loss
- −$5,078
- Est. tax savings @ 24.0%
- +$1,219
- After-tax cash flow
- $980/yr
For passive investors: Depreciation is non-cash, so a rental often shows a tax loss while cash-flowing — sheltering income. Rental losses are passive: they offset passive income freely, and up to $25,000/yr can offset ordinary (W-2) income if you actively participate and your MAGI is under $100k (phasing out to $0 by $150k); unused losses carry forward. On sale, claimed depreciation is recaptured at up to 25%, and gains may owe capital-gains tax (a 1031 exchange can defer both). Figures are a year-1 estimate at your 24.0% rate — not tax advice; consult a CPA.
Schools (NCES district)
- District
- Baltimore County Public Schools
- NCES district ID
- 2400120
- Math proficiency
- 15% ▼ -16.00%
- Reading proficiency
- 34% ▼ -5.00%
- Median HH income
- $66,746
- Composite
- 23.17/100
- National rank
- #7948
- State rank
- #11 of 24 in MD
Livability — Reisterstown
- Score
- 72/100
- State rank
- #147
- US rank
- #6349
Category grades
Schools grade is shown separately in the Schools card above.
Census & demographics
- County
- Baltimore County · 769,527 people
- City population
- 32,088
- Metro
- Baltimore-Columbia-Towson, MD
- Population (ZIP)
- 32,088
- Household income
- $118,500
- Rent vs Own
- Severe rent burden
- 1003.0
Population outlook (Baltimore County) Hauer SSP2
- Today (2025)
- 885,518 people
- By 2030
- 909,272 · +2.7%
- By 2040
- 951,547 · +7.5%
- By 2050
- 990,955 · +11.9%
- By 2075
- 1,086,411 · +22.7%
- By 2100
- 1,135,078 · +28.2%
Race, ethnicity, and origin ACS 2023
- Neighborhood character
- Diverse neighborhood (Simpson 0.62)
- Race & ethnicity
- White 55% Black 25% Asian 8% Hispanic / Latino 7% Two or more races 5%
- Hispanic origin (detail)
- Common ancestry
- Romanian 3% Italian 3% Scotch-Irish 2%
- Foreign-born
- 17% · Canada, China, Vietnam
- Languages at home
- 81% English-only · Other Indo-European 6% Russian/Polish/Slavic 4% Spanish 3%
Political lean MEDSL · Baltimore
- 2024 margin
- Strong D (+24.5) · D 61.0% · R 36.5% · Other 2.5%
- 2008→2024 swing
- +9.9pp toward D · 2008: 14.6pp · 2024: 24.5pp
- All cycles
- 2024: D+24.5 2020: D+27.0 2016: D+17.4 2012: D+16.4 2008: D+14.6
Not yet ingested
- Civics
- —
Market trends
- HPI YoY
- ▼ -289.71%
- Current HPI
- 240.465
- Rent YoY
- ▲ 6.73%
- Metro
- Baltimore-Columbia-Towson, MD
- State GDP YoY
- ▲ 2.97%
- F500 in state
- 12
Industry mix (Fortune 500 HQ in MD)
| Industry | F500 HQs | Revenue |
|---|---|---|
| Aerospace / Defense | 1 | $71B |
|
||
| Utilities | 1 | $25B |
|
||
| Hotels | 1 | $24B |
|
||
| Consumer Goods | 1 | $7B |
|
||
| Real Estate | 1 | $6B |
|
||
| Chemicals | 1 | $2B |
|
||
Price history
+324.2% since first listed7 events — show timeline
- 2026-05-27 Listed $280,000 BRIGHT MLS
- 1999-06-29 Sold (Public Records) $92,900 Public Records
- 1999-06-23 Sold (MLS) $92,900 MRIS
- 1999-05-01 Delisted — MRIS
- 1999-03-29 Listed $92,900 MRIS
- 1993-10-20 Sold (Public Records) $86,900 Public Records
- 1987-10-06 Sold (Public Records) $66,000 Public Records
Property tax history
+2.8%/yrLatest (2025): $2,858 · +2.6% YoY. Source: county tax records.
Cash-flow waterfall
monthlySold comps — $/sqft
last 12 mo · ≤1 miLoading sold comps…