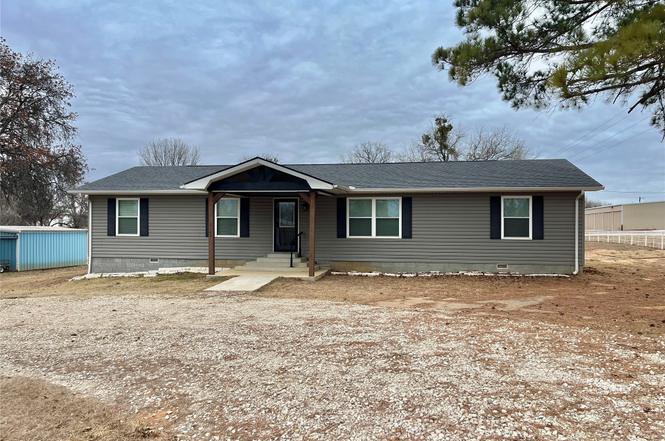
2163 Paradise Rd · McBride, OK
Flood risk 1/10 · Minimal
- FEMA flood zone
- X
- Chance of flooding over 30 yrs
- 0.0%
- Est. flood insurance / yr
- $507 – $1,088
Fire risk 4/10 · Minor
- Est. fire insurance / yr
- $2,463 – $4,575
Heat risk 6/10 · Moderate
- Hot days now (above 109°F)
- 7 days/yr
- Hot days in 30 yrs
- 22 days/yr
Wind risk 4/10 · Minor
- Chance of severe wind over 30 yrs
- 18.0%
Air-quality risk 3/10 · Minor
- Unhealthy air days now
- 2 days/yr
- Unhealthy air days in 30 yrs
- 3 days/yr
Risk factors via First Street. Map © Google.
Why this score? — see what drove the C- grade
The composite is a weighted blend of 9 inputs, each scored 0–100. Each bar is that input's sub-score; the figure is the points it added to the 100-point composite (weight × sub-score).
- Cash flow +14.9/30.0
- Appreciation +10.0/10.0
- ARV discount +7.5/15.0
- DSCR +4.5/10.0
- 1% rule +3.3/10.0
- Rent growth +2.5/5.0
- Schools +2.5/10.0
- Livability +2.5/5.0
- Condition / age +2.5/5.0
$275,000
🖨 Deal sheet 📄 Offer letter ✓ Due diligence
Listing remarks
Great home in Washita Point on Lake Texoma. Home has 3 bedrooms/2 full baths, great open living-kitchen-dining area, large bedrooms, large laundry room with a washwe & dryer & sink, large covered back patio & pergula, storage building and has beautiful mature shade trees on the corner lot. It has beautiful wood custom cabinets, large walkin pantry, Master suite has walkin closet with shelving, bath with walkin tile shower & double vanities. Located just minutes from Lake Texoma, Alberta Creek Marina & Restaurant. This place feels like home.
Key facts
- Lake texoma
- Storage building
- Large laundry room
Tags
Property features AI
Finance
- HOA & community: Marina in the community
Exterior
- Security: No safety shelter
- Utilities: Electricity available; Water available (rural water); Septic tank
- Home design: Single-story home; Faces south
- Construction: HardiPlank and wood frame construction; Asphalt/fiberglass roof; Crawlspace foundation; Built (year per public records)
- Exterior features: Covered patio and porch; Porch; Patio; Shed(s); Storage; Pergola; Corner lot; Mature trees; Boat ramp/lift access; Lake and river access (water access); Less than 1 mile to water (Texoma Lake)
Interior
- Kitchen: Oven; Range; Stove; Dishwasher; Refrigerator; Electric oven/range connection
- Flooring: Vinyl flooring
- Bathrooms: 2 full bathrooms
- Heating & cooling: Central heating (electric); Central air conditioning
- Interior features: Granite counters; Ceiling fan(s); Storm door(s); Vinyl windows
- Laundry & utility: Washer hookup; Electric dryer hookup; Washer; Dryer; Electric water heater
Neighborhood map
What this means for you Summary
Snapshot
- This is a 3-bed/2.0-bath other listed at $275k.
Deal economics
- At list price, monthly cash flow is $79 ($949/yr) — positive.
- The deal already cash-flows at list — no discount required.
- To meet the 1% rule (rent ≥ 1% of price), the offer needs to be $229k (16.8% below list).
- Recommended offer: $229k (16.8% below list) — sets the bar for 1% rule.
Location & tenants
- Location reads: area grade C — affects rentability + tenant quality, not the cash-flow math above.
- Kingston (rural): math 27% / reading 32% proficiency, ranked #70 of 270 in OK (top 26%) — low school quality limits family demand, transient renter base, plan for 1-2y turnover; 76% free/reduced lunch — lower-income household profile, screen leases tightly.
- Market conditions: 435 active listings in the ZIP; 42 units permitted in Marshall County in 2024 (0 in 5+ unit buildings).
Forward outlook
- In year one you build about $29k of equity ($2k loan paydown + $28k appreciation (10.0% local appreciation)).
- Marshall County population projected at +22% by 2050 — long-run rental-demand tailwind backs the buy-and-hold thesis.
- At projected returns (10.0% appreciation + 3.0% rent growth), your $77k cash investment doubles in ~3 years — after that, you're playing with house money.
- By year 2, paydown + projected appreciation supports a ~$47k cash-out refi (75% LTV) — recoverable capital for the next deal without selling this one.
Negotiation context
- It's been on market 143 days — a 12% lower offer ($242k) is reasonable based on typical stale-listing flexibility.
- 7 sale attempts since 4y ago with the ask held roughly flat each time — persistent listings suggest the price (not the market) is what's stuck; bring a comps-based counter.
- Current owner paid $45k; list at $275k implies a 511% gain — meaningful room to come down on a strong offer.
Risks & watch-outs
- Climate carrying-cost: extreme-heat days projected 7→22/yr by 2055 (HVAC capex compounding) — expect insurance premiums to compound above CPI over the hold.
Questions for the listing agent
- It's been on market 143 days. Have you received any prior offers? Is the seller open to a 17% concession, seller financing, or rate buy-down credit?
- Why hasn't it sold? Are there any deal-killer items the seller is aware of (foundation, flood, title, zoning, code violations)?
- Is there a deadline driving the sale (1031 exchange, divorce, estate, relocation)? That informs how much negotiation room exists.
- What's the average days-on-market for RENTAL listings here right now (not sales)? A rising rental-DOM trend means longer vacancies and softer asking-rent achievability than the comps imply.
- What's the recent tenant-quality profile in this submarket — average credit score on applications, eviction rate, late-payment / NSF rate, and stable-employment percentage? A property-management company in the area should have these aggregated.
- How much new for-sale + rental construction is in the pipeline within 1–3 miles? Heavy new supply typically softens prices + rents 12–24 months out; constrained supply supports both.
Investment metrics
- 1% rule
- 0.83% ✗
- Cap rate
- 6.64%
- Cash-on-cash
- 1.23%
- DSCR
- 1.05
- GRM
- 10.0
CMA / ARV
No comps found within radius.
Projected returns pro-forma
10.0% appreciation · 3.0% rent growth · sell at horizon
- IRR
- 25.2%
- Equity multiple
- 3.01×
- Total profit
- $154,738
- Equity at exit
- $247,742
- IRR
- 22.2%
- Equity multiple
- 6.86×
- Total profit
- $451,574
- Equity at exit
- $534,265
Cash invested: $77,000 (down + closing). Projections, not guarantees.
Landlord ↔ Tenant lean methodology
- Overall (STATE)
- 83 Strongly Landlord-Friendly
- State Oklahoma
- 83 Strongly Landlord-Friendly · R+20
- County
- — inherits STATE
- City
- — inherits STATE
ZIP-level market 73439
- Home prices YoY
- 12.3%
- Active inventory
- 435
- Price-to-rent
- 10.0×
Monthly cashflow live
- Estimated rent
- $2,287 medium interval (Pro) →
- Mortgage (P&I)
- −$1,442
- Tax from tax record
- −$171 /mo · $2,055/yr
- Insurance
- −$115
- HOA
- −$0
- Vacancy / Maint / Mgmt
- −$480
- Net cashflow
- $79
Break-even live
UW: 25.0% down · 7.5% · 30yr · 1.5% tax · 5.0% vac · 8.0% maint · 8.0% mgmt
Financing live
Cash to close
- Down payment
- $68,750
- Closing costs
- $8,250
- Reserves months
- —
- Total cash needed
- —
Loan-product check · same deal, 3 products live
Conventional
25% down · 7.5% · 30yr
- Down + closing
- —
- Monthly P&I
- —
- Monthly cashflow
- —
- DSCR
- —
- Eligible?
- —
Personal DTI + credit; lowest rate.
DSCR
20% down · 8.5% · 30yr
- Down + closing
- —
- Monthly P&I
- —
- Monthly cashflow
- —
- DSCR
- —
- Eligible?
- —
No personal income docs; deal must DSCR.
Hard money
10% down · 12.0% · 12mo
- Down + closing
- —
- Monthly P&I
- —
- Monthly cashflow
- —
- DSCR
- —
- Eligible?
- —
Short-term bridge; refi at stabilization.
Listing history 34 events
-
2026-06-19days on market $275,000 Active 143 DOM
-
2026-06-18days on market $275,000 Active 142 DOM
-
2026-06-17days on market $275,000 Active 141 DOM
-
2026-06-16days on market $275,000 Active 140 DOM
-
2026-06-15days on market $275,000 Active 139 DOM
-
2026-06-14days on market $275,000 Active 137 DOM
-
2026-06-13days on market $275,000 Active 136 DOM
-
2026-06-10days on market $275,000 Active 134 DOM
-
2026-06-09days on market $275,000 Active 133 DOM
-
2026-06-08days on market $275,000 Active 132 DOM
-
2026-06-07days on market $275,000 Active 131 DOM
-
2026-06-05days on market $275,000 Active 128 DOM
-
2026-06-02days on market $275,000 Active 126 DOM
-
2026-06-01days on market $275,000 Active 125 DOM
-
2026-05-31days on market $275,000 Active 124 DOM
-
2026-05-30days on market $275,000 Active 123 DOM
-
2026-01-25$275,000 Active
-
2025-03-03status Active
-
2024-11-03historical
-
2024-10-01status Pending
-
2024-09-03$299,000 Active
-
2024-08-31historical
-
2024-08-06price $299,000
-
2024-07-01$310,000 Active
-
2024-06-28historical
-
2024-05-31price $310,000
-
2024-05-23status Active
-
2024-05-14status Pending
-
2024-02-22$320,000 Active
-
2022-06-24soldstatus $45,000 Sold
-
2022-06-24soldstatus $45,000
-
2022-05-11status Pending
-
2022-05-02$50,000 Active
-
2007-10-09soldstatus $15,000
ⓘ Source: listings_history table (triggers on properties + properties_extension) + one-shot
backfill from property_details.listing_events for pre-trigger history.
Tax reassessment forecast OK · Resets to sale price
- Current annual tax
- $2,055 · $171/mo
- Projected year-2 tax
- $2,475 · $206/mo
- Expected delta
- +$420/yr (+$35/mo · 20.4%)
ⓘ Screening estimate from a state-policy table — verify with the county assessor before closing.
Climate risk First Street
- Flood 1/10 Low FEMA zone X · 0% chance over 30 yrs
- Wildfire 4/10 Moderate
- Heat 6/10 Major 7 d/yr ≥109°F today · 22 d/yr by 30 yrs out
- Wind 4/10 Moderate 18% chance of damaging wind over 30 yrs
- Air quality 3/10 Moderate 2 unhealthy d/yr today · 3 by 30 yrs out
Nearby sold comps map
Loading sold comps map…
Walkable amenities ~0.75 mi
Loading nearby amenities…
Taxation est. · year 1
- Rental income
- $27,449
- − Mortgage interest
- −$15,404
- − Property taxes
- −$2,055
- − Insurance
- −$1,375
- − Repairs & maintenance
- −$2,196
- − Management
- −$2,196
- − Depreciation
- −$8,000
- Taxable loss
- −$3,777
- Est. tax savings @ 24.0%
- +$907
- After-tax cash flow
- $1,856/yr
For passive investors: Depreciation is non-cash, so a rental often shows a tax loss while cash-flowing — sheltering income. Rental losses are passive: they offset passive income freely, and up to $25,000/yr can offset ordinary (W-2) income if you actively participate and your MAGI is under $100k (phasing out to $0 by $150k); unused losses carry forward. On sale, claimed depreciation is recaptured at up to 25%, and gains may owe capital-gains tax (a 1031 exchange can defer both). Figures are a year-1 estimate at your 24.0% rate — not tax advice; consult a CPA.
Schools (NCES district)
- District
- Kingston
- NCES district ID
- 4016590
- Math proficiency
- 27% ▼ -7.00%
- Reading proficiency
- 32% ▼ -7.00%
- Median HH income
- $40,655
- Composite
- 24.88/100
- National rank
- #7585
- State rank
- #70 of 270 in OK
Livability — McBride
No livability data for this city. (Only ~50 U.S. cities are tracked.)
Census & demographics
- Population (ZIP)
- 7,011
Population outlook (Marshall County) Hauer SSP2
- Today (2025)
- 17,405 people
- By 2030
- 18,038 · +3.6%
- By 2040
- 19,513 · +12.1%
- By 2050
- 21,283 · +22.3%
- By 2075
- 27,884 · +60.2%
- By 2100
- 35,435 · +103.6%
Race, ethnicity, and origin ACS 2023
- Neighborhood character
- Predominantly White (75%)
- Race & ethnicity
- White 75% Two or more races 16% Native American 5% Hispanic / Latino 4%
- Common ancestry
- Lithuanian 3% Italian 2% Serbian 1%
- Foreign-born
- 1% · Canada
- Languages at home
- 97% English-only · Spanish 3%
Political lean MEDSL · Marshall
- 2024 margin
- Solid R (+63.4) · D 17.7% · R 81.2% · Other 1.1%
- 2008→2024 swing
- -24.6pp toward R · 2008: -38.8pp · 2024: -63.4pp
- All cycles
- 2024: R+63.4 2020: R+62.5 2016: R+56.6 2012: R+45.7 2008: R+38.8
Not yet ingested
- Civics
- —
Market trends
- HPI YoY
- ▲ 26.96%
- Current HPI
- 246.2253
- Rent YoY
- —
- Metro
- —
- State GDP YoY
- ▲ 1.55%
- F500 in state
- 6
Industry mix (Fortune 500 HQ in OK)
| Industry | F500 HQs | Revenue |
|---|---|---|
| Energy | 3 | $48B |
|
||
Price history
+1733.3% since first listed18 events — show timeline
- 2026-01-25 Listed $275,000 MLS Technology, Inc.
- 2025-03-03 Relisted — MLS Technology, Inc.
- 2024-11-03 Listing Removed — MLS Technology, Inc.
- 2024-10-01 Pending — MLS Technology, Inc.
- 2024-09-03 Listed $299,000 MLS Technology, Inc.
- 2024-08-31 Listing Removed — MLS Technology, Inc.
- 2024-08-06 Price Changed $299,000 MLS Technology, Inc.
- 2024-07-01 Listed $310,000 MLS Technology, Inc.
- 2024-06-28 Listing Removed — MLS Technology, Inc.
- 2024-05-31 Price Changed $310,000 MLS Technology, Inc.
- 2024-05-23 Relisted — MLS Technology, Inc.
- 2024-05-14 Pending — MLS Technology, Inc.
- 2024-02-22 Listed $320,000 MLS Technology, Inc.
- 2022-06-24 Sold (Public Records) $45,000 Public Records
- 2022-06-24 Sold (MLS) $45,000 MLSOK
- 2022-05-11 Pending — MLSOK
- 2022-05-02 Listed $50,000 MLSOK
- 2007-10-09 Sold (Public Records) $15,000 Public Records
Property tax history
+26.3%/yrLatest (2025): $2,055 · +6.0% YoY. Source: county tax records.
Cash-flow waterfall
monthlySold comps — $/sqft
last 12 mo · ≤1 miLoading sold comps…