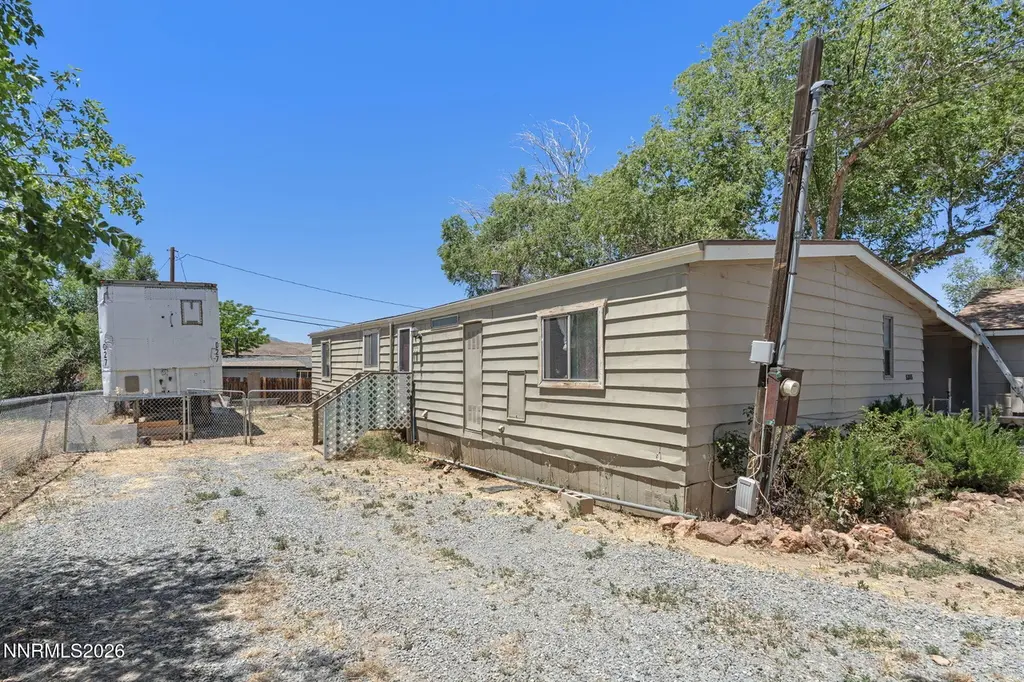
5385 Madeiros Dr · Sun Valley, NV
Flood risk 1/10 · Minimal
- FEMA flood zone
- X (unshaded)
- Chance of flooding over 30 yrs
- 0.0%
- Est. flood insurance / yr
- $507 – $1,088
Fire risk 7/10 · Major
- Est. fire insurance / yr
- $490 – $910
Heat risk 4/10 · Minor
- Hot days now (above 94°F)
- 6 days/yr
- Hot days in 30 yrs
- 14 days/yr
Wind risk 1/10 · Minimal
- Chance of severe wind over 30 yrs
- —
Air-quality risk 8/10 · Major
- Unhealthy air days now
- 15 days/yr
- Unhealthy air days in 30 yrs
- 17 days/yr
Risk factors via First Street. Map © Google.
Why this score? — see what drove the D grade
The composite is a weighted blend of 9 inputs, each scored 0–100. Each bar is that input's sub-score; the figure is the points it added to the 100-point composite (weight × sub-score).
- Cash flow +10.4/30.0
- ARV discount +9.9/15.0
- Appreciation +5.4/10.0
- Schools +3.2/10.0
- 1% rule +3.1/10.0
- Livability +3.1/5.0
- DSCR +3.0/10.0
- Rent growth +2.5/5.0
- Condition / age +2.5/5.0
$329,000
🖨 Deal sheet 📄 Offer letter ✓ Due diligence
Listing remarks MLS
STUNNING AND IMMACULATE Sun Valley home! Charming country location just minutes from Reno! No HOA! 1/3 acre lot w/ potential! Plenty of room for RV and toys! Detached 4 car/shop! New roof for years of protection! Fresh designer 2tone int/ext paint schemes! Bake some fresh cookies in this dream kitchen! Open and spacious living areas w/ plush new carpeting and pad! Grand master suite w/ heavenly master bath retreat! Laundry room! No shortage of yard for entertaining!
Key facts
- Rv parking
- Laundry room
- One-third acre lot
Tags
Property features AI
Finance
- Other: Publicly maintained road frontage; Zoning: MDS
- HOA & community: Located in the Sun Valley 6 subdivision; Not a senior community
Exterior
- Parking: Detached garage with 4 parking spaces; RV access/parking; Garage man door
- Utilities: Public water; Public sewer; Electricity available; Natural gas available; Cable available; Internet available
- Home design: Manufactured home (double wide); One story
- Construction: Frame construction with wood siding; Composition shingle roof; Pillar/post/pier foundation; Built as a double wide mobile/manufactured home
- Exterior features: Deck; Partial fencing; Level lot; Mountain views
Interior
- Kitchen: Gas cooktop; Microwave; Disposal; Refrigerator
- Flooring: Carpet; Vinyl
- Bathrooms: 2 full bathrooms
- Heating & cooling: Electric cooling; Electric and natural gas heating
- Interior features: Breakfast bar; Primary bedroom on the main floor; Double-pane windows with vinyl frames
- Laundry & utility: Washer and dryer included; Laundry area with cabinets
Neighborhood map
What this means for you Summary
Snapshot
- This is a 3-bed/2.0-bath manufactured listed at $329k.
Deal economics
- At list price, monthly cash flow is $-174 ($-2k/yr) — negative.
- To cash-flow at today's rent, offer at most $304k (7.6% below list).
- To meet the 1% rule (rent ≥ 1% of price), the offer needs to be $266k (19.2% below list).
- Recommended offer: $266k (19.2% below list) — sets the bar for 1% rule.
- Cap rate 5.7% vs local median 3.7% in Sun Valley — top-decile yield for the area; either an underpriced asset or a hidden risk that comps aren't pricing in. Stress-test before assuming the spread holds.
Location & tenants
- Location reads 61/100 on livability (#72 in NV) — a middle-class / working-renter tenant base. Strengths: cost of living A+, housing A+; Watch: crime F, amenities F, commute F.
- Washoe County School District (urban): math 30% / reading 44% proficiency, ranked #6 of 17 in NV (top 35%) — families likely to look elsewhere, expect single-tenant / working-renter base with shorter leases.
- Zoned schools: Sun Valley Elementary (math 13% / reading 17%, grade F, #338 of 402 statewide, top 85%, 502 students, 100% FRL); Desert Skies Middle School (math 10% / reading 22%, grade F, #92 of 109 statewide, top 84%, 978 students, 100% FRL); Procter R. Hug High School (math 11% / reading 18%, grade F, #114 of 131 statewide, top 88%, 2,331 students, 100% FRL) — zoned schools average 100% FRL vs 42% district-wide (58 pts higher); higher-poverty schools than district average — tighter screening recommended.
- Zoned-school proficiency averages 15% at this address vs 37% district-wide (-22 pts) — the specific schools serving this property underperform the Washoe County School District average; the district grade overstates school quality for this exact location.
- Market conditions: 47 active listings in the ZIP; 15 comparable units currently listed for rent nearby; rentals at typical pace (median 24d on market — plan ~3-4 weeks tenant-placement turnaround); 4,085 units permitted in Washoe County in 2024 (1,634 in 5+ unit buildings).
Forward outlook
- In year one you build about $5k of equity ($2k loan paydown + $3k appreciation (0.8% local appreciation)).
- Washoe County population projected at +19% by 2050 — long-run rental-demand tailwind backs the buy-and-hold thesis.
- By year 7, paydown + projected appreciation supports a ~$35k cash-out refi (75% LTV) — recoverable capital for the next deal without selling this one.
Negotiation context
- Only 6 days on market — expect competitive offers; lowballing is unlikely to land.
- 5 sale attempts since 22y ago with the ask held roughly flat each time — persistent listings suggest the price (not the market) is what's stuck; bring a comps-based counter.
- Current owner paid $135k; list at $329k implies a 144% gain — meaningful room to come down on a strong offer.
Risks & watch-outs
- Climate carrying-cost: major wildfire risk — expect insurance premiums to compound above CPI over the hold.
Questions for the listing agent
- What do current leases actually rent for vs. the listed asking? Can we see a recent rent roll and the last 12 months of T-12 income?
- Built in 1979 — when were the roof, HVAC, electrical panel, plumbing, and water heater last replaced?
- Is there a deadline driving the sale (1031 exchange, divorce, estate, relocation)? That informs how much negotiation room exists.
- Schools are F-rated, which usually means shorter tenancies and higher turnover. Who's the typical renter profile here, and what's been the actual vacancy rate?
- Crime grade is F in this area — have there been break-ins, vandalism, or insurance claims at this property in the last 3 years? What carrier currently insures it and at what premium?
- The area grade is low — what's the realistic commute time and amenity access for the typical tenant pool here? Any planned neighborhood developments (good or bad) we should know about?
- What's the average days-on-market for RENTAL listings here right now (not sales)? A rising rental-DOM trend means longer vacancies and softer asking-rent achievability than the comps imply.
- What's the recent tenant-quality profile in this submarket — average credit score on applications, eviction rate, late-payment / NSF rate, and stable-employment percentage? A property-management company in the area should have these aggregated.
- How much new for-sale + rental construction is in the pipeline within 1–3 miles? Heavy new supply typically softens prices + rents 12–24 months out; constrained supply supports both.
Investment metrics
- 1% rule
- 0.81% ✗
- Cap rate
- 5.66%
- Cash-on-cash
- -2.26%
- DSCR
- 0.90
- GRM
- 10.3
CMA / ARV
- ARV (on-the-fly)
- $347,490
- Comps found
- 12
Show comp detail 12 sales within ~0.75 mi
| Address | Dist | Beds/Ba | Sqft | Sold | Price | $/sf | Match |
|---|---|---|---|---|---|---|---|
| 5377 Corral Dr | 0.29mi | 3/2.0 | 1,326 (-7%) | 2mo | $390,000 | $294 | 73 |
| 5275 Lupin Dr | 0.33mi | 3/2.0 | 1,584 (+11%) | 9mo | $398,000 | $251 | 60 |
| 565 E 1st | 0.66mi | 3/2.0 | 1,440 (+1%) | 12mo | $380,000 | $264 | 59 |
| 520 Wall Canyon Dr | 0.55mi | 3/2.0 | 1,344 (-6%) | 7mo | $355,000 | $264 | 58 |
| 347 Short Ave | 0.34mi | 3/2.0 | 1,218 (-15%) | 2mo | $202,500 | $166 | 57 |
| 380 E 6th Ave | 0.53mi | 3/2.0 | 1,536 (+7%) | 8mo | $392,000 | $255 | 56 |
| 625 Summerhill Dr | 0.55mi | 2/2.0 (-1) | 1,344 (-6%) | 6mo | $285,000 | $212 | 54 |
| 540 Wall Canyon Dr | 0.52mi | 3/2.0 | 1,296 (-9%) | 8mo | $315,000 | $243 | 54 |
| 5595 Yukon Dr | 0.53mi | 3/2.0 | 1,620 (+13%) | 4mo | $265,000 | $164 | 50 |
| 5610 Charjene Way | 0.74mi | 3/2.0 | 1,551 (+8%) | 6mo | $375,000 | $242 | 47 |
| 5665 Winward | 0.71mi | 2/2.0 (-1) | 1,248 (-13%) | 11mo | $299,000 | $240 | 31 |
| 5645 Klondike Dr | 0.70mi | 4/3.0 (+1) | 1,620 (+13%) | 11mo | $380,000 | $235 | 27 |
Match score weights: distance 35% · size 25% · config 20% · recency 20%. Top-matched comps best support the ARV.
Projected returns pro-forma
0.81% appreciation · 3.0% rent growth · sell at horizon
- IRR
- -1.7%
- Equity multiple
- 0.91×
- Total profit
- $-7,875
- Equity at exit
- $109,118
- IRR
- 3.4%
- Equity multiple
- 1.40×
- Total profit
- $37,171
- Equity at exit
- $142,567
Cash invested: $92,120 (down + closing). Projections, not guarantees.
Landlord ↔ Tenant lean methodology
- Overall (STATE)
- 71 Landlord-Friendly
- State Nevada
- 71 Landlord-Friendly · R+1
- County
- — inherits STATE
- City
- — inherits STATE
ZIP-level market 89433
- Home prices YoY
- 0.3%
- Active inventory
- 47
- Price-to-rent
- 10.3×
Monthly cashflow live
- Estimated rent
- $2,658 high interval (Pro) →
- Mortgage (P&I)
- −$1,725
- Tax est. 1.5%
- −$411 /mo · $4,935/yr
- Insurance
- −$137
- HOA
- −$0
- Vacancy / Maint / Mgmt
- −$558
- Net cashflow
- $-174
Break-even live
UW: 25.0% down · 7.5% · 30yr · 1.5% tax · 5.0% vac · 8.0% maint · 8.0% mgmt
Financing live
Cash to close
- Down payment
- $82,250
- Closing costs
- $9,870
- Reserves months
- —
- Total cash needed
- —
Loan-product check · same deal, 3 products live
Conventional
25% down · 7.5% · 30yr
- Down + closing
- —
- Monthly P&I
- —
- Monthly cashflow
- —
- DSCR
- —
- Eligible?
- —
Personal DTI + credit; lowest rate.
DSCR
20% down · 8.5% · 30yr
- Down + closing
- —
- Monthly P&I
- —
- Monthly cashflow
- —
- DSCR
- —
- Eligible?
- —
No personal income docs; deal must DSCR.
Hard money
10% down · 12.0% · 12mo
- Down + closing
- —
- Monthly P&I
- —
- Monthly cashflow
- —
- DSCR
- —
- Eligible?
- —
Short-term bridge; refi at stabilization.
Rent comps 15 comps
| Address | Beds | Baths | Sqft | Rent | $/sqft | DOM | Units | Dist |
|---|---|---|---|---|---|---|---|---|
| 431 Leland Dr Sun Valley, NV | 3.0 | 2.0 | 1344 | $2,700 | $2.01 | 13d | 1 | 0.10mi |
| 425 Leland Dr Sun Valley, NV | 3.0 | 2.0 | 1344 | $2,700 | $2.01 | 13d | 1 | 0.11mi |
| 419 Leland Dr Sun Valley, NV | 3.0 | 2.0 | 1344 | $2,700 | $2.01 | 23d | 1 | 0.11mi |
| 5363 Crest Cove Dr Sun Valley, NV | 3.0 | 2.0 | 1344 | $2,700 | $2.01 | 23d | 1 | 0.15mi |
| 5363 Crest Cove Dr Sun Valley, NV | 3.0 | 2.0 | 1344 | $2,700 | $2.01 | 43d | 1 | 0.15mi |
| 5377 Camino Carlos Dr Sun Valley, NV | 3.0 | 2.0 | 1344 | $2,700 | $2.01 | 23d | 1 | 0.16mi |
| 5370 Beverly Lake Dr Sun Valley, NV | 3.0 | 2.0 | 1344 | $2,700 | $2.01 | 13d | 1 | 0.17mi |
| 5366 Beverly Lake Dr Sun Valley, NV | 3.0 | 2.0 | 1344 | $2,700 | $2.01 | 13d | 1 | 0.17mi |
| 5373 Camino Carlos Dr Sun Valley, NV | 3.0 | 2.0 | 1344 | $2,700 | $2.01 | 43d | 1 | 0.17mi |
| 5362 Beverly Lake Dr Sun Valley, NV | 3.0 | 2.0 | 1344 | $2,700 | $2.01 | 23d | 1 | 0.18mi |
| 5359 Beverly Lake Dr Sun Valley, NV | 3.0 | 2.0 | 1344 | $2,700 | $2.01 | 43d | 1 | 0.20mi |
| 5360 Corral Dr Sun Valley, NV | 3.0 | 2.0 | 1200 | $1,900 | $1.58 | 13d | 1 | 0.32mi |
| 5100 W 1st Ave Sun Valley, NV | 1.0–3.0 | 1.0–2.0 | 836 | $1,431 | $1.71 | 23d | 1 | 1.08mi |
| 4903 Black Falcon Way Sun Valley, NV | 3.0 | 2.5 | 1774 | $2,600 | $1.47 | 43d | 1 | 1.43mi |
| 4400 El Rancho Dr Sun Valley, NV | 1.0–2.0 | 1.0–2.0 | 740 | $1,859 | $2.51 | 13d | 9 | 1.45mi |
Listing history 6 events
-
2026-06-18days on market $329,000 Active 6 DOM
-
2026-06-17days on market $329,000 Active 5 DOM
-
2026-06-16days on market $329,000 Active 4 DOM
-
2026-06-15days on market $329,000 Active 3 DOM
-
2026-06-14remarks 699-char remark
-
2026-06-14$329,000 Active 1 DOM
ⓘ Source: listings_history table (triggers on properties + properties_extension) + one-shot
backfill from property_details.listing_events for pre-trigger history.
Climate risk First Street
- Flood 1/10 Low FEMA zone X (unshaded) · 0% chance over 30 yrs
- Wildfire 7/10 Severe
- Heat 4/10 Moderate 6 d/yr ≥94°F today · 14 d/yr by 30 yrs out
- Wind 1/10 Low
- Air quality 8/10 Severe 15 unhealthy d/yr today · 17 by 30 yrs out
Nearby sold comps map
Loading sold comps map…
Walkable amenities ~0.75 mi
Loading nearby amenities…
Taxation est. · year 1
- Rental income
- $31,898
- − Mortgage interest
- −$18,429
- − Property taxes
- −$4,935
- − Insurance
- −$1,645
- − Repairs & maintenance
- −$2,552
- − Management
- −$2,552
- − Depreciation
- −$9,571
- Taxable loss
- −$7,786
- Est. tax savings @ 24.0%
- +$1,869
- After-tax cash flow
- $-216/yr
For passive investors: Depreciation is non-cash, so a rental often shows a tax loss while cash-flowing — sheltering income. Rental losses are passive: they offset passive income freely, and up to $25,000/yr can offset ordinary (W-2) income if you actively participate and your MAGI is under $100k (phasing out to $0 by $150k); unused losses carry forward. On sale, claimed depreciation is recaptured at up to 25%, and gains may owe capital-gains tax (a 1031 exchange can defer both). Figures are a year-1 estimate at your 24.0% rate — not tax advice; consult a CPA.
Schools (NCES district)
- District
- Washoe County School District
- NCES district ID
- 3200480
- Math proficiency
- 30% ▼ -9.00%
- Reading proficiency
- 44% ▼ -4.00%
- Median HH income
- $55,025
- Composite
- 32.44/100
- National rank
- #5721
- State rank
- #6 of 17 in NV
Livability — Sun Valley
- Score
- 61/100
- State rank
- #72
- US rank
- #17949
Category grades
Schools grade is shown separately in the Schools card above.
Census & demographics
- Census place
- Sun Valley, NV
- City population
- 23,385
- Population (ZIP)
- 23,385
Population outlook (Washoe County) Hauer SSP2
- Today (2025)
- 499,260 people
- By 2030
- 523,429 · +4.8%
- By 2040
- 564,420 · +13.1%
- By 2050
- 595,548 · +19.3%
- By 2075
- 652,375 · +30.7%
- By 2100
- 661,518 · +32.5%
Race, ethnicity, and origin ACS 2023
- Neighborhood character
- Diverse neighborhood (Simpson 0.56)
- Race & ethnicity
- Hispanic / Latino 53% White 39% Two or more races 16% Native American 3% Asian 1% Black 1%
- Hispanic origin (detail)
- Mexican 46%
- Common ancestry
- Russian 2% Lithuanian 1% Romanian 1%
- Foreign-born
- 20% · Canada
- Languages at home
- 64% English-only · Spanish 34% Other Indo-European 1%
Political lean MEDSL · Washoe
- 2024 margin
- Toss-up / Even · D 49.3% · R 48.3% · Other 2.4%
- 2008→2024 swing
- -11.7pp toward R · 2008: 12.7pp · 2024: 1.0pp
- All cycles
- 2024: D+1.0 2020: D+4.5 2016: D+1.2 2012: D+3.6 2008: D+12.7
Not yet ingested
- Civics
- —
Market trends
- HPI YoY
- ▲ 0.81%
- Current HPI
- 310.5538
- Rent YoY
- —
- Metro
- —
- State GDP YoY
- ▲ 3.08%
- F500 in state
- 6
Industry mix (Fortune 500 HQ in NV)
| Industry | F500 HQs | Revenue |
|---|---|---|
| Hotels / Casinos | 3 | $36B |
|
||
Price history
+948.3% since first listed18 events — show timeline
- 2026-06-12 Listed $329,000 NNRMLS
- 2015-04-14 Sold (Public Records) $135,000 Public Records
- 2015-04-14 Sold (MLS) $134,900 NNRMLS
- 2015-02-04 Pending — NNRMLS
- 2015-01-24 Price Changed $134,900 NNRMLS
- 2015-01-08 Price Changed $137,900 NNRMLS
- 2014-12-11 Price Changed $139,900 NNRMLS
- 2014-11-25 Listed $144,900 NNRMLS
- 2012-10-17 Listing Removed — NNRMLS
- 2012-10-16 Listed $39,500 NNRMLS
- 2005-03-24 Sold (Public Records) $173,500 Public Records
- 2005-03-03 Listing Removed — NNRMLS
- 2004-12-08 Listed $174,500 NNRMLS
- 2004-07-30 Listing Removed — NNRMLS
- 2004-05-14 Listed $100,800 NNRMLS
- 2002-10-30 Sold (Public Records) $110,000 Public Records
- 1986-10-01 Sold (Public Records) $34,000 Public Records
- 1986-10-01 Sold (Public Records) $31,385 Public Records
Property tax history
-35.5%/yrLatest (2025): $4 · -24.8% YoY. Source: county tax records.
Cash-flow waterfall
monthlySold comps — $/sqft
last 12 mo · ≤1 miLoading sold comps…