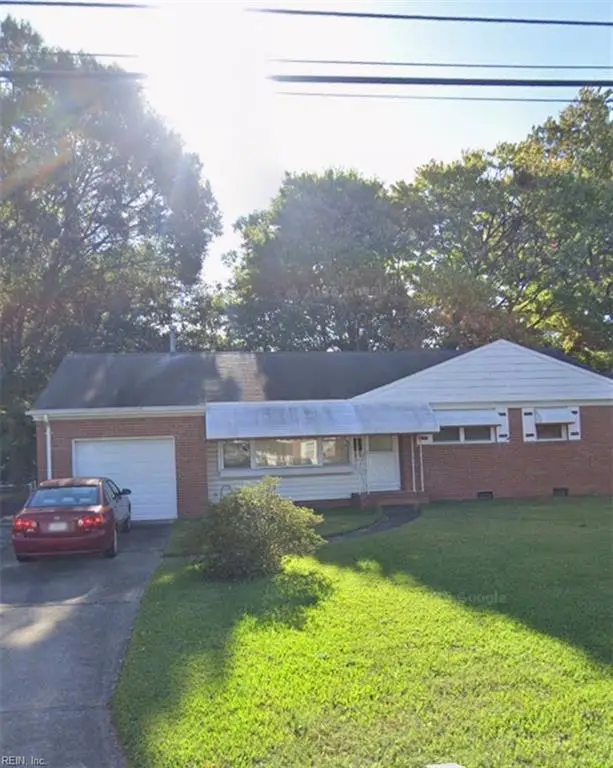
8116 Mona Ave · Norfolk, VA
Flood risk 5/10 · Moderate
- FEMA flood zone
- X (unshaded)
- Chance of flooding over 30 yrs
- 0.51%
- Est. flood insurance / yr
- $507 – $1,088
Fire risk 1/10 · Minimal
- Est. fire insurance / yr
- $666 – $1,236
Heat risk 9/10 · Severe
- Hot days now (above 104°F)
- 7 days/yr
- Hot days in 30 yrs
- 16 days/yr
Wind risk 8/10 · Major
- Chance of severe wind over 30 yrs
- 80.0%
Air-quality risk 3/10 · Minor
- Unhealthy air days now
- 2 days/yr
- Unhealthy air days in 30 yrs
- 3 days/yr
Risk factors via First Street. Map © Google.
Why this score? — see what drove the C+ grade
The composite is a weighted blend of 9 inputs, each scored 0–100. Each bar is that input's sub-score; the figure is the points it added to the 100-point composite (weight × sub-score).
- Cash flow +21.4/30.0
- ARV discount +15.0/15.0
- DSCR +6.8/10.0
- 1% rule +4.3/10.0
- Livability +4.2/5.0
- Schools +3.5/10.0
- Rent growth +3.3/5.0
- Condition / age +2.5/5.0
- Appreciation +0.0/10.0
$225,000
🖨 Deal sheet 📄 Offer letter ✓ Due diligence
Listing remarks
This nice brick ranch starter home has a CLEAR crawl termite and Moisture letter and a NEW Roof! Don't hesitate to see this one before it's gone. Sells strictly AS-IS. Seller will do NO repairs. W/ D as is, washer is 3 years old. dryer, age unknown. all appliances as is. Water heater 3 years old. Gas Furnace, 3-5 years old. Some Hardwood Floors. NO VA or FHA loans. Conventional or Cash only.
Key facts
- Gas furnace
- New roof
- Hardwood floors
Tags
Property features AI
Finance
- Other: Neighborhood: ROOSEVELT GARDENS
- HOA & community: No HOA fees
Exterior
- Parking: Attached 1-car garage; Driveway parking; Street parking; Garage approximately 392 sq. ft.
- Utilities: City/County water; City/County sewer; Gas water heater
- Home design: Detached ranch; Single-story
- Construction: Crawl foundation; Asphalt shingle roof
- Exterior features: Brick siding; Partial chain-link fence
Interior
- Kitchen: Gas range; Refrigerator
- Bedrooms: First-floor master bedroom; Bedroom and full bathroom on first floor; No bedrooms with ensuite
- Flooring: Carpet; Vinyl; Wood
- Bathrooms: One full bathroom
- Heating & cooling: Natural gas heating; Central air conditioning
- Interior features: Carpet, vinyl, and wood flooring; Attic
- Laundry & utility: Washer and dryer; Washer and dryer hookups
Neighborhood map
What this means for you Summary
Snapshot
- This is a 3-bed/1.0-bath single-family listed at $225k.
Deal economics
- At list price, monthly cash flow is $334 ($4k/yr) — positive.
- The deal already cash-flows at list — no discount required.
- To meet the 1% rule (rent ≥ 1% of price), the offer needs to be $209k (7.0% below list).
- Recommended offer: $209k (7.0% below list) — sets the bar for 1% rule.
- Cap rate 8.1% vs local median 4.0% in Norfolk — top-decile yield for the area; either an underpriced asset or a hidden risk that comps aren't pricing in. Stress-test before assuming the spread holds.
Location & tenants
- Location reads 83/100 on livability (#43 in VA, #1,026 nationally) — a professional / high-income tenant draw. Strengths: amenities A+, commute A+, health & safety A+; Watch: employment C-, crime F.
- Norfolk City Public School District (urban): math 27% / reading 56% proficiency, ranked #118 of 131 in VA (top 90%) — families likely to look elsewhere, expect single-tenant / working-renter base with shorter leases.
- Zoned schools: Little Creek Elementary (math 20% / reading 49%, grade F, #966 of 1,108 statewide, top 89%, 631 students, 97% FRL); Lake Taylor High (math 38% / reading 72%, grade C, #279 of 319 statewide, top 88%, 1,030 students, 92% FRL) — zoned schools average 95% FRL vs 59% district-wide (36 pts higher); higher-poverty schools than district average — tighter screening recommended.
- Market conditions: Rents rising (+3.1%/yr); 206 active listings in the ZIP; 40 comparable units currently listed for rent nearby; rentals at typical pace (median 24d on market — plan ~3-4 weeks tenant-placement turnaround); 42% of comp listings sitting > 30 days — soft ceiling on asking rent; solid renter incomes; 438 units permitted in Norfolk city in 2024 (273 in 5+ unit buildings).
- This rent runs 32% of the median local income ($78k/yr) — at the standard rent-burdened threshold; future hikes will face affordability resistance.
Forward outlook
- Local home prices are declining (-3.0%/yr); year-one equity from $2k of loan paydown is wiped out by about $7k of value loss. Plan a longer hold.
Negotiation context
- Only 2 days on market — expect competitive offers; lowballing is unlikely to land.
Risks & watch-outs
- Watch-outs: built in 1954 — expect roof / HVAC / electrical / plumbing capex.
- Climate carrying-cost: moderate flood risk; severe wind risk, 80% chance of damaging wind over 30y; extreme-heat days projected 7→16/yr by 2055 (HVAC capex compounding) — expect insurance premiums to compound above CPI over the hold.
Questions for the listing agent
- Built in 1954 — when were the roof, HVAC, electrical panel, plumbing, and water heater last replaced?
- Is there a deadline driving the sale (1031 exchange, divorce, estate, relocation)? That informs how much negotiation room exists.
- Schools are A-rated — typically a magnet for longer-tenancy family renters. What's the average tenant stay here, and is there a school-zone premium baked into asking?
- Crime grade is F in this area — have there been break-ins, vandalism, or insurance claims at this property in the last 3 years? What carrier currently insures it and at what premium?
- What's the average days-on-market for RENTAL listings here right now (not sales)? A rising rental-DOM trend means longer vacancies and softer asking-rent achievability than the comps imply.
- What's the recent tenant-quality profile in this submarket — average credit score on applications, eviction rate, late-payment / NSF rate, and stable-employment percentage? A property-management company in the area should have these aggregated.
- How much new for-sale + rental construction is in the pipeline within 1–3 miles? Heavy new supply typically softens prices + rents 12–24 months out; constrained supply supports both.
Investment metrics
- 1% rule
- 0.93% ✗
- Cap rate
- 8.07%
- Cash-on-cash
- 6.36%
- DSCR
- 1.28
- GRM
- 9.0
CMA / ARV
- ARV (on-the-fly)
- $294,840
- Comps found
- 12
Show comp detail 12 sales within ~0.75 mi
| Address | Dist | Beds/Ba | Sqft | Sold | Price | $/sf | Match |
|---|---|---|---|---|---|---|---|
| 8116 Mona Ave | 0.00mi | 3/1.0 | 1,080 (0%) | 0mo | $210,000 | $194 | 100 |
| 8237 Nathan Ave | 0.23mi | 3/1.0 | 1,073 (-1%) | 0mo | $301,000 | $281 | 88 |
| 8441 Nathan Ave | 0.45mi | 3/1.0 | 1,073 (-1%) | 0mo | $260,000 | $242 | 77 |
| 8412 Norristown Dr | 0.41mi | 3/1.0 | 1,073 (-1%) | 4mo | $295,000 | $275 | 77 |
| 8329 Mona Ave | 0.29mi | 3/1.0 | 1,197 (+11%) | 0mo | $299,900 | $251 | 68 |
| 2209 Dean Dr | 0.34mi | 2/1.0 (-1) | 1,001 (-7%) | 7mo | $260,000 | $260 | 61 |
| 2913 David Ave | 0.48mi | 3/2.0 | 1,151 (+7%) | 3mo | $307,300 | $267 | 60 |
| 2332 Wharton Ct | 0.69mi | 3/2.0 | 1,105 (+2%) | 3mo | $302,000 | $273 | 57 |
| 1842 Springwood St | 0.48mi | 3/1.0 | 936 (-13%) | 0mo | $260,000 | $278 | 55 |
| 2129 Mervis St | 0.74mi | 3/1.0 | 1,165 (+8%) | 4mo | $273,000 | $234 | 49 |
| 2775 E Little Creek Rd | 0.49mi | 3/2.5 | 1,210 (+12%) | 4mo | $345,000 | $285 | 48 |
| 1815 Lightwood Ln | 0.55mi | 4/2.0 (+1) | 1,200 (+11%) | 2mo | $365,000 | $304 | 45 |
Match score weights: distance 35% · size 25% · config 20% · recency 20%. Top-matched comps best support the ARV.
Projected returns pro-forma
-3.0% appreciation · 3.07% rent growth · sell at horizon
- IRR
- -6.5%
- Equity multiple
- 0.76×
- Total profit
- $-15,153
- Equity at exit
- $33,548
- IRR
- 3.2%
- Equity multiple
- 1.23×
- Total profit
- $14,341
- Equity at exit
- $19,454
Cash invested: $63,000 (down + closing). Projections, not guarantees.
Landlord ↔ Tenant lean methodology
- Overall (STATE)
- 55 Moderately Landlord-Leaning
- State Virginia
- 55 Moderately Landlord-Leaning · D+2
- County
- — inherits STATE
- City
- — inherits STATE
ZIP-level market 23518
- Home prices YoY
- -16.9%
- Rents YoY
- 3.1%
- Active inventory
- 206
- Price-to-rent
- 9.0×
Monthly cashflow live
- Estimated rent
- $2,092 high interval (Pro) →
- Mortgage (P&I)
- −$1,180
- Tax from tax record
- −$45 /mo · $543/yr
- Insurance
- −$94
- HOA
- −$0
- Vacancy / Maint / Mgmt
- −$439
- Net cashflow
- $334
Break-even live
UW: 25.0% down · 7.5% · 30yr · 1.5% tax · 5.0% vac · 8.0% maint · 8.0% mgmt
Financing live
Cash to close
- Down payment
- $56,250
- Closing costs
- $6,750
- Reserves months
- —
- Total cash needed
- —
Loan-product check · same deal, 3 products live
Conventional
25% down · 7.5% · 30yr
- Down + closing
- —
- Monthly P&I
- —
- Monthly cashflow
- —
- DSCR
- —
- Eligible?
- —
Personal DTI + credit; lowest rate.
DSCR
20% down · 8.5% · 30yr
- Down + closing
- —
- Monthly P&I
- —
- Monthly cashflow
- —
- DSCR
- —
- Eligible?
- —
No personal income docs; deal must DSCR.
Hard money
10% down · 12.0% · 12mo
- Down + closing
- —
- Monthly P&I
- —
- Monthly cashflow
- —
- DSCR
- —
- Eligible?
- —
Short-term bridge; refi at stabilization.
Rent comps 40 comps
| Address | Beds | Baths | Sqft | Rent | $/sqft | DOM | Units | Dist |
|---|---|---|---|---|---|---|---|---|
| 1859 Branchwood St Unit 1492775P Norfolk, VA | 3.0 | 2.0 | 1367 | $3,800 | $2.78 | 14d | 1 | 0.42mi |
| 2217 Helsley Ave Norfolk, VA | 3.0 | 2.0 | 1039 | $2,200 | $2.12 | 3d | 1 | 0.55mi |
| 2204 Helsley Ave Norfolk, VA | 3.0 | 1.0 | 1039 | $2,000 | $1.92 | 44d | 1 | 0.60mi |
| 8516 Halprin Dr Norfolk, VA | 3.0 | 1.0 | 1086 | $2,395 | $2.21 | 7d | 1 | 0.61mi |
| 9544 5th Bay St Unit 6 Norfolk, VA | 2.0 | 1.0 | 750 | $1,650 | $2.20 | 23d | 1 | 0.89mi |
| 8121 Tidal Rd Norfolk, VA | 2.0 | 1.0 | 805 | $1,425 | $1.77 | 43d | 1 | 0.93mi |
| 2111 Pretty Lake Ave Norfolk, VA | 2.0 | 2.0 | 950 | $1,730 | $1.82 | 2d | 1 | 1.00mi |
| 2916 Pleasant Ave Unit 6 Norfolk, VA | 2.0 | 1.0 | 800 | $1,195 | $1.49 | 43d | 1 | 1.00mi |
| 9560 12th Bay St Unit B Norfolk, VA | 2.0 | 1.0 | 800 | $1,225 | $1.53 | 43d | 1 | 1.00mi |
| 9617 11th Bay St Unit 2 Norfolk, VA | 2.0 | 2.0 | 1200 | $1,400 | $1.17 | 43d | 1 | 1.04mi |
| 3857 Flowerfield Rd Norfolk, VA | 1.0–3.0 | 1.0–1.5 | 931 | $1,790 | $1.92 | 2d | 17 | 1.06mi |
| 9563 15th Bay St Unit 4 Norfolk, VA | 3.0 | 2.0 | 1100 | $1,695 | $1.54 | 43d | 1 | 1.08mi |
| 9551 16th Bay St Norfolk, VA | 2.0 | 1.5 | 787 | $1,495 | $1.90 | 43d | 1 | 1.09mi |
| 9628 1st Bay St Norfolk, VA | 2.0 | 1.0 | 750 | $1,500 | $2.00 | 3d | 1 | 1.11mi |
| 4138 Seafarer Ave Norfolk, VA | 2.0 | 2.0 | 1175 | $1,995 | $1.70 | 2d | 1 | 1.11mi |
| 9627 1st Bay St Norfolk, VA | 2.0 | 1.0 | 750 | $1,475 | $1.97 | 43d | 1 | 1.12mi |
| 8021 Ransom Rd Unit A-B Norfolk, VA | 2.0 | 1.0 | 800 | $1,400 | $1.75 | 14d | 1 | 1.12mi |
| 4138 Seafarer Ave Unit 1 Norfolk, VA | 2.0 | 2.0 | 1175 | $1,995 | $1.70 | 3d | 1 | 1.14mi |
| 9608 15th Bay St Norfolk, VA | 2.0 | 1.0 | 800 | $1,600 | $2.00 | 43d | 1 | 1.15mi |
| 3601 Pleasant Ave Norfolk, VA | 2.0 | 1.0 | 750 | $1,562 | $2.08 | 21d | 1 | 1.15mi |
| 9512 18th Bay St Unit B Norfolk, VA | 3.0 | 1.0 | 952 | $2,650 | $2.78 | 43d | 1 | 1.16mi |
| 9714 11th Bay St Unit 1354823P Norfolk, VA | 2.0 | 1.0 | 796 | $2,386 | $3.00 | 19d | 1 | 1.17mi |
| 9714 11th Bay St Unit 1533634P Norfolk, VA | 2.0 | 1.0 | 775 | $2,691 | $3.47 | 3d | 1 | 1.17mi |
| 4217 Dunning Rd Norfolk, VA | 3.0 | 1.0 | 800 | $1,700 | $2.12 | 21d | 1 | 1.19mi |
| 9533 19th Bay St Unit 1 Norfolk, VA | 3.0 | 1.0 | 847 | $1,350 | $1.59 | 43d | 1 | 1.19mi |
| 9559 19th Bay St Norfolk, VA | 2.0 | 1.0 | 744 | $1,595 | $2.14 | 23d | 1 | 1.23mi |
| 3805 Pleasant Ave Unit A Norfolk, VA | 2.0 | 1.0 | 819 | $1,250 | $1.53 | 23d | 1 | 1.24mi |
| 9537 20th Bay St Unit A Norfolk, VA | 2.0 | 1.0 | 725 | $1,400 | $1.93 | 23d | 1 | 1.24mi |
| 2020 E Ocean View Ave Unit 5 Norfolk, VA | 3.0 | 2.0 | 1350 | $2,350 | $1.74 | 43d | 1 | 1.27mi |
| 9322 Grove Ave Norfolk, VA | 3.0 | 2.0 | 1365 | $2,400 | $1.76 | 7d | 1 | 1.29mi |
| 9322 Grove Ave Norfolk, VA | 3.0 | 2.0 | 1365 | $2,400 | $1.76 | 23d | 1 | 1.29mi |
| 4314 Dunning Rd Unit 4 Norfolk, VA | 2.0 | 1.0 | 701 | $1,195 | $1.70 | 23d | 1 | 1.29mi |
| 6419 Grimes Ave Norfolk, VA | 3.0 | 2.0 | 1225 | $2,150 | $1.76 | 43d | 1 | 1.30mi |
| 9607 20th Bay St Unit 5 Norfolk, VA | 2.0 | 1.0 | 750 | $1,595 | $2.13 | 43d | 1 | 1.33mi |
| 1346 Tallwood St Norfolk, VA | 3.0 | 2.0 | 1293 | $2,200 | $1.70 | 4d | 1 | 1.34mi |
| 9617 20th Bay St #22 Norfolk, VA | 2.0 | 1.0 | 750 | $1,395 | $1.86 | 43d | 1 | 1.35mi |
| 6975 Bonnot Dr Norfolk, VA | 3.0 | 1.5 | 1188 | $1,700 | $1.43 | 43d | 1 | 1.35mi |
| 7906 Turner Rd Norfolk, VA | 3.0 | 1.5 | 1400 | $1,925 | $1.38 | 43d | 1 | 1.39mi |
| 9615 21st Bay St Norfolk, VA | 2.0 | 2.5 | 1500 | $2,995 | $2.00 | 7d | 1 | 1.39mi |
| 9631 21st Bay St Norfolk, VA | 2.0 | 2.5 | 1500 | $2,995 | $2.00 | 16d | 1 | 1.41mi |
Listing history 1 events
-
2026-05-26$225,000 Active
ⓘ Source: listings_history table (triggers on properties + properties_extension) + one-shot
backfill from property_details.listing_events for pre-trigger history.
Tax reassessment forecast VA · Resets to sale price
- Current annual tax
- $543 · $45/mo
- Projected year-2 tax
- $1,845 · $154/mo
- Expected delta
- +$1,302/yr (+$109/mo · 240.0%)
ⓘ Screening estimate from a state-policy table — verify with the county assessor before closing.
Climate risk First Street
- Flood 5/10 Major FEMA zone X (unshaded) · 51% chance over 30 yrs
- Wildfire 1/10 Low
- Heat 9/10 Extreme 7 d/yr ≥104°F today · 16 d/yr by 30 yrs out
- Wind 8/10 Severe 80% chance of damaging wind over 30 yrs
- Air quality 3/10 Moderate 2 unhealthy d/yr today · 3 by 30 yrs out
Nearby sold comps map
Loading sold comps map…
Walkable amenities ~0.75 mi
Loading nearby amenities…
Taxation est. · year 1
- Rental income
- $25,107
- − Mortgage interest
- −$12,603
- − Property taxes
- −$543
- − Insurance
- −$1,125
- − Repairs & maintenance
- −$2,009
- − Management
- −$2,009
- − Depreciation
- −$6,545
- Taxable income
- $273
- Est. tax owed @ 24.0%
- −$66
- After-tax cash flow
- $3,942/yr
For passive investors: Depreciation is non-cash, so a rental often shows a tax loss while cash-flowing — sheltering income. Rental losses are passive: they offset passive income freely, and up to $25,000/yr can offset ordinary (W-2) income if you actively participate and your MAGI is under $100k (phasing out to $0 by $150k); unused losses carry forward. On sale, claimed depreciation is recaptured at up to 25%, and gains may owe capital-gains tax (a 1031 exchange can defer both). Figures are a year-1 estimate at your 24.0% rate — not tax advice; consult a CPA.
Schools (NCES district)
- District
- Norfolk City Public School District
- NCES district ID
- 5102670
- Math proficiency
- 27% ▼ -44.00%
- Reading proficiency
- 56% ▼ -10.00%
- Median HH income
- $44,358
- Composite
- 35.08/100
- National rank
- #5026
- State rank
- #118 of 131 in VA
Livability — Norfolk
- Score
- 83/100
- State rank
- #43
- US rank
- #1026
Category grades
Schools grade is shown separately in the Schools card above.
Census & demographics
- Census place
- Norfolk, VA
- County
- Norfolk City · 214,042 people
- City population
- 214,042
- Metro
- Virginia Beach-Norfolk-Newport News, VA-NC
- Population (ZIP)
- 29,746
- Household income
- $77,594
- Rent vs Own
- Severe rent burden
- 1143.0
Population outlook (Norfolk County) Hauer SSP2
- Today (2025)
- 249,032 people
- By 2030
- 252,347 · +1.3%
- By 2040
- 253,644 · +1.9%
- By 2050
- 251,913 · +1.2%
- By 2075
- 245,281 · -1.5%
- By 2100
- 219,548 · -11.8%
Race, ethnicity, and origin ACS 2023
- Neighborhood character
- Diverse neighborhood (Simpson 0.59)
- Race & ethnicity
- White 60% Black 21% Hispanic / Latino 9% Two or more races 9% Asian 5%
- Hispanic origin (detail)
- Mexican 3% Puerto Rican 1%
- Common ancestry
- Italian 3% Romanian 3% Slovak 2%
- Foreign-born
- 9% · Canada, South Korea, Vietnam
- Languages at home
- 88% English-only · Spanish 6% Tagalog/Filipino 2% Other Indo-European 1%
Political lean MEDSL · Norfolk
- 2024 margin
- Solid D (+41.5) · D 70.0% · R 28.5% · Other 1.6%
- 2008→2024 swing
- -1.4pp toward R · 2008: 43.0pp · 2024: 41.5pp
- All cycles
- 2024: D+41.5 2020: D+45.6 2016: D+42.0 2012: D+44.0 2008: D+43.0
Not yet ingested
- Civics
- —
Market trends
- HPI YoY
- ▼ -60.26%
- Current HPI
- 296.2161
- Rent YoY
- ▲ 3.07%
- Metro
- Virginia Beach-Norfolk-Newport News, VA-NC
- State GDP YoY
- ▲ 2.40%
- F500 in state
- 50
Industry mix (Fortune 500 HQ in VA)
| Industry | F500 HQs | Revenue |
|---|---|---|
| Aerospace / Defense | 4 | $236B |
|
||
| Technology / Defense | 3 | $32B |
|
||
| Financial Services | 2 | $176B |
|
||
| Utilities | 2 | $27B |
|
||
| Insurance | 2 | $25B |
|
||
| Technology | 2 | $15B |
|
||
Price history
1 event — show timeline
- 2026-05-26 Listed $225,000 REINMLS
Property tax history
-8.0%/yrLatest (2025): $543 · -78.2% YoY. Source: county tax records.
Cash-flow waterfall
monthlySold comps — $/sqft
last 12 mo · ≤1 miLoading sold comps…