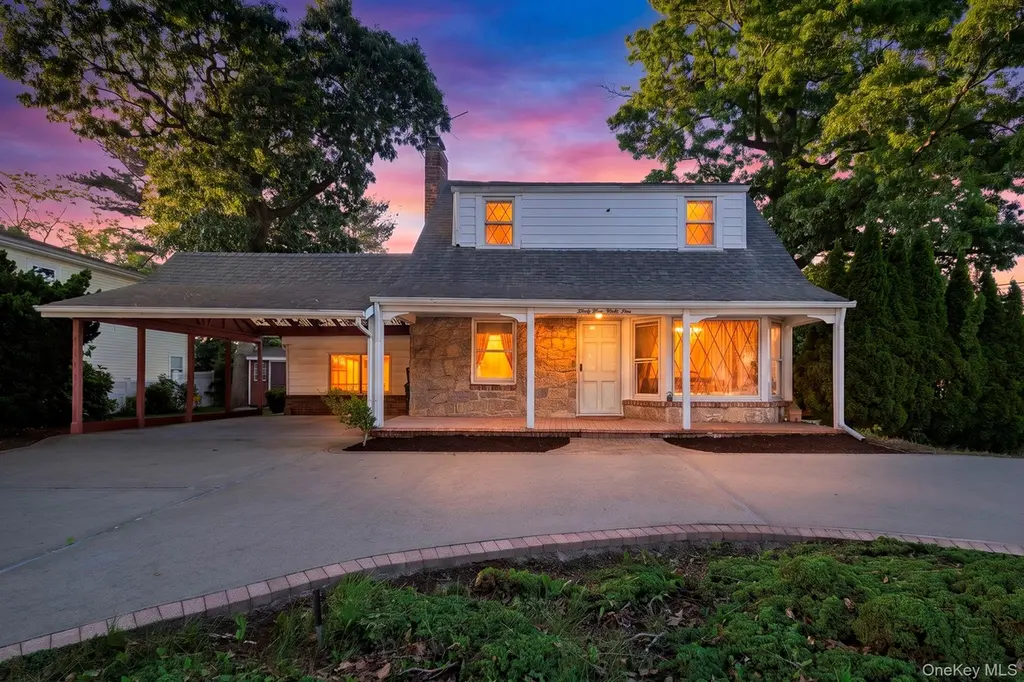
3499 Woodward Ave · Wantagh, NY
Flood risk 1/10 · Minimal
- FEMA flood zone
- X (unshaded)
- Chance of flooding over 30 yrs
- 0.0%
- Est. flood insurance / yr
- $473 – $860
Fire risk 1/10 · Minimal
- Est. fire insurance / yr
- $691 – $1,283
Heat risk 6/10 · Moderate
- Hot days now (above 94°F)
- 7 days/yr
- Hot days in 30 yrs
- 17 days/yr
Wind risk 6/10 · Moderate
- Chance of severe wind over 30 yrs
- 75.0%
Air-quality risk 4/10 · Minor
- Unhealthy air days now
- 3 days/yr
- Unhealthy air days in 30 yrs
- 5 days/yr
Risk factors via First Street. Map © Google.
Why this score? — see what drove the D+ grade
The composite is a weighted blend of 9 inputs, each scored 0–100. Each bar is that input's sub-score; the figure is the points it added to the 100-point composite (weight × sub-score).
- ARV discount +14.0/15.0
- Cash flow +11.9/30.0
- Schools +7.0/10.0
- Livability +4.2/5.0
- DSCR +3.5/10.0
- 1% rule +2.6/10.0
- Rent growth +2.5/5.0
- Condition / age +2.5/5.0
- Appreciation +0.0/10.0
$750,000
🖨 Deal sheet 📄 Offer letter ✓ Due diligence
Listing remarks
YOUR REWARD AWAITS HERE ON WOODWARD! Welcome to 3499 Woodward Avenue — a spacious home with tremendous potential in one of Wantagh’s most desirable neighborhoods. Set on a large corner property and nestled on a picturesque tree-lined street, this 4-bedroom, 2-full bath offers exceptional space, character, and the chance to create the home of your dreams. The home's curb appeal is enhanced by a covered front porch, carport and circular driveway. The living room is anchored by a cozy gas fireplace, while the dining room features oversized bay windows, a chandelier, and a split-unit system. The kitchen is equipped with stainless steel appliances, including an electric oven and ref
Key facts
- Covered front porch
- Large skylight
- Circular driveway
Tags
Property features AI
Exterior
- Parking: Covered carport (2 spaces); Driveway
- Security: Security system
- Utilities: Public sewer; Water available and connected; Electricity available and connected; Sewer available and connected; Public trash collection
- Home design: Single family residence; Multi/split levels
- Construction: Frame construction
- Exterior features: Corner lot; Carport(s); Covered porch
Interior
- Kitchen: Dishwasher; Electric cooktop; Electric oven; Oven; Refrigerator
- Bedrooms: Includes a bedroom on the first floor
- Flooring: Combination of flooring types; Tile; Wood
- Bathrooms: 2 full bathrooms
- Heating & cooling: Oil heating; Ductless cooling
- Interior features: First-floor bedroom; First-floor full bathroom; Ceiling fans; Chandelier; Formal dining room; Bay windows; Skylights; Covered porch
- Laundry & utility: Washer hookup; Electric dryer hookup; Additional laundry setup (other)
Neighborhood map
What this means for you Summary
Snapshot
- This is a 4-bed/1.0-bath single-family listed at $750k.
Deal economics
- At list price, monthly cash flow is $-187 ($-2k/yr) — negative.
- To cash-flow at today's rent, offer at most $717k (4.4% below list).
- To meet the 1% rule (rent ≥ 1% of price), the offer needs to be $570k (24.0% below list).
- Recommended offer: $570k (24.0% below list) — sets the bar for 1% rule.
- Cap rate 6.0% vs local median 1.9% in Wantagh — top-decile yield for the area; either an underpriced asset or a hidden risk that comps aren't pricing in. Stress-test before assuming the spread holds.
Location & tenants
- Location reads 84/100 on livability (#56 in NY, #816 nationally) — a professional / high-income tenant draw. Strengths: crime A+, commute A+, employment A+; Watch: cost of living F.
- Wantagh Union Free School District (suburban): math 73% / reading 77% proficiency, ranked #55 of 590 in NY (top 9%) — strong family-tenant draw, lease renewals of 3-5y typical; only 3% free/reduced lunch — higher-income household profile.
- Zoned schools: Wantagh School (math 67% / reading 72%, grade A-, #447 of 2,108 statewide, top 24%, 683 students, 8% FRL); Wantagh Middle School (math 58% / reading 64%, grade B+, #150 of 729 statewide, top 21%, 682 students, 8% FRL); Wantagh Senior High School (math 97% / reading 96%, grade A+, #56 of 1,100 statewide, top 5%, 836 students, 10% FRL).
- Market conditions: 121 active listings in the ZIP; 2 comparable units currently listed for rent nearby; 824 units permitted in Nassau County in 2024 (153 in 5+ unit buildings).
Forward outlook
- Local home prices are declining (-3.0%/yr); year-one equity from $5k of loan paydown is wiped out by about $22k of value loss. Plan a longer hold.
- Nassau County population projected at +7% by 2050 — modest demand growth; plan on rents tracking national, not racing it.
Negotiation context
- Only 7 days on market — expect competitive offers; lowballing is unlikely to land.
Risks & watch-outs
- Watch-outs: built in 1937 — expect roof / HVAC / electrical / plumbing capex.
- Climate carrying-cost: major wind risk, 75% chance of damaging wind over 30y; extreme-heat days projected 7→17/yr by 2055 (HVAC capex compounding) — expect insurance premiums to compound above CPI over the hold.
Questions for the listing agent
- What do current leases actually rent for vs. the listed asking? Can we see a recent rent roll and the last 12 months of T-12 income?
- Built in 1937 — when were the roof, HVAC, electrical panel, plumbing, and water heater last replaced?
- Is there a deadline driving the sale (1031 exchange, divorce, estate, relocation)? That informs how much negotiation room exists.
- Schools are A-rated — typically a magnet for longer-tenancy family renters. What's the average tenant stay here, and is there a school-zone premium baked into asking?
- The area grade is low — what's the realistic commute time and amenity access for the typical tenant pool here? Any planned neighborhood developments (good or bad) we should know about?
- What's the average days-on-market for RENTAL listings here right now (not sales)? A rising rental-DOM trend means longer vacancies and softer asking-rent achievability than the comps imply.
- What's the recent tenant-quality profile in this submarket — average credit score on applications, eviction rate, late-payment / NSF rate, and stable-employment percentage? A property-management company in the area should have these aggregated.
- How much new for-sale + rental construction is in the pipeline within 1–3 miles? Heavy new supply typically softens prices + rents 12–24 months out; constrained supply supports both.
Investment metrics
- 1% rule
- 0.76% ✗
- Cap rate
- 5.99%
- Cash-on-cash
- -1.07%
- DSCR
- 0.95
- GRM
- 11.0
CMA / ARV
- ARV (on-the-fly)
- $876,534
- Comps found
- 12
Show comp detail 12 sales within ~0.75 mi
| Address | Dist | Beds/Ba | Sqft | Sold | Price | $/sf | Match |
|---|---|---|---|---|---|---|---|
| 1991 Oakland Ave | 0.05mi | 5/3.0 (+1) | 1,990 (-5%) | 6mo | $775,000 | $389 | 70 |
| 1769 Jane St | 0.51mi | 4/2.0 | 2,192 (+4%) | 3mo | $987,000 | $450 | 63 |
| 3462 Ella Rd | 0.66mi | 4/2.5 | 2,038 (-3%) | 5mo | $830,000 | $407 | 54 |
| 2333 Beech St | 0.63mi | 5/2.0 (+1) | 2,000 (-5%) | 1mo | $800,000 | $400 | 53 |
| 1630 Temple Dr | 0.72mi | 4/2.0 | 1,957 (-7%) | 7mo | $865,000 | $442 | 45 |
| 2162 Fir St | 0.36mi | 5/2.0 (+1) | 1,820 (-13%) | 10mo | $855,000 | $470 | 43 |
| 2296 Hampton Ave | 0.71mi | 4/2.0 | 1,906 (-9%) | 7mo | $795,000 | $417 | 41 |
| 3861 Hickory St | 0.69mi | 3/2.5 (-1) | 2,220 (+6%) | 8mo | $763,000 | $344 | 41 |
| 3388 Maplewood Dr | 0.42mi | 3/2.0 (-1) | 1,815 (-14%) | 9mo | $751,001 | $414 | 41 |
| 3805 Mansfield Dr | 0.65mi | 5/2.0 (+1) | 1,926 (-8%) | 9mo | $890,000 | $462 | 39 |
| 3832 Hickory St | 0.65mi | 5/4.0 (+1) | 2,244 (+7%) | 8mo | $950,000 | $423 | 35 |
| 3608 Tonopah St | 0.65mi | 4/3.5 | 2,382 (+13%) | 5mo | $950,000 | $399 | 34 |
Match score weights: distance 35% · size 25% · config 20% · recency 20%. Top-matched comps best support the ARV.
Projected returns pro-forma
-3.0% appreciation · 3.0% rent growth · sell at horizon
- IRR
- -18.1%
- Equity multiple
- 0.36×
- Total profit
- $-133,654
- Equity at exit
- $111,827
- IRR
- -10.4%
- Equity multiple
- 0.37×
- Total profit
- $-132,599
- Equity at exit
- $64,846
Cash invested: $210,000 (down + closing). Projections, not guarantees.
Landlord ↔ Tenant lean methodology
- Overall (STATE)
- 15 Strongly Tenant-Friendly
- State New York
- 15 Strongly Tenant-Friendly · D+10
- County
- — inherits STATE
- City
- — inherits STATE
ZIP-level market 11793
- Active inventory
- 121
- Price-to-rent
- 11.0×
Monthly cashflow live
- Estimated rent
- $5,697 medium interval (Pro) →
- Mortgage (P&I)
- −$3,933
- Tax from tax record
- −$442 /mo · $5,302/yr
- Insurance
- −$312
- HOA
- −$0
- Vacancy / Maint / Mgmt
- −$1,196
- Net cashflow
- $-187
Break-even live
UW: 25.0% down · 7.5% · 30yr · 1.5% tax · 5.0% vac · 8.0% maint · 8.0% mgmt
Financing live
Cash to close
- Down payment
- $187,500
- Closing costs
- $22,500
- Reserves months
- —
- Total cash needed
- —
Loan-product check · same deal, 3 products live
Conventional
25% down · 7.5% · 30yr
- Down + closing
- —
- Monthly P&I
- —
- Monthly cashflow
- —
- DSCR
- —
- Eligible?
- —
Personal DTI + credit; lowest rate.
DSCR
20% down · 8.5% · 30yr
- Down + closing
- —
- Monthly P&I
- —
- Monthly cashflow
- —
- DSCR
- —
- Eligible?
- —
No personal income docs; deal must DSCR.
Hard money
10% down · 12.0% · 12mo
- Down + closing
- —
- Monthly P&I
- —
- Monthly cashflow
- —
- DSCR
- —
- Eligible?
- —
Short-term bridge; refi at stabilization.
Rent comps 2 comps
| Address | Beds | Baths | Sqft | Rent | $/sqft | DOM | Units | Dist |
|---|---|---|---|---|---|---|---|---|
| 3883 Franklin Ave Seaford, NY | 4.0 | 2.0 | 1593 | $5,500 | $3.45 | 44d | 1 | 0.86mi |
| 4025 Boston Ave Seaford, NY | 4.0 | 2.5 | 2658 | $6,000 | $2.26 | 1d | 1 | 1.37mi |
Listing history 7 events
-
2026-06-18days on market $750,000 Active 7 DOM
-
2026-06-17days on market $750,000 Active 6 DOM
-
2026-06-16days on market $750,000 Active 5 DOM
-
2026-06-15days on market $750,000 Active 4 DOM
-
2026-06-13days on market $750,000 Active 2 DOM
-
2026-06-12remarks 687-char remark
-
2026-06-12$750,000 Active 1 DOM
ⓘ Source: listings_history table (triggers on properties + properties_extension) + one-shot
backfill from property_details.listing_events for pre-trigger history.
Tax reassessment forecast NY · Partial reset (capped growth)
- Current annual tax
- $5,302 · $442/mo
- Projected year-2 tax
- $8,989 · $749/mo
- Expected delta
- +$3,686/yr (+$307/mo · 69.5%)
ⓘ Screening estimate from a state-policy table — verify with the county assessor before closing.
Climate risk First Street
- Flood 1/10 Low FEMA zone X (unshaded) · 0% chance over 30 yrs
- Wildfire 1/10 Low
- Heat 6/10 Major 7 d/yr ≥94°F today · 17 d/yr by 30 yrs out
- Wind 6/10 Major 75% chance of damaging wind over 30 yrs
- Air quality 4/10 Moderate 3 unhealthy d/yr today · 5 by 30 yrs out
Nearby sold comps map
Loading sold comps map…
Walkable amenities ~0.75 mi
Loading nearby amenities…
Taxation est. · year 1
- Rental income
- $68,362
- − Mortgage interest
- −$42,012
- − Property taxes
- −$5,302
- − Insurance
- −$3,750
- − Repairs & maintenance
- −$5,469
- − Management
- −$5,469
- − Depreciation
- −$21,818
- Taxable loss
- −$15,457
- Est. tax savings @ 24.0%
- +$3,710
- After-tax cash flow
- $1,467/yr
For passive investors: Depreciation is non-cash, so a rental often shows a tax loss while cash-flowing — sheltering income. Rental losses are passive: they offset passive income freely, and up to $25,000/yr can offset ordinary (W-2) income if you actively participate and your MAGI is under $100k (phasing out to $0 by $150k); unused losses carry forward. On sale, claimed depreciation is recaptured at up to 25%, and gains may owe capital-gains tax (a 1031 exchange can defer both). Figures are a year-1 estimate at your 24.0% rate — not tax advice; consult a CPA.
Schools (NCES district)
- District
- Wantagh Union Free School District
- NCES district ID
- 3629850
- Math proficiency
- 73% ▼ -10.00%
- Reading proficiency
- 77% ▲ 5.00%
- Median HH income
- $121,758
- Composite
- 70.36/100
- National rank
- #270
- State rank
- #55 of 590 in NY
Livability — Wantagh
- Score
- 84/100
- State rank
- #56
- US rank
- #816
Category grades
Schools grade is shown separately in the Schools card above.
Census & demographics
- Census place
- Wantagh, NY
- City population
- 31,497
- Population (ZIP)
- 31,497
Population outlook (Nassau County) Hauer SSP2
- Today (2025)
- 1,409,302 people
- By 2030
- 1,431,482 · +1.6%
- By 2040
- 1,471,607 · +4.4%
- By 2050
- 1,502,845 · +6.6%
- By 2075
- 1,575,403 · +11.8%
- By 2100
- 1,554,356 · +10.3%
Race, ethnicity, and origin ACS 2023
- Neighborhood character
- Predominantly White (82%)
- Race & ethnicity
- White 82% Hispanic / Latino 11% Two or more races 8% Asian 3% Black 1%
- Hispanic origin (detail)
- Puerto Rican 2%
- Common ancestry
- Romanian 4% Scotch-Irish 3% Portuguese 1%
- Foreign-born
- 9% · Canada, China, Dominican Republic
- Languages at home
- 88% English-only · Spanish 5% Other Indo-European 4% Chinese 1%
Political lean MEDSL · Nassau
- 2024 margin
- Toss-up / Even · D 47.9% · R 52.1%
- 2008→2024 swing
- -12.6pp toward R · 2008: 8.4pp · 2024: -4.2pp
- All cycles
- 2024: R+4.2 2020: D+9.5 2016: D+5.3 2012: D+6.7 2008: D+8.4
Not yet ingested
- Civics
- —
Market trends
- HPI YoY
- ▼ -842.25%
- Current HPI
- 299.9785
- Rent YoY
- —
- Metro
- —
- State GDP YoY
- ▲ 2.60%
- F500 in state
- 92
Industry mix (Fortune 500 HQ in NY)
| Industry | F500 HQs | Revenue |
|---|---|---|
| Financial Services | 10 | $950B |
|
||
| Consumer Goods | 9 | $162B |
|
||
| Insurance | 4 | $225B |
|
||
| Telecommunications | 2 | $144B |
|
||
| Pharmaceuticals | 2 | $112B |
|
||
| Media / Entertainment | 2 | $69B |
|
||
Price history
1 event — show timeline
- 2026-06-11 Listed $750,000 OneKey® MLS as Distributed by MLS Grid
Property tax history
-4.3%/yrLatest (2024): $5,302 · -48.7% YoY. Source: county tax records.
Cash-flow waterfall
monthlySold comps — $/sqft
last 12 mo · ≤1 miLoading sold comps…