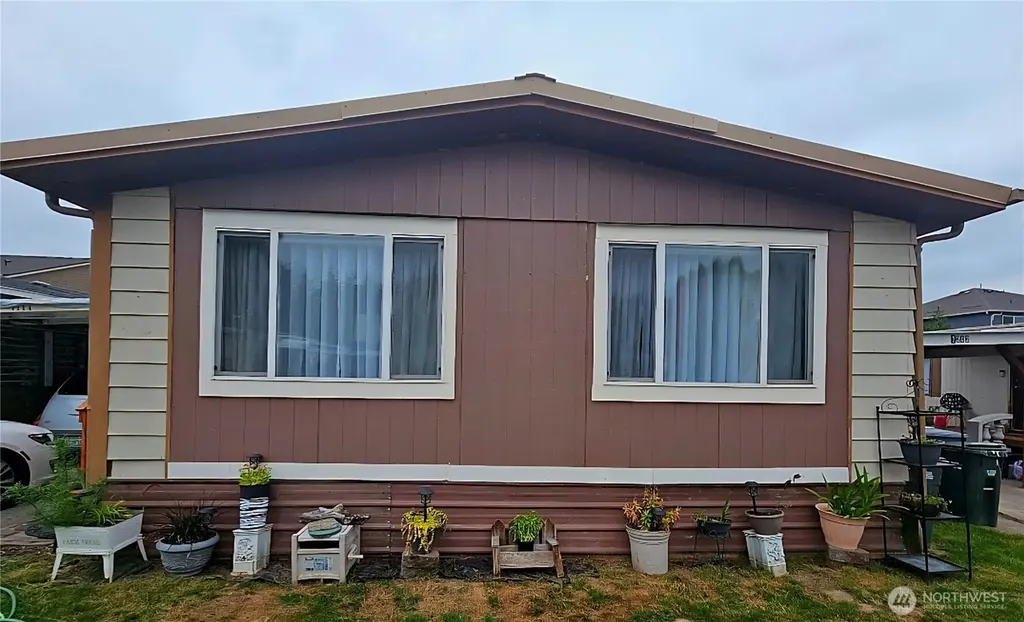
1114 29th St Pl NW #29 · Puyallup, WA
Flood risk 8/10 · Major
- FEMA flood zone
- X (unshaded)
- Chance of flooding over 30 yrs
- 0.78%
- Est. flood insurance / yr
- $507 – $1,088
Fire risk 1/10 · Minimal
- Est. fire insurance / yr
- $604 – $1,122
Heat risk 3/10 · Minor
- Hot days now (above 89°F)
- 7 days/yr
- Hot days in 30 yrs
- 16 days/yr
Wind risk 1/10 · Minimal
- Chance of severe wind over 30 yrs
- —
Air-quality risk 7/10 · Major
- Unhealthy air days now
- 11 days/yr
- Unhealthy air days in 30 yrs
- 12 days/yr
Risk factors via First Street. Map © Google.
Why this score? — see what drove the B grade
The composite is a weighted blend of 9 inputs, each scored 0–100. Each bar is that input's sub-score; the figure is the points it added to the 100-point composite (weight × sub-score).
- Cash flow +30.0/30.0
- 1% rule +10.0/10.0
- DSCR +10.0/10.0
- ARV discount +7.5/15.0
- Schools +5.4/10.0
- Livability +4.1/5.0
- Condition / age +3.8/5.0
- Rent growth +2.9/5.0
- Appreciation +0.0/10.0
$99,000
🖨 Deal sheet (PDF) 📄 Offer letter ✓ Due diligence
Listing remarks
Move-In ready open concept 2 bedroom/ 2 bathroom PLUS BONUS ROOM manufactured home in an all ages park w/ very low $720 a month space rent. Stainless steel appliances, tile work, 5 year old flooring, 8 year old roof and furnace with Nest thermostat system, several updated windows, gorgeous interior design throughout, large front porch, non-smoking pet free household (although pets are allowed). Right off of River Road in the Puyallup Valley near shopping and schools. Ask me who can loan on this with 30% down!
Key facts
- Induction stove
- Large front porch
- Updated windows
Tags
Neighborhood map
What this means for you Summary
Snapshot
- This is a 2-bed/2.0-bath manufactured listed at $99k. Condition is rated good.
Deal economics
- At list price, monthly cash flow is $889 ($11k/yr) — positive.
- The deal already cash-flows at list — no discount required.
- Meets the 1% rule at list price ($2k rent vs $99k).
- Recommended offer: $90k (9.0% below list) — sets the bar for market timing.
- Cap rate 17.9% vs local median 2.6% in Puyallup — top-decile yield for the area; either an underpriced asset or a hidden risk that comps aren't pricing in. Stress-test before assuming the spread holds.
Location & tenants
- Location reads 82/100 on livability (#70 in WA, #1,234 nationally) — a professional / high-income tenant draw. Strengths: amenities A+, commute A+, employment A+; Watch: crime F, cost of living F.
- Puyallup School District (suburban): math 53% / reading 66% proficiency, ranked #52 of 291 in WA (top 18%) — acceptable for families but not a draw, mixed tenant base, ~2y average lease.
- Market conditions: Rents rising (+1.4%/yr); 228 active listings in the ZIP; 7 comparable units currently listed for rent nearby; rentals at typical pace (median 19d on market — plan ~3-4 weeks tenant-placement turnaround); 43% of comp listings sitting > 30 days — soft ceiling on asking rent; solid renter incomes; 3,209 units permitted in Pierce County in 2024 (1,269 in 5+ unit buildings).
Forward outlook
- Local home prices are declining (-3.0%/yr); year-one equity from $684 of loan paydown is wiped out by about $3k of value loss. Plan a longer hold.
- Pierce County population projected at +26% by 2050 — long-run rental-demand tailwind backs the buy-and-hold thesis.
- At projected returns (-3.0% appreciation + 1.4% rent growth), your $28k cash investment doubles in ~4 years — after that, you're playing with house money.
Negotiation context
- It's been on market 98 days — a 9% lower offer ($90k) is reasonable based on typical stale-listing flexibility.
Risks & watch-outs
- Watch-outs: flood insurance adds $66/mo.
- Climate carrying-cost: severe flood risk — expect insurance premiums to compound above CPI over the hold.
Questions for the listing agent
- It's been on market 98 days. Have you received any prior offers? Is the seller open to a 9% concession, seller financing, or rate buy-down credit?
- Built in 1976 — when were the roof, HVAC, electrical panel, plumbing, and water heater last replaced?
- What's the actual annual flood-insurance premium (NFIP or private), and is the property in a SFHA with mandatory coverage?
- Why hasn't it sold? Are there any deal-killer items the seller is aware of (foundation, flood, title, zoning, code violations)?
- Is there a deadline driving the sale (1031 exchange, divorce, estate, relocation)? That informs how much negotiation room exists.
- Schools are B-rated — typically a magnet for longer-tenancy family renters. What's the average tenant stay here, and is there a school-zone premium baked into asking?
- Crime grade is F in this area — have there been break-ins, vandalism, or insurance claims at this property in the last 3 years? What carrier currently insures it and at what premium?
- What's the average days-on-market for RENTAL listings here right now (not sales)? A rising rental-DOM trend means longer vacancies and softer asking-rent achievability than the comps imply.
- What's the recent tenant-quality profile in this submarket — average credit score on applications, eviction rate, late-payment / NSF rate, and stable-employment percentage? A property-management company in the area should have these aggregated.
- How much new for-sale + rental construction is in the pipeline within 1–3 miles? Heavy new supply typically softens prices + rents 12–24 months out; constrained supply supports both.
Investment metrics
- 1% rule
- 2.08% ✓
- Cap rate
- 17.88%
- Cash-on-cash
- 41.38%
- DSCR
- 2.84
- GRM
- 4.0
CMA / ARV
- ARV (median comp)
- $198,448
- List price
- $99,000
- Delta
- -50.11%
- Verdict
- UNDERPRICED
- Comps
- 2 within 1.0 mi
Show comp detail 2 sales within ~0.75 mi
| Address | Dist | Beds/Ba | Sqft | Sold | Price | $/sf | Match |
|---|---|---|---|---|---|---|---|
| 5412 76th Ave E Unit B | 0.41mi | 3/2.0 (+1) | 1,352 (+1%) | 8mo | $170,000 | $126 | 68 |
| 5412 76th Ave E Lot M | 0.41mi | 3/2.0 (+1) | 1,512 (+12%) | 10mo | $227,000 | $150 | 47 |
Match score weights: distance 35% · size 25% · config 20% · recency 20%. Top-matched comps best support the ARV.
Projected returns pro-forma
-3.0% appreciation · 1.41% rent growth · sell at horizon
- IRR
- 32.8%
- Equity multiple
- 2.35×
- Total profit
- $37,427
- Equity at exit
- $14,761
- IRR
- 38.9%
- Equity multiple
- 4.35×
- Total profit
- $92,898
- Equity at exit
- $8,560
Cash invested: $27,720 (down + closing). Projections, not guarantees.
Landlord ↔ Tenant lean methodology
- Overall (STATE)
- 28 Tenant-Leaning
- State Washington
- 28 Tenant-Leaning · D+8
- County
- — inherits STATE
- City
- — inherits STATE
ZIP-level market 98371
- Rents YoY
- 1.4%
- Active inventory
- 228
- Price-to-rent
- 4.0×
Monthly cashflow live
- Estimated rent
- $2,062 high interval (Pro) →
- Mortgage (P&I)
- −$519
- Tax from tax record
- −$113 /mo · $1,351/yr
- Insurance
- −$41
- Flood insurance flood zone
- −$66 /mo · $798/yr
- HOA
- −$0
- Vacancy / Maint / Mgmt
- −$433
- Net cashflow
- $889
Break-even live
Sensitivity live
| Price | -10% $946 | -5% $918 | +0% $889 | +5% $861 | +10% $833 |
|---|---|---|---|---|---|
| Rent | -10% $727 | -5% $808 | +0% $889 | +5% $971 | +10% $1,052 |
| Rate | -1.0pp $939 | -0.5pp $915 | base $889 | +0.5pp $864 | +1.0pp $838 |
UW: 25.0% down · 7.5% · 30yr · 1.5% tax · 5.0% vac · 8.0% maint · 8.0% mgmt
Financing live
Cash to close
- Down payment
- $24,750
- Closing costs
- $2,970
- Reserves months
- —
- Total cash needed
- —
Loan-product check · same deal, 3 products live
Conventional
25% down · 7.5% · 30yr
- Down + closing
- —
- Monthly P&I
- —
- Monthly cashflow
- —
- DSCR
- —
- Eligible?
- —
Personal DTI + credit; lowest rate.
DSCR
20% down · 8.5% · 30yr
- Down + closing
- —
- Monthly P&I
- —
- Monthly cashflow
- —
- DSCR
- —
- Eligible?
- —
No personal income docs; deal must DSCR.
Hard money
10% down · 12.0% · 12mo
- Down + closing
- —
- Monthly P&I
- —
- Monthly cashflow
- —
- DSCR
- —
- Eligible?
- —
Short-term bridge; refi at stabilization.
Rent comps 7 comps
| Address | Beds | Baths | Sqft | Rent | $/sqft | DOM | Units | Dist |
|---|---|---|---|---|---|---|---|---|
| 1503 18th St NW Puyallup, WA | 1.0–2.0 | 1.0 | 840 | $1,730 | $2.06 | 11d | 4 | 0.78mi |
| 8009 50th St E Fife, WA | 2.0 | 1.0 | 1100 | $2,150 | $1.95 | 19d | 1 | 0.86mi |
| 1017 13th Street Ct NW Puyallup, WA | 3.0 | 2.0 | 1250 | $2,200 | $1.76 | 44d | 1 | 1.12mi |
| 508 11th St NW Puyallup, WA | 2.0 | 1.0 | 1037 | $2,000 | $1.93 | 44d | 1 | 1.25mi |
| 508 11th St NW Unit H Puyallup, WA | 2.0 | 1.0 | 1037 | $1,800 | $1.74 | 17d | 1 | 1.25mi |
| 305 13th St SW Unit D Puyallup, WA | 2.0 | 1.5 | 880 | $1,820 | $2.07 | 44d | 1 | 1.35mi |
| 6753 Park St E Fife, WA | 3.0 | 2.5 | 1814 | $2,895 | $1.60 | 0d | 1 | 1.38mi |
Listing history 20 events
-
2026-06-21days on market $99,000 Active 98 DOM
-
2026-06-18days on market $99,000 Active 95 DOM
-
2026-06-17days on market $99,000 Active 94 DOM
-
2026-06-16days on market $99,000 Active 93 DOM
-
2026-06-15days on market $99,000 Active 92 DOM
-
2026-06-13days on market $99,000 Active 90 DOM
-
2026-06-13days on market $99,000 Active 89 DOM
-
2026-06-09days on market $99,000 Active 86 DOM
-
2026-06-08days on market $99,000 Active 85 DOM
-
2026-06-07days on market $99,000 Active 84 DOM
-
2026-06-04days on market $99,000 Active 81 DOM
-
2026-06-03days on market $99,000 Active 80 DOM
-
2026-06-02days on market $99,000 Active 79 DOM
-
2026-06-01days on market $99,000 Active 78 DOM
-
2026-05-31days on market $99,000 Active 77 DOM
-
2026-05-04price $105,000
-
2026-04-19price $110,000
-
2026-04-12price $115,000
-
2026-04-01price $120,000
-
2026-03-15$125,000 Active
ⓘ Source: listings_history table (triggers on properties + properties_extension) + one-shot
backfill from property_details.listing_events for pre-trigger history.
Tax reassessment forecast WA · Resets to sale price
- Current annual tax
- $1,351 · $113/mo
- Projected year-2 tax
- $1,351 · $113/mo
- Expected delta
- $0/yr ($0/mo · 0.0%)
ⓘ Screening estimate from a state-policy table — verify with the county assessor before closing.
Climate risk First Street
- Flood 8/10 Severe FEMA zone X (unshaded) · 78% chance over 30 yrs
- Wildfire 1/10 Low
- Heat 3/10 Moderate 7 d/yr ≥89°F today · 16 d/yr by 30 yrs out
- Wind 1/10 Low
- Air quality 7/10 Severe 11 unhealthy d/yr today · 12 by 30 yrs out
Nearby sold comps map
Loading sold comps map…
Walkable amenities ~0.75 mi
Loading nearby amenities…
Taxation est. · year 1
- Rental income
- $24,743
- − Mortgage interest
- −$5,546
- − Property taxes
- −$1,351
- − Insurance
- −$1,292
- − Repairs & maintenance
- −$1,979
- − Management
- −$1,979
- − Depreciation
- −$2,880
- Taxable income
- $9,715
- Est. tax owed @ 24.0%
- −$2,332
- After-tax cash flow
- $8,342/yr
For passive investors: Depreciation is non-cash, so a rental often shows a tax loss while cash-flowing — sheltering income. Rental losses are passive: they offset passive income freely, and up to $25,000/yr can offset ordinary (W-2) income if you actively participate and your MAGI is under $100k (phasing out to $0 by $150k); unused losses carry forward. On sale, claimed depreciation is recaptured at up to 25%, and gains may owe capital-gains tax (a 1031 exchange can defer both). Figures are a year-1 estimate at your 24.0% rate — not tax advice; consult a CPA.
Condition & rehab AI · 13 photos
This move-in ready manufactured home is in good condition with updated interiors and appliances, making it an attractive option for both resale and rental.
Value-add opportunities
- Both update landscaping — improves curb appeal and rental value
- Both install smart home security system — enhances safety and rental appeal
Renovation cost estimate screening
Value-add ROI direction
- Both update landscaping — improves curb appeal and rental value ↑
- Both install smart home security system — enhances safety and rental appeal ↑
ⓘ Cost ranges are severity-bucket heuristics (US national rule-of-thumb). Get contractor quotes + a written scope before underwriting a rehab budget.
Schools (NCES district)
- District
- Puyallup School District
- NCES district ID
- 5306960
- Math proficiency
- 53% ▬ 0.00%
- Reading proficiency
- 66% ▬ 0.00%
- Median HH income
- $68,291
- Composite
- 54.01/100
- National rank
- #3006
- State rank
- #52 of 291 in WA
Livability — Puyallup
- Score
- 82/100
- State rank
- #70
- US rank
- #1234
Category grades
Schools grade is shown separately in the Schools card above.
Census & demographics
- Census place
- Puyallup, WA
- County
- Pierce County · 788,257 people
- City population
- 159,771
- Metro
- Seattle-Tacoma-Bellevue, WA
- Population (ZIP)
- 24,682
- Household income
- $97,242
- Rent vs Own
- Severe rent burden
- 507.0
Population outlook (Pierce County) Hauer SSP2
- Today (2025)
- 956,648 people
- By 2030
- 1,010,862 · +5.7%
- By 2040
- 1,113,170 · +16.4%
- By 2050
- 1,206,524 · +26.1%
- By 2075
- 1,436,425 · +50.2%
- By 2100
- 1,563,654 · +63.5%
Race, ethnicity, and origin ACS 2023
- Neighborhood character
- Predominantly White (70%)
- Race & ethnicity
- White 70% Two or more races 12% Hispanic / Latino 11% Asian 6% Black 4%
- Hispanic origin (detail)
- Mexican 9%
- Common ancestry
- Portuguese 5% Slovak 3% Italian 2%
- Foreign-born
- 10% · Canada, South Korea, Vietnam
- Languages at home
- 85% English-only · Spanish 5% Korean 2% Vietnamese 2%
Political lean MEDSL · Pierce
- 2024 margin
- D (+10.8) · D 53.9% · R 43.1% · Other 3.0%
- 2008→2024 swing
- -1.4pp toward R · 2008: 12.2pp · 2024: 10.8pp
- All cycles
- 2024: D+10.8 2020: D+11.2 2016: D+7.5 2012: D+11.0 2008: D+12.2
Not yet ingested
- Civics
- —
Market trends
- HPI YoY
- ▼ -580.45%
- Current HPI
- 295.2143
- Rent YoY
- ▲ 1.41%
- Metro
- Seattle-Tacoma-Bellevue, WA
- State GDP YoY
- ▲ 4.65%
- F500 in state
- 22
Industry mix (Fortune 500 HQ in WA)
| Industry | F500 HQs | Revenue |
|---|---|---|
| Retail | 2 | $269B |
|
||
| Technology / Retail | 1 | $638B |
|
||
| Technology | 1 | $245B |
|
||
| Telecommunications | 1 | $38B |
|
||
| Food / Beverage | 1 | $36B |
|
||
| Automotive / Trucks | 1 | $34B |
|
||
Price history
-16.0% since first listed5 events — show timeline
- 2026-05-04 Price Changed $105,000 NWMLS as Distributed by MLS Grid
- 2026-04-19 Price Changed $110,000 NWMLS as Distributed by MLS Grid
- 2026-04-12 Price Changed $115,000 NWMLS as Distributed by MLS Grid
- 2026-04-01 Price Changed $120,000 NWMLS as Distributed by MLS Grid
- 2026-03-15 Listed $125,000 NWMLS as Distributed by MLS Grid
Property tax history
+11.1%/yrLatest (2026): $1,351 · +11.1% YoY. Source: county tax records.
Cash-flow waterfall
monthlySold comps — $/sqft
last 12 mo · ≤1 miLoading sold comps…