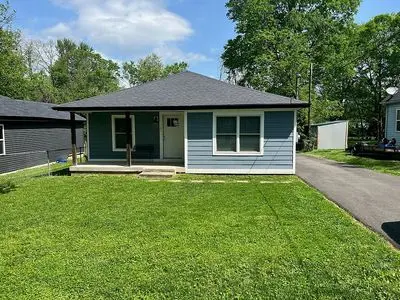
260 W Stephens St · Midway, KY
Flood risk 1/10 · Minimal
- FEMA flood zone
- X (unshaded)
- Chance of flooding over 30 yrs
- 0.0%
- Est. flood insurance / yr
- $507 – $1,088
Fire risk 2/10 · Minimal
- Est. fire insurance / yr
- $839 – $1,559
Heat risk 4/10 · Minor
- Hot days now (above 102°F)
- 7 days/yr
- Hot days in 30 yrs
- 19 days/yr
Wind risk 2/10 · Minimal
- Chance of severe wind over 30 yrs
- 2.0%
Air-quality risk 2/10 · Minimal
- Unhealthy air days now
- 0 days/yr
- Unhealthy air days in 30 yrs
- 1 days/yr
Risk factors via First Street. Map © Google.
Why this score? — see what drove the D grade
The composite is a weighted blend of 9 inputs, each scored 0–100. Each bar is that input's sub-score; the figure is the points it added to the 100-point composite (weight × sub-score).
- Cash flow +13.7/30.0
- ARV discount +7.5/15.0
- DSCR +4.2/10.0
- Schools +4.2/10.0
- Livability +3.6/5.0
- 1% rule +2.9/10.0
- Rent growth +2.5/5.0
- Condition / age +2.5/5.0
- Appreciation +0.0/10.0
$279,000
🖨 Deal sheet (PDF) 📄 Offer letter ✓ Due diligence
Listing remarks MLS
Looking for a fixer upper located near US 421 and I-64 with easy access to Lexington and Frankfort in the community of Midway. This may just be the home. House sits on a large fenced in lot. Home features 3 rooms that have been used as bedrooms, a living room, and a room that could be used as a laundry room or dining area. With TLC this would be a great starter home or rental property. Property is being sold as is. Schedule a showing today.
Key facts
- Fully renovated
- Craftsman home
- New sewer line
Tags
Neighborhood map
What this means for you Summary
Snapshot
- This is a 3-bed/1.0-bath other listed at $279k.
Deal economics
- At list price, monthly cash flow is $23 ($272/yr) — positive.
- The deal already cash-flows at list — no discount required.
- To meet the 1% rule (rent ≥ 1% of price), the offer needs to be $220k (21.1% below list).
- Recommended offer: $220k (21.1% below list) — sets the bar for 1% rule.
- Cap rate 6.4% vs local median 3.1% in Midway — top-decile yield for the area; either an underpriced asset or a hidden risk that comps aren't pricing in. Stress-test before assuming the spread holds.
Location & tenants
- Location reads 71/100 on livability (#151 in KY) — a middle-class / working-renter tenant base. Strengths: crime A+, cost of living A+, housing A+; Watch: employment D+, amenities F, commute F.
- Woodford County (town): math 45% / reading 52% proficiency, ranked #9 of 165 in KY (top 6%) — families likely to look elsewhere, expect single-tenant / working-renter base with shorter leases.
- Market conditions: 20 active listings in the ZIP; 1 comparable units currently listed for rent nearby; 102 units permitted in Woodford County in 2024 (0 in 5+ unit buildings).
Forward outlook
- Local home prices are declining (-3.0%/yr); year-one equity from $2k of loan paydown is wiped out by about $8k of value loss. Plan a longer hold.
- Woodford County population projected at +9% by 2050 — modest demand growth; plan on rents tracking national, not racing it.
Negotiation context
- It's been on market 36 days — a 3% lower offer ($271k) is reasonable based on typical stale-listing flexibility.
Questions for the listing agent
- It's been on market 36 days. Have you received any prior offers? Is the seller open to a 21% concession, seller financing, or rate buy-down credit?
- Is there a deadline driving the sale (1031 exchange, divorce, estate, relocation)? That informs how much negotiation room exists.
- Schools are B-rated — typically a magnet for longer-tenancy family renters. What's the average tenant stay here, and is there a school-zone premium baked into asking?
- The area grade is low — what's the realistic commute time and amenity access for the typical tenant pool here? Any planned neighborhood developments (good or bad) we should know about?
- What's the average days-on-market for RENTAL listings here right now (not sales)? A rising rental-DOM trend means longer vacancies and softer asking-rent achievability than the comps imply.
- What's the recent tenant-quality profile in this submarket — average credit score on applications, eviction rate, late-payment / NSF rate, and stable-employment percentage? A property-management company in the area should have these aggregated.
- How much new for-sale + rental construction is in the pipeline within 1–3 miles? Heavy new supply typically softens prices + rents 12–24 months out; constrained supply supports both.
Investment metrics
- 1% rule
- 0.79% ✗
- Cap rate
- 6.39%
- Cash-on-cash
- 0.35%
- DSCR
- 1.02
- GRM
- 10.6
CMA / ARV
No comps found within radius.
Projected returns pro-forma
-3.0% appreciation · 3.0% rent growth · sell at horizon
- IRR
- -15.8%
- Equity multiple
- 0.44×
- Total profit
- $-43,863
- Equity at exit
- $41,600
- IRR
- -7.4%
- Equity multiple
- 0.53×
- Total profit
- $-36,731
- Equity at exit
- $24,123
Cash invested: $78,120 (down + closing). Projections, not guarantees.
Landlord ↔ Tenant lean methodology
- Overall (STATE)
- 83 Strongly Landlord-Friendly
- State Kentucky
- 83 Strongly Landlord-Friendly · R+16
- County
- — inherits STATE
- City
- — inherits STATE
ZIP-level market 40347
- Active inventory
- 20
- Price-to-rent
- 10.6×
Monthly cashflow live
- Estimated rent
- $2,200 medium interval (Pro) →
- Mortgage (P&I)
- −$1,463
- Tax from tax record
- −$136 /mo · $1,632/yr
- Insurance
- −$116
- HOA
- −$0
- Vacancy / Maint / Mgmt
- −$462
- Net cashflow
- $23
Break-even live
Sensitivity live
| Price | -10% $181 | -5% $102 | +0% $23 | +5% $-56 | +10% $-135 |
|---|---|---|---|---|---|
| Rent | -10% $-151 | -5% $-64 | +0% $23 | +5% $110 | +10% $196 |
| Rate | -1.0pp $163 | -0.5pp $94 | base $23 | +0.5pp $-50 | +1.0pp $-123 |
UW: 25.0% down · 7.5% · 30yr · 1.5% tax · 5.0% vac · 8.0% maint · 8.0% mgmt
Financing live
Cash to close
- Down payment
- $69,750
- Closing costs
- $8,370
- Reserves months
- —
- Total cash needed
- —
Loan-product check · same deal, 3 products live
Conventional
25% down · 7.5% · 30yr
- Down + closing
- —
- Monthly P&I
- —
- Monthly cashflow
- —
- DSCR
- —
- Eligible?
- —
Personal DTI + credit; lowest rate.
DSCR
20% down · 8.5% · 30yr
- Down + closing
- —
- Monthly P&I
- —
- Monthly cashflow
- —
- DSCR
- —
- Eligible?
- —
No personal income docs; deal must DSCR.
Hard money
10% down · 12.0% · 12mo
- Down + closing
- —
- Monthly P&I
- —
- Monthly cashflow
- —
- DSCR
- —
- Eligible?
- —
Short-term bridge; refi at stabilization.
Rent comps 1 comps
| Address | Beds | Baths | Sqft | Rent | $/sqft | DOM | Units | Dist |
|---|---|---|---|---|---|---|---|---|
| 421 Elkton Pl Midway, KY | 3.0 | 1.0 | 1056 | $2,200 | $2.08 | 45d | 1 | 0.45mi |
Listing history 18 events
-
2026-06-17days on market $279,000 Active 36 DOM
-
2026-06-16days on market $279,000 Active 35 DOM
-
2026-06-15days on market $279,000 Active 34 DOM
-
2026-06-14days on market $279,000 Active 32 DOM
-
2026-06-10days on market $279,000 Active 29 DOM
-
2026-06-09days on market $279,000 Active 28 DOM
-
2026-06-08days on market $279,000 Active 27 DOM
-
2026-06-07days on market $279,000 Active 26 DOM
-
2026-06-03days on market $279,000 Active 22 DOM
-
2026-06-02days on market $279,000 Active 21 DOM
-
2026-06-01days on market $279,000 Active 20 DOM
-
2026-05-31days on market $279,000 Active 19 DOM
-
2026-05-31days on market $279,000 Active 18 DOM
-
2026-05-12$279,000 Active 348-char remark
-
2017-04-11soldstatus $41,000 Sold 444-char remark
Show marketing remark (444 chars)
Looking for a fixer upper located near US 421 and I-64 with easy access to Lexington and Frankfort in the community of Midway. This may just be the home. House sits on a large fenced in lot. Home features 3 rooms that have been used as bedrooms, a living room, and a room that could be used as a laundry room or dining area. With TLC this would be a great starter home or rental property. Property is being sold as is. Schedule a showing today.
-
2017-04-11soldstatus $41,000
Show marketing remark (444 chars)
Looking for a fixer upper located near US 421 and I-64 with easy access to Lexington and Frankfort in the community of Midway. This may just be the home. House sits on a large fenced in lot. Home features 3 rooms that have been used as bedrooms, a living room, and a room that could be used as a laundry room or dining area. With TLC this would be a great starter home or rental property. Property is being sold as is. Schedule a showing today.
-
2017-03-20status Pending 444-char remark
Show marketing remark (444 chars)
Looking for a fixer upper located near US 421 and I-64 with easy access to Lexington and Frankfort in the community of Midway. This may just be the home. House sits on a large fenced in lot. Home features 3 rooms that have been used as bedrooms, a living room, and a room that could be used as a laundry room or dining area. With TLC this would be a great starter home or rental property. Property is being sold as is. Schedule a showing today.
-
2017-03-14$45,500 Active 444-char remark
Show marketing remark (444 chars)
Looking for a fixer upper located near US 421 and I-64 with easy access to Lexington and Frankfort in the community of Midway. This may just be the home. House sits on a large fenced in lot. Home features 3 rooms that have been used as bedrooms, a living room, and a room that could be used as a laundry room or dining area. With TLC this would be a great starter home or rental property. Property is being sold as is. Schedule a showing today.
ⓘ Source: listings_history table (triggers on properties + properties_extension) + one-shot
backfill from property_details.listing_events for pre-trigger history.
Tax reassessment forecast KY · Resets to sale price
- Current annual tax
- $1,632 · $136/mo
- Projected year-2 tax
- $2,399 · $200/mo
- Expected delta
- +$768/yr (+$64/mo · 47.1%)
ⓘ Screening estimate from a state-policy table — verify with the county assessor before closing.
Climate risk First Street
- Flood 1/10 Low FEMA zone X (unshaded) · 0% chance over 30 yrs
- Wildfire 2/10 Low
- Heat 4/10 Moderate 7 d/yr ≥102°F today · 19 d/yr by 30 yrs out
- Wind 2/10 Low 2% chance of damaging wind over 30 yrs
- Air quality 2/10 Low 0 unhealthy d/yr today · 1 by 30 yrs out
Nearby sold comps map
Loading sold comps map…
Walkable amenities ~0.75 mi
Loading nearby amenities…
Taxation est. · year 1
- Rental income
- $26,400
- − Mortgage interest
- −$15,628
- − Property taxes
- −$1,632
- − Insurance
- −$1,395
- − Repairs & maintenance
- −$2,112
- − Management
- −$2,112
- − Depreciation
- −$8,116
- Taxable loss
- −$4,595
- Est. tax savings @ 24.0%
- +$1,103
- After-tax cash flow
- $1,375/yr
For passive investors: Depreciation is non-cash, so a rental often shows a tax loss while cash-flowing — sheltering income. Rental losses are passive: they offset passive income freely, and up to $25,000/yr can offset ordinary (W-2) income if you actively participate and your MAGI is under $100k (phasing out to $0 by $150k); unused losses carry forward. On sale, claimed depreciation is recaptured at up to 25%, and gains may owe capital-gains tax (a 1031 exchange can defer both). Figures are a year-1 estimate at your 24.0% rate — not tax advice; consult a CPA.
Schools (NCES district)
- District
- Woodford County
- NCES district ID
- 2106000
- Math proficiency
- 45% ▼ -15.00%
- Reading proficiency
- 52% ▼ -14.00%
- Median HH income
- $57,392
- Composite
- 42.23/100
- National rank
- #3281
- State rank
- #9 of 165 in KY
Livability — Midway
- Score
- 71/100
- State rank
- #151
- US rank
- #7212
Category grades
Schools grade is shown separately in the Schools card above.
Census & demographics
- Census place
- Midway, KY
- Population (ZIP)
- 4,004
Population outlook (Woodford County) Hauer SSP2
- Today (2025)
- 27,906 people
- By 2030
- 28,718 · +2.9%
- By 2040
- 29,854 · +7.0%
- By 2050
- 30,537 · +9.4%
- By 2075
- 32,563 · +16.7%
- By 2100
- 32,186 · +15.3%
Race, ethnicity, and origin ACS 2023
- Neighborhood character
- Predominantly White (86%)
- Race & ethnicity
- White 86% Two or more races 5% Black 5% Hispanic / Latino 4%
- Common ancestry
- Slovak 4% Italian 3% Serbian 3%
- Foreign-born
- 9% · Canada
- Languages at home
- 94% English-only · Spanish 5%
Political lean MEDSL · Woodford
- 2024 margin
- R (+14.3) · D 41.9% · R 56.2% · Other 1.9%
- 2008→2024 swing
- +2.8pp toward D · 2008: -17.1pp · 2024: -14.3pp
- All cycles
- 2024: R+14.3 2020: R+12.0 2016: R+20.2 2012: R+18.9 2008: R+17.1
Not yet ingested
- Civics
- —
Market trends
- HPI YoY
- ▼ -113.33%
- Current HPI
- 131.147
- Rent YoY
- —
- Metro
- —
- State GDP YoY
- ▲ 1.81%
- F500 in state
- 4
Industry mix (Fortune 500 HQ in KY)
| Industry | F500 HQs | Revenue |
|---|---|---|
| Healthcare | 1 | $118B |
|
||
| Food / Beverage | 1 | $7B |
|
||
Price history
+513.2% since first listed5 events — show timeline
- 2026-06-08 Sold (Public Records) $279,000 Public Records
- 2017-04-11 Sold (Public Records) $41,000 Public Records
- 2017-04-11 Sold (MLS) $41,000 ImagineMLS
- 2017-03-20 Pending — ImagineMLS
- 2017-03-14 Listed $45,500 ImagineMLS
Property tax history
+18.6%/yrLatest (2025): $1,632 · +18.5% YoY. Source: county tax records.
Cash-flow waterfall
monthlySold comps — $/sqft
last 12 mo · ≤1 miLoading sold comps…