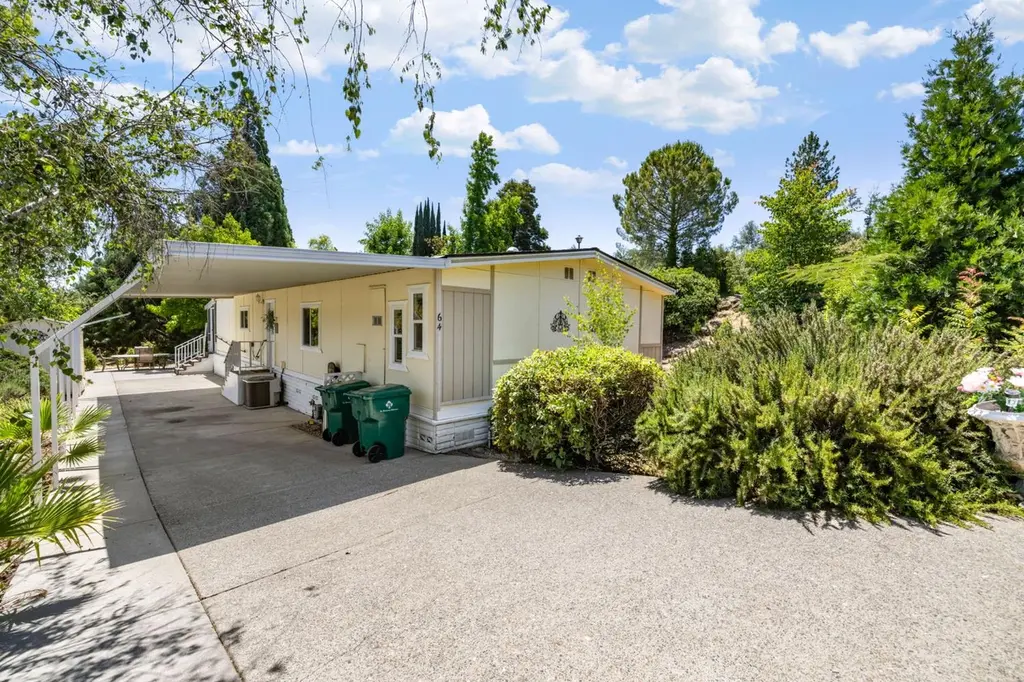
4700 Old French Town Rd #64 · Diamond Springs, CA
Flood risk 1/10 · Minimal
- FEMA flood zone
- X (unshaded)
- Chance of flooding over 30 yrs
- 0.0%
- Est. flood insurance / yr
- $507 – $1,088
Fire risk 10/10 · Severe
- Est. fire insurance / yr
- $659 – $1,223
Heat risk 6/10 · Moderate
- Hot days now (above 100°F)
- 7 days/yr
- Hot days in 30 yrs
- 15 days/yr
Wind risk 1/10 · Minimal
- Chance of severe wind over 30 yrs
- —
Air-quality risk 10/10 · Severe
- Unhealthy air days now
- 26 days/yr
- Unhealthy air days in 30 yrs
- 30 days/yr
Risk factors via First Street. Map © Google.
Why this score? — see what drove the B- grade
The composite is a weighted blend of 9 inputs, each scored 0–100. Each bar is that input's sub-score; the figure is the points it added to the 100-point composite (weight × sub-score).
- Cash flow +30.0/30.0
- DSCR +10.0/10.0
- 1% rule +8.7/10.0
- ARV discount +7.5/15.0
- Schools +5.1/10.0
- Rent growth +3.2/5.0
- Condition / age +2.5/5.0
- Livability +2.4/5.0
- Appreciation +0.0/10.0
$159,900
🖨 Deal sheet (PDF) 📄 Offer letter ✓ Due diligence
Listing remarks
Discover comfortable 55+ living in this double-wide home located in a well-maintained community that backs directly to a peaceful lake. The exterior has recently been painted as well as some repairs made. Inside, you'll find 2 bedrooms and 2 bathrooms, enhanced with plush, upgraded carpet and newer dual-pane windows for added comfort and efficiency. The updated kitchen offers modern touches and excellent functionality. An enclosed, covered back patio provides additional versatile space to relax and enjoy the peaceful setting. Storage is abundant with multiple interior storage options plus an exterior shed. A spacious covered carport accommodates up to two vehicles. A wonderful opportunity t
Key facts
- Backs to lake
- Double-wide home
- Exterior shed
Tags
Property features AI
Finance
- Other: Address: 4700 Old French Town Rd #64, Shingle Springs, CA 95682; Cross street: Old French Town Rd; Directions: GPS
- HOA & community: No homeowners association; Not a senior community; Land lease: No
Exterior
- Parking: Covered parking; no garage
- Utilities: Public water; Public sewer; 220V outlet in kitchen; Cable connected
- Home design: Manufactured in park; Double wide; Built in 1978
- Construction: Vinyl skirting; Fuqua manufactured unit
- Exterior features: Composition roof; Landscape features; Shed(s)
Interior
- Kitchen: Stone countertops; Free-standing gas range; Free-standing refrigerator; Dishwasher; Disposal; Microwave; Plumbed for ice maker
- Bedrooms: 2 bedrooms
- Flooring: Carpet; Laminate; Linoleum
- Bathrooms: 2 full bathrooms; Shower stall(s)
- Heating & cooling: Central heating; Fireplace heating; Central cooling; Ceiling fans
- Interior features: Screened-in patio; Dual-pane full windows; Living room fireplace (wood burning)
- Laundry & utility: Laundry inside the home; Gas water heater
Neighborhood map
What this means for you Summary
Snapshot
- This is a 2-bed/2.0-bath manufactured listed at $160k.
Deal economics
- At list price, monthly cash flow is $790 ($9k/yr) — positive.
- The deal already cash-flows at list — no discount required.
- Meets the 1% rule at list price ($2k rent vs $160k).
- Recommended offer: $158k (1.5% below list) — sets the bar for market timing.
- Cap rate 12.2% vs local median 2.3% in Diamond Springs — top-decile yield for the area; either an underpriced asset or a hidden risk that comps aren't pricing in. Stress-test before assuming the spread holds.
Location & tenants
- Location reads 47/100 on livability (#1,239 in CA) — a working-class tenant base; expect higher turnover. Strengths: housing B+; Watch: schools D, crime D-, amenities F.
- El Dorado Union High (suburban): math 44% / reading 69% proficiency, ranked #89 of 517 in CA (top 17%) — acceptable for families but not a draw, mixed tenant base, ~2y average lease.
- Market conditions: Rents rising (+2.9%/yr); 237 active listings in the ZIP; high-income renter base; 437 units permitted in El Dorado County in 2024 (0 in 5+ unit buildings).
Forward outlook
- Local home prices are declining (-3.0%/yr); year-one equity from $1k of loan paydown is wiped out by about $5k of value loss. Plan a longer hold.
- El Dorado County population projected to shrink 3% by 2050 — rents likely to lag national; underwrite the cash flow, not the appreciation.
- At projected returns (-3.0% appreciation + 2.9% rent growth), your $45k cash investment doubles in ~6 years — after that, you're playing with house money.
Negotiation context
- It's been on market 16 days — a 2% lower offer ($158k) is reasonable based on typical stale-listing flexibility.
Risks & watch-outs
- Climate carrying-cost: severe wildfire risk; extreme-heat days projected 7→15/yr by 2055 (HVAC capex compounding) — expect insurance premiums to compound above CPI over the hold.
Questions for the listing agent
- Built in 1978 — when were the roof, HVAC, electrical panel, plumbing, and water heater last replaced?
- Is there a deadline driving the sale (1031 exchange, divorce, estate, relocation)? That informs how much negotiation room exists.
- Schools are D-rated, which usually means shorter tenancies and higher turnover. Who's the typical renter profile here, and what's been the actual vacancy rate?
- Crime grade is D in this area — have there been break-ins, vandalism, or insurance claims at this property in the last 3 years? What carrier currently insures it and at what premium?
- What's the average days-on-market for RENTAL listings here right now (not sales)? A rising rental-DOM trend means longer vacancies and softer asking-rent achievability than the comps imply.
- What's the recent tenant-quality profile in this submarket — average credit score on applications, eviction rate, late-payment / NSF rate, and stable-employment percentage? A property-management company in the area should have these aggregated.
- How much new for-sale + rental construction is in the pipeline within 1–3 miles? Heavy new supply typically softens prices + rents 12–24 months out; constrained supply supports both.
Investment metrics
- 1% rule
- 1.37% ✓
- Cap rate
- 12.22%
- Cash-on-cash
- 21.17%
- DSCR
- 1.94
- GRM
- 6.1
CMA / ARV
No comps found within radius.
Projected returns pro-forma
-3.0% appreciation · 2.86% rent growth · sell at horizon
- IRR
- 13.5%
- Equity multiple
- 1.54×
- Total profit
- $24,028
- Equity at exit
- $23,842
- IRR
- 22.2%
- Equity multiple
- 2.88×
- Total profit
- $84,167
- Equity at exit
- $13,825
Cash invested: $44,772 (down + closing). Projections, not guarantees.
Landlord ↔ Tenant lean methodology
- Overall (STATE)
- 18 Strongly Tenant-Friendly
- State California
- 18 Strongly Tenant-Friendly · D+13
- County
- — inherits STATE
- City
- — inherits STATE
ZIP-level market 95682
- Rents YoY
- 2.9%
- Active inventory
- 237
- Price-to-rent
- 6.1×
Monthly cashflow live
- Estimated rent
- $2,183 medium interval (Pro) →
- Mortgage (P&I)
- −$839
- Tax from tax record
- −$30 /mo · $356/yr
- Insurance
- −$67
- HOA
- −$0
- Vacancy / Maint / Mgmt
- −$459
- Net cashflow
- $790
Break-even live
Sensitivity live
| Price | -10% $881 | -5% $835 | +0% $790 | +5% $745 | +10% $700 |
|---|---|---|---|---|---|
| Rent | -10% $618 | -5% $704 | +0% $790 | +5% $876 | +10% $963 |
| Rate | -1.0pp $871 | -0.5pp $831 | base $790 | +0.5pp $749 | +1.0pp $706 |
UW: 25.0% down · 7.5% · 30yr · 1.5% tax · 5.0% vac · 8.0% maint · 8.0% mgmt
Financing live
Cash to close
- Down payment
- $39,975
- Closing costs
- $4,797
- Reserves months
- —
- Total cash needed
- —
Loan-product check · same deal, 3 products live
Conventional
25% down · 7.5% · 30yr
- Down + closing
- —
- Monthly P&I
- —
- Monthly cashflow
- —
- DSCR
- —
- Eligible?
- —
Personal DTI + credit; lowest rate.
DSCR
20% down · 8.5% · 30yr
- Down + closing
- —
- Monthly P&I
- —
- Monthly cashflow
- —
- DSCR
- —
- Eligible?
- —
No personal income docs; deal must DSCR.
Hard money
10% down · 12.0% · 12mo
- Down + closing
- —
- Monthly P&I
- —
- Monthly cashflow
- —
- DSCR
- —
- Eligible?
- —
Short-term bridge; refi at stabilization.
Listing history 10 events
-
2026-06-21days on market $159,900 Active 16 DOM
-
2026-06-18days on market $159,900 Active 13 DOM
-
2026-06-17days on market $159,900 Active 12 DOM
-
2026-06-16days on market $159,900 Active 11 DOM
-
2026-06-15days on market $159,900 Active 10 DOM
-
2026-06-13days on market $159,900 Active 8 DOM
-
2026-06-09days on market $159,900 Active 4 DOM
-
2026-06-08days on market $159,900 Active 3 DOM
-
2026-06-07pricedays on market $159,900 Active 2 DOM
-
2026-05-31days on market $169,900 Active 87 DOM
ⓘ Source: listings_history table (triggers on properties + properties_extension) + one-shot
backfill from property_details.listing_events for pre-trigger history.
Tax reassessment forecast CA · Resets to sale price
- Current annual tax
- $356 · $30/mo
- Projected year-2 tax
- $1,215 · $101/mo
- Expected delta
- +$859/yr (+$72/mo · 241.3%)
ⓘ Screening estimate from a state-policy table — verify with the county assessor before closing.
Climate risk First Street
- Flood 1/10 Low FEMA zone X (unshaded) · 0% chance over 30 yrs
- Wildfire 10/10 Extreme
- Heat 6/10 Major 7 d/yr ≥100°F today · 15 d/yr by 30 yrs out
- Wind 1/10 Low
- Air quality 10/10 Extreme 26 unhealthy d/yr today · 30 by 30 yrs out
Nearby sold comps map
Loading sold comps map…
Walkable amenities ~0.75 mi
Loading nearby amenities…
Taxation est. · year 1
- Rental income
- $26,200
- − Mortgage interest
- −$8,957
- − Property taxes
- −$356
- − Insurance
- −$800
- − Repairs & maintenance
- −$2,096
- − Management
- −$2,096
- − Depreciation
- −$4,652
- Taxable income
- $7,244
- Est. tax owed @ 24.0%
- −$1,739
- After-tax cash flow
- $7,742/yr
For passive investors: Depreciation is non-cash, so a rental often shows a tax loss while cash-flowing — sheltering income. Rental losses are passive: they offset passive income freely, and up to $25,000/yr can offset ordinary (W-2) income if you actively participate and your MAGI is under $100k (phasing out to $0 by $150k); unused losses carry forward. On sale, claimed depreciation is recaptured at up to 25%, and gains may owe capital-gains tax (a 1031 exchange can defer both). Figures are a year-1 estimate at your 24.0% rate — not tax advice; consult a CPA.
Schools (NCES district)
- District
- El Dorado Union High
- NCES district ID
- 0612070
- Math proficiency
- 44% ▼ -11.00%
- Reading proficiency
- 69% ▬ 0.00%
- Median HH income
- $78,936
- Composite
- 50.84/100
- National rank
- #1798
- State rank
- #89 of 517 in CA
Livability — Diamond Springs
- Score
- 47/100
- State rank
- #1239
- US rank
- #26264
Category grades
Schools grade is shown separately in the Schools card above.
Census & demographics
- County
- El Dorado County · 144,198 people
- City population
- 35,031
- Metro
- Sacramento-Roseville-Folsom, CA
- Population (ZIP)
- 30,065
- Household income
- $122,436
- Rent vs Own
- Severe rent burden
- 634.0
Population outlook (El Dorado County) Hauer SSP2
- Today (2025)
- 191,666 people
- By 2030
- 193,662 · +1.0%
- By 2040
- 192,583 · +0.5%
- By 2050
- 185,904 · -3.0%
- By 2075
- 169,543 · -11.5%
- By 2100
- 139,623 · -27.2%
Race, ethnicity, and origin ACS 2023
- Neighborhood character
- Predominantly White (80%)
- Race & ethnicity
- White 80% Hispanic / Latino 13% Two or more races 8% Asian 2%
- Hispanic origin (detail)
- Mexican 9%
- Common ancestry
- Lithuanian 3% Portuguese 3% Italian 3%
- Foreign-born
- 5% · Canada, China
- Languages at home
- 93% English-only · Spanish 3% German/W. Germanic 1% Chinese 1%
Political lean MEDSL · El Dorado
- 2024 margin
- R (+12.0) · D 42.6% · R 54.6% · Other 2.8%
- 2008→2024 swing
- -1.5pp toward R · 2008: -10.5pp · 2024: -12.0pp
- All cycles
- 2024: R+12.0 2020: R+8.8 2016: R+13.9 2012: R+18.2 2008: R+10.5
Not yet ingested
- Civics
- —
Market trends
- HPI YoY
- ▼ -417.68%
- Current HPI
- 279.3817
- Rent YoY
- ▲ 2.86%
- Metro
- Sacramento-Roseville-Folsom, CA
- State GDP YoY
- ▲ 3.21%
- F500 in state
- 116
Industry mix (Fortune 500 HQ in CA)
| Industry | F500 HQs | Revenue |
|---|---|---|
| Technology | 27 | $1,492B |
|
||
| Financial Services | 3 | $174B |
|
||
| Retail | 3 | $44B |
|
||
| Insurance | 3 | $26B |
|
||
| Media / Entertainment | 2 | $115B |
|
||
| Pharmaceuticals / Biotech | 2 | $62B |
|
||
Property tax history
-1.8%/yrLatest (2023): $356 · +9.5% YoY. Source: county tax records.
Cash-flow waterfall
monthlySold comps — $/sqft
last 12 mo · ≤1 miLoading sold comps…