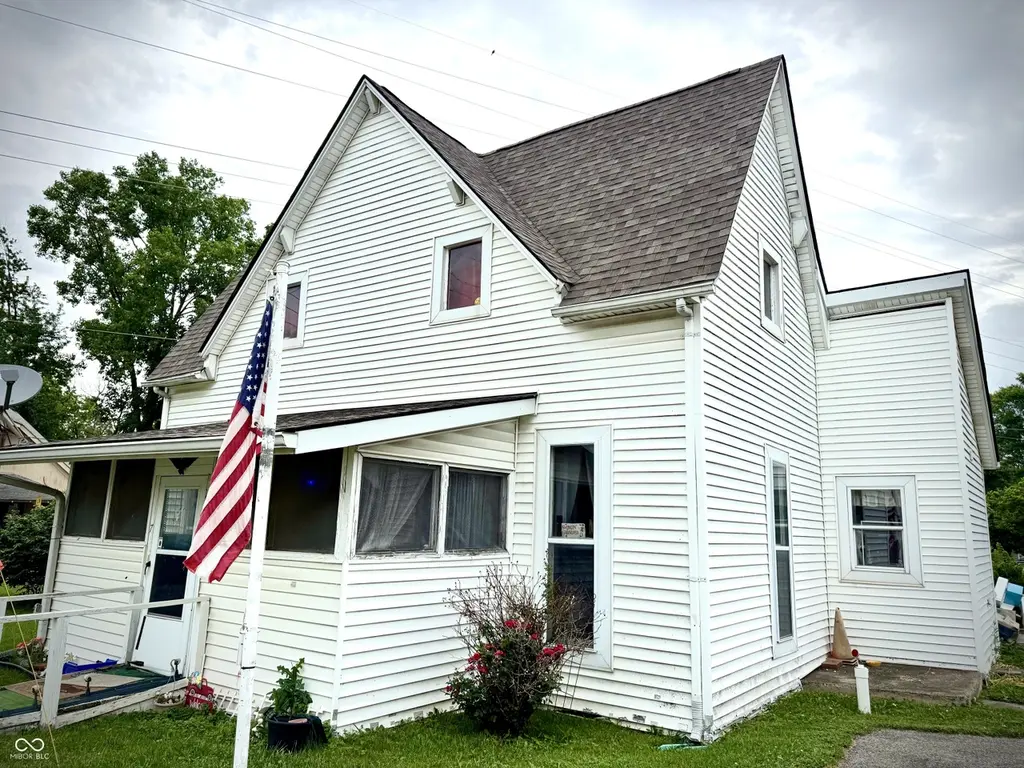
7 N Main St · Whitestown, IN
Flood risk 1/10 · Minimal
- FEMA flood zone
- X (unshaded)
- Chance of flooding over 30 yrs
- 0.0%
- Est. flood insurance / yr
- $473 – $860
Fire risk 1/10 · Minimal
- Est. fire insurance / yr
- $717 – $1,331
Heat risk 3/10 · Minor
- Hot days now (above 101°F)
- 7 days/yr
- Hot days in 30 yrs
- 18 days/yr
Wind risk 2/10 · Minimal
- Chance of severe wind over 30 yrs
- 0.0%
Air-quality risk 3/10 · Minor
- Unhealthy air days now
- 2 days/yr
- Unhealthy air days in 30 yrs
- 3 days/yr
Risk factors via First Street. Map © Google.
Why this score? — see what drove the B+ grade
The composite is a weighted blend of 9 inputs, each scored 0–100. Each bar is that input's sub-score; the figure is the points it added to the 100-point composite (weight × sub-score).
- Cash flow +30.0/30.0
- ARV discount +15.0/15.0
- DSCR +10.0/10.0
- 1% rule +8.9/10.0
- Schools +3.7/10.0
- Livability +3.7/5.0
- Rent growth +2.7/5.0
- Condition / age +2.5/5.0
- Appreciation +0.0/10.0
$180,000
🖨 Deal sheet 📄 Offer letter ✓ Due diligence
Listing remarks
Opportunity awaits in the heart of Whitestown! This 2-bedroom, 1-bath home is full of potential and ready for your vision. Situated on a spacious corner lot with no HOA or subdivision restrictions, this property offers the perfect chance for investors, flippers, or buyers looking to build equity through renovation. The home features a functional layout, covered front porch, and plenty of outdoor space to create your ideal setting. Conveniently located on Main Street and within walking distance to local restaurants, shops, and community amenities, you'll enjoy small-town charm with easy access to everything Whitestown has to offer. Bring your ideas and transform this fixer-upper into someth
Key facts
- Covered front porch
- Outdoor space
- Corner lot
Tags
Property features AI
Finance
- Other: Property listed as a fixer
Exterior
- Parking: Attached 2-car garage (approx. 400 sq ft)
- Utilities: Public water; Municipal sewer
- Home design: Single-family residence; One level with loft
- Construction: Vinyl siding; Block foundation
- Exterior features: Covered patio/porch; Corner lot
Interior
- Kitchen: Kitchen (21x10)
- Bedrooms: Two bedrooms total — one on the main level and one on the upper level
- Bathrooms: One full bathroom (main level)
- Heating & cooling: Forced air heat; Central air conditioning
- Interior features: Attic access
- Laundry & utility: Main-level laundry room (15x10)
Neighborhood map
What this means for you Summary
Snapshot
- This is a 4-bed/1.0-bath single-family listed at $180k.
Deal economics
- At list price, monthly cash flow is $895 ($11k/yr) — positive.
- The deal already cash-flows at list — no discount required.
- Meets the 1% rule at list price ($2k rent vs $180k).
- Cap rate 12.3% vs local median 4.3% in Whitestown — top-decile yield for the area; either an underpriced asset or a hidden risk that comps aren't pricing in. Stress-test before assuming the spread holds.
Location & tenants
- Location reads 73/100 on livability (#109 in IN) — a middle-class / working-renter tenant base. Strengths: employment A+, housing A+, cost of living A; Watch: amenities F, commute F, health & safety F.
- Lebanon Community School Corporation (town): math 41% / reading 44% proficiency, ranked #115 of 301 in IN (top 38%) — families likely to look elsewhere, expect single-tenant / working-renter base with shorter leases.
- Zoned schools: Lebanon Senior High School (math 43% / reading 68%, grade C, #75 of 369 statewide, top 20%, 1,027 students, 38% FRL) — zoned schools at 38% FRL track the district average.
- Zoned-school proficiency averages 56% at this address vs 42% district-wide (+13 pts) — the actual schools serving this property are materially stronger than the Lebanon Community School Corporation average implies; a family-tenant draw the district grade alone would hide.
- Market conditions: Rents flat; 268 active listings in the ZIP; 9 comparable units currently listed for rent nearby; rentals leasing fast (median 4d on market — plan ~1-2 weeks tenant-placement turnaround); high-income renter base; 898 units permitted in Boone County in 2024 (0 in 5+ unit buildings).
Forward outlook
- Local home prices are declining (-3.0%/yr); year-one equity from $1k of loan paydown is wiped out by about $5k of value loss. Plan a longer hold.
- Boone County population projected at +46% by 2050 — long-run rental-demand tailwind backs the buy-and-hold thesis.
- At projected returns (-3.0% appreciation + 0.8% rent growth), your $50k cash investment doubles in ~7 years — after that, you're playing with house money.
Negotiation context
- Only 10 days on market — expect competitive offers; lowballing is unlikely to land.
Risks & watch-outs
- Watch-outs: built in 1950 — expect roof / HVAC / electrical / plumbing capex.
Questions for the listing agent
- Built in 1950 — when were the roof, HVAC, electrical panel, plumbing, and water heater last replaced?
- Is there a deadline driving the sale (1031 exchange, divorce, estate, relocation)? That informs how much negotiation room exists.
- Schools are A-rated — typically a magnet for longer-tenancy family renters. What's the average tenant stay here, and is there a school-zone premium baked into asking?
- What's the average days-on-market for RENTAL listings here right now (not sales)? A rising rental-DOM trend means longer vacancies and softer asking-rent achievability than the comps imply.
- What's the recent tenant-quality profile in this submarket — average credit score on applications, eviction rate, late-payment / NSF rate, and stable-employment percentage? A property-management company in the area should have these aggregated.
- How much new for-sale + rental construction is in the pipeline within 1–3 miles? Heavy new supply typically softens prices + rents 12–24 months out; constrained supply supports both.
Investment metrics
- 1% rule
- 1.39% ✓
- Cap rate
- 12.26%
- Cash-on-cash
- 21.31%
- DSCR
- 1.95
- GRM
- 6.0
CMA / ARV
- ARV (on-the-fly)
- $334,544
- Comps found
- 12
Show comp detail 12 sales within ~0.75 mi
| Address | Dist | Beds/Ba | Sqft | Sold | Price | $/sf | Match |
|---|---|---|---|---|---|---|---|
| 202 S Buck St | 0.23mi | 3/2.0 (-1) | 1,534 (+6%) | 6mo | $320,000 | $209 | 65 |
| 2600 Redding Dr | 0.53mi | 3/2.0 (-1) | 1,495 (+4%) | 2mo | $335,000 | $224 | 59 |
| 6288 Flag Stop Dr | 0.57mi | 3/2.0 (-1) | 1,503 (+4%) | 2mo | $356,877 | $237 | 56 |
| 6460 Dusty Laurel Dr | 0.57mi | 3/2.0 (-1) | 1,511 (+5%) | 1mo | $282,000 | $187 | 55 |
| 6047 Granby Dr | 0.48mi | 3/2.0 (-1) | 1,503 (+4%) | 8mo | $363,400 | $242 | 55 |
| 6155 Flag Stop Dr | 0.58mi | 3/2.0 (-1) | 1,503 (+4%) | 3mo | $354,900 | $236 | 54 |
| 2572 Kingman Dr | 0.59mi | 3/2.0 (-1) | 1,503 (+4%) | 7mo | $365,000 | $243 | 50 |
| 2657 Lamar Dr | 0.32mi | 3/2.5 (-1) | 1,638 (+14%) | 2mo | $297,500 | $182 | 49 |
| 2549 Plano Dr | 0.41mi | 3/2.0 (-1) | 1,235 (-14%) | 6mo | $299,000 | $242 | 43 |
| 6328 Dusty Laurel Dr | 0.60mi | 3/2.0 (-1) | 1,648 (+14%) | 4mo | $320,000 | $194 | 36 |
| 6677 E 225 S | 0.68mi | 3/2.0 (-1) | 1,250 (-13%) | 8mo | $290,000 | $232 | 31 |
| 3696 White Cliff Way | 0.75mi | 3/2.0 (-1) | 1,250 (-13%) | 6mo | $275,000 | $220 | 29 |
Match score weights: distance 35% · size 25% · config 20% · recency 20%. Top-matched comps best support the ARV.
Projected returns pro-forma
-3.0% appreciation · 0.77% rent growth · sell at horizon
- IRR
- 11.4%
- Equity multiple
- 1.44×
- Total profit
- $22,297
- Equity at exit
- $26,839
- IRR
- 18.7%
- Equity multiple
- 2.41×
- Total profit
- $71,045
- Equity at exit
- $15,563
Cash invested: $50,400 (down + closing). Projections, not guarantees.
Landlord ↔ Tenant lean methodology
- Overall (STATE)
- 90 Strongly Landlord-Friendly
- State Indiana
- 90 Strongly Landlord-Friendly · R+11
- County
- — inherits STATE
- City
- — inherits STATE
ZIP-level market 46075
- Home prices YoY
- -20.0%
- Rents YoY
- 0.8%
- Active inventory
- 268
- Price-to-rent
- 6.0×
Monthly cashflow live
- Estimated rent
- $2,500 high interval (Pro) →
- Mortgage (P&I)
- −$944
- Tax from tax record
- −$61 /mo · $728/yr
- Insurance
- −$75
- HOA
- −$0
- Vacancy / Maint / Mgmt
- −$525
- Net cashflow
- $895
Break-even live
UW: 25.0% down · 7.5% · 30yr · 1.5% tax · 5.0% vac · 8.0% maint · 8.0% mgmt
Financing live
Cash to close
- Down payment
- $45,000
- Closing costs
- $5,400
- Reserves months
- —
- Total cash needed
- —
Loan-product check · same deal, 3 products live
Conventional
25% down · 7.5% · 30yr
- Down + closing
- —
- Monthly P&I
- —
- Monthly cashflow
- —
- DSCR
- —
- Eligible?
- —
Personal DTI + credit; lowest rate.
DSCR
20% down · 8.5% · 30yr
- Down + closing
- —
- Monthly P&I
- —
- Monthly cashflow
- —
- DSCR
- —
- Eligible?
- —
No personal income docs; deal must DSCR.
Hard money
10% down · 12.0% · 12mo
- Down + closing
- —
- Monthly P&I
- —
- Monthly cashflow
- —
- DSCR
- —
- Eligible?
- —
Short-term bridge; refi at stabilization.
Rent comps 9 comps
| Address | Beds | Baths | Sqft | Rent | $/sqft | DOM | Units | Dist |
|---|---|---|---|---|---|---|---|---|
| 6389 Wasco Dr Whitestown, IN | 3.0 | 2.5 | 1802 | $2,150 | $1.19 | 4d | 1 | 0.24mi |
| 6296 Granby Dr Whitestown, IN | 3.0 | 2.5 | 1550 | $2,200 | $1.42 | 1d | 1 | 0.36mi |
| 2881 Cross Branch Dr Whitestown, IN | 3.0–4.0 | 2.5 | 1835 | $2,399 | $1.31 | 19d | 4 | 0.46mi |
| 3550 Limelight Ln Whitestown, IN | 3.0 | 2.0 | 1429 | $2,140 | $1.50 | 7d | 1 | 0.68mi |
| 3821 Lilac Ln Whitestown, IN | 1.0–4.0 | 1.0–2.0 | 1165 | $1,709 | $1.47 | 1d | 10 | 0.88mi |
| 3845 Stallion St Whitestown, IN | 3.0 | 2.0 | 1250 | $2,399 | $1.92 | 23d | 1 | 0.89mi |
| 3918 Blue Roan Blvd Whitestown, IN | 1.0–3.0 | 1.0–3.0 | 1000 | $2,550 | $2.55 | 1d | 10 | 0.98mi |
| 3567 Sugar Grove Dr Unit 1542524P Whitestown, IN | 3.0 | 2.0 | 1829 | $3,581 | $1.96 | 3d | 1 | 1.09mi |
| 3835 Dusty Sands Rd Whitestown, IN | 3.0 | 2.0 | 1240 | $2,195 | $1.77 | 23d | 1 | 1.11mi |
Listing history 7 events
-
2026-06-18days on market $180,000 Active 10 DOM
-
2026-06-17days on market $180,000 Active 9 DOM
-
2026-06-16days on market $180,000 Active 8 DOM
-
2026-06-15days on market $180,000 Active 7 DOM
-
2026-06-13days on market $180,000 Active 5 DOM
-
2026-06-09remarks 699-char remark
-
2026-06-09$180,000 Active 1 DOM
ⓘ Source: listings_history table (triggers on properties + properties_extension) + one-shot
backfill from property_details.listing_events for pre-trigger history.
Tax reassessment forecast IN · Partial reset (capped growth)
- Current annual tax
- $728 · $61/mo
- Projected year-2 tax
- $1,129 · $94/mo
- Expected delta
- +$401/yr (+$33/mo · 55.0%)
ⓘ Screening estimate from a state-policy table — verify with the county assessor before closing.
Climate risk First Street
- Flood 1/10 Low FEMA zone X (unshaded) · 0% chance over 30 yrs
- Wildfire 1/10 Low
- Heat 3/10 Moderate 7 d/yr ≥101°F today · 18 d/yr by 30 yrs out
- Wind 2/10 Low 0% chance of damaging wind over 30 yrs
- Air quality 3/10 Moderate 2 unhealthy d/yr today · 3 by 30 yrs out
Nearby sold comps map
Loading sold comps map…
Walkable amenities ~0.75 mi
Loading nearby amenities…
Taxation est. · year 1
- Rental income
- $29,997
- − Mortgage interest
- −$10,083
- − Property taxes
- −$728
- − Insurance
- −$900
- − Repairs & maintenance
- −$2,400
- − Management
- −$2,400
- − Depreciation
- −$5,236
- Taxable income
- $8,250
- Est. tax owed @ 24.0%
- −$1,980
- After-tax cash flow
- $8,762/yr
For passive investors: Depreciation is non-cash, so a rental often shows a tax loss while cash-flowing — sheltering income. Rental losses are passive: they offset passive income freely, and up to $25,000/yr can offset ordinary (W-2) income if you actively participate and your MAGI is under $100k (phasing out to $0 by $150k); unused losses carry forward. On sale, claimed depreciation is recaptured at up to 25%, and gains may owe capital-gains tax (a 1031 exchange can defer both). Figures are a year-1 estimate at your 24.0% rate — not tax advice; consult a CPA.
Schools (NCES district)
- District
- Lebanon Community School Corporation
- NCES district ID
- 1805790
- Math proficiency
- 41% ▼ -11.00%
- Reading proficiency
- 44% ▼ -5.00%
- Median HH income
- $52,178
- Composite
- 36.77/100
- National rank
- #4571
- State rank
- #115 of 301 in IN
Livability — Whitestown
- Score
- 73/100
- State rank
- #109
- US rank
- #5691
Category grades
Schools grade is shown separately in the Schools card above.
Census & demographics
- Census place
- Whitestown, IN
- County
- Boone County · 69,822 people
- City population
- 9,509
- Metro
- Indianapolis-Carmel-Anderson, IN
- Population (ZIP)
- 9,509
- Household income
- $117,002
- Rent vs Own
- Severe rent burden
- 287.0
Population outlook (Boone County) Hauer SSP2
- Today (2025)
- 77,877 people
- By 2030
- 85,185 · +9.4%
- By 2040
- 99,753 · +28.1%
- By 2050
- 113,572 · +45.8%
- By 2075
- 145,674 · +87.1%
- By 2100
- 161,165 · +106.9%
Race, ethnicity, and origin ACS 2023
- Neighborhood character
- Predominantly White (84%)
- Race & ethnicity
- White 84% Two or more races 6% Asian 4% Hispanic / Latino 3% Black 3%
- Common ancestry
- Italian 4% Romanian 3% Slovak 2%
- Foreign-born
- 7% · Canada, China
- Languages at home
- 91% English-only · Other Indo-European 5% Spanish 2% Chinese 1%
Political lean MEDSL · Boone
- 2024 margin
- R (+16.0) · D 41.0% · R 57.0% · Other 2.0%
- 2008→2024 swing
- +9.8pp toward D · 2008: -25.8pp · 2024: -16.0pp
- All cycles
- 2024: R+16.0 2020: R+18.4 2016: R+29.5 2012: R+37.8 2008: R+25.8
Not yet ingested
- Civics
- —
Market trends
- HPI YoY
- ▼ -49.51%
- Current HPI
- 198.3353
- Rent YoY
- ▲ 0.77%
- Metro
- Indianapolis-Carmel-Anderson, IN
- State GDP YoY
- ▲ 2.90%
- F500 in state
- 18
Industry mix (Fortune 500 HQ in IN)
| Industry | F500 HQs | Revenue |
|---|---|---|
| Industrial Machinery | 2 | $37B |
|
||
| Healthcare | 1 | $177B |
|
||
| Pharmaceuticals | 1 | $45B |
|
||
| Metals / Steel | 1 | $18B |
|
||
| Agriculture | 1 | $17B |
|
||
| Packaging | 1 | $12B |
|
||
Price history
1 event — show timeline
- 2026-06-08 Listed $180,000 MIBOR as Distributed by MLS Grid
Property tax history
+43.3%/yrLatest (2025): $728 · +23.9% YoY. Source: county tax records.
Cash-flow waterfall
monthlySold comps — $/sqft
last 12 mo · ≤1 miLoading sold comps…