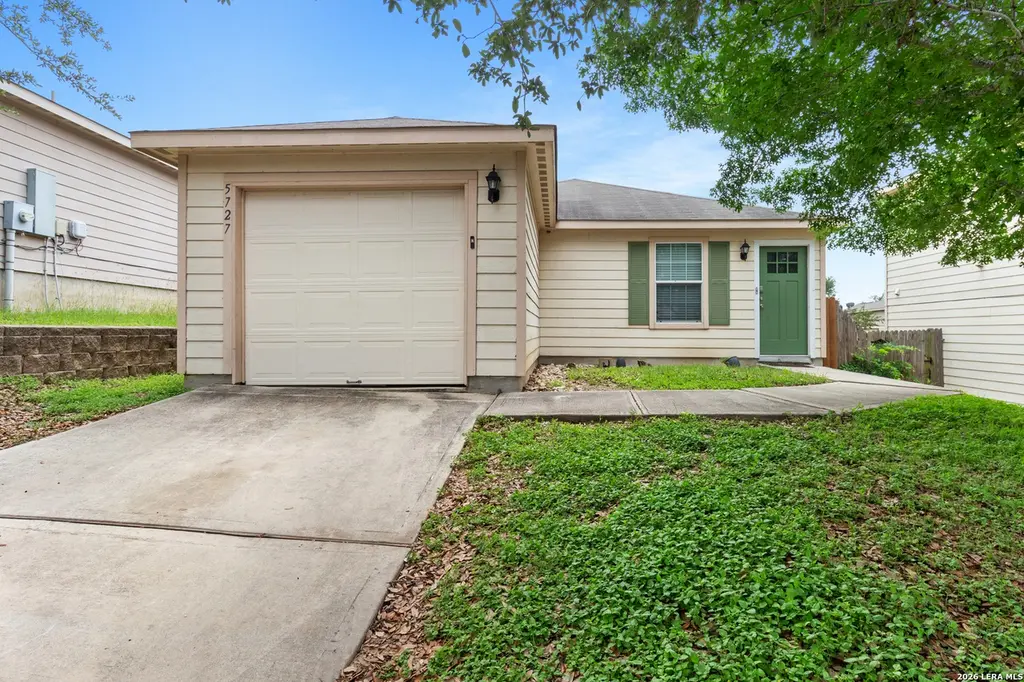
5727 Hickory Cyn · San Antonio, TX
Flood risk 1/10 · Minimal
- FEMA flood zone
- X (unshaded)
- Chance of flooding over 30 yrs
- 0.0%
- Est. flood insurance / yr
- $507 – $1,088
Fire risk 5/10 · Moderate
- Est. fire insurance / yr
- $1,222 – $2,270
Heat risk 8/10 · Major
- Hot days now (above 110°F)
- 7 days/yr
- Hot days in 30 yrs
- 23 days/yr
Wind risk 6/10 · Moderate
- Chance of severe wind over 30 yrs
- 76.0%
Air-quality risk 2/10 · Minimal
- Unhealthy air days now
- 1 days/yr
- Unhealthy air days in 30 yrs
- 1 days/yr
Risk factors via First Street. Map © Google.
Why this score? — see what drove the C grade
The composite is a weighted blend of 9 inputs, each scored 0–100. Each bar is that input's sub-score; the figure is the points it added to the 100-point composite (weight × sub-score).
- Cash flow +16.7/30.0
- ARV discount +15.0/15.0
- 1% rule +5.5/10.0
- DSCR +5.2/10.0
- Appreciation +5.0/10.0
- Livability +4.0/5.0
- Condition / age +2.5/5.0
- Schools +2.2/10.0
- Rent growth +2.1/5.0
$135,000
🖨 Deal sheet (PDF) 📄 Offer letter ✓ Due diligence
Listing remarks MLS
Cozy home with 2 bedroom, 1 bath, and 1 car garage! Open Floor Plan! Laminate wood and vinyl flooring throughout! Refrigerator is included! Enjoy relaxing in the big backyard or while looking at the beautiful views from the front yard! Great location, just off Loop 1604 and close to Lackland AFB and the Toyota Plant.
Key facts
- 4,573 sq ft lot
- Garage
- Built 2008
Property features AI
Finance
- HOA & community: Mandatory HOA; Annual HOA fee of $165; Association transfer fee (one-time) of $120; Community amenities include park/playground, sports court and BBQ/grill
Exterior
- Parking: 1-car garage
- Utilities: Public water system
- Home design: Pre-owned single-family property; Approximately 18 years old
- Construction: Slab foundation; Composition roof
- Exterior features: Privacy fence; Double-pane windows; Brick, 4-sided masonry and cement fiber exterior
Interior
- Kitchen: Stove/Range; Refrigerator; Dishwasher; Garbage disposal
- Bedrooms: Master bedroom approximately 12 x 12; Second bedroom approximately 12 x 12
- Flooring: Vinyl flooring
- Bathrooms: 1 full bathroom
- Heating & cooling: Central heating (electric); Central air conditioning
- Interior features: Open floor plan; Eat-in kitchen; Utility area in garage; Ground-level/no steps; Cable TV available; High-speed internet; All window coverings remain
- Laundry & utility: Washer connection; Dryer connection; Electric water heater
Neighborhood map
What this means for you Summary
Snapshot
- This is a 2-bed/1.0-bath single-family listed at $135k.
Deal economics
- At list price, monthly cash flow is $84 ($1k/yr) — positive.
- The deal already cash-flows at list — no discount required.
- Meets the 1% rule at list price ($1k rent vs $135k).
- Recommended offer: $131k (3.0% below list) — sets the bar for market timing.
- Cap rate 7.0% vs local median 3.8% in San Antonio — top-decile yield for the area; either an underpriced asset or a hidden risk that comps aren't pricing in. Stress-test before assuming the spread holds.
Location & tenants
- Location reads 80/100 on livability (#31 in TX, #1,616 nationally) — a professional / high-income tenant draw. Strengths: amenities A+, commute A+, cost of living A+; Watch: crime F.
- Southwest ISD (rural): math 21% / reading 31% proficiency, ranked #701 of 826 in TX (top 85%) — low school quality limits family demand, transient renter base, plan for 1-2y turnover; 75% free/reduced lunch — lower-income household profile, screen leases tightly.
- Zoned schools: Southwest El (math 38% / reading 33%, grade F, #1,946 of 4,322 statewide, top 45%, 654 students, 73% FRL); Southwest H S (math 17% / reading 39%, grade F, #1,170 of 1,632 statewide, top 72%, 2,152 students, 72% FRL) — zoned schools at 72% FRL track the district average.
- Market conditions: Rents soft (-1.7%/yr); 537 active listings in the ZIP; 12 comparable units currently listed for rent nearby; rentals at typical pace (median 24d on market — plan ~3-4 weeks tenant-placement turnaround); solid renter incomes; 8,308 units permitted in Bexar County in 2024 (2,506 in 5+ unit buildings).
Forward outlook
- In year one you build about $931 of equity ($933 loan paydown + $-2 appreciation (-0.0% local appreciation)).
- Bexar County population projected at +50% by 2050 — long-run rental-demand tailwind backs the buy-and-hold thesis.
Negotiation context
- It's been on market 38 days — a 3% lower offer ($131k) is reasonable based on typical stale-listing flexibility.
- 3 sale attempts since 9y ago with the ask held roughly flat each time — persistent listings suggest the price (not the market) is what's stuck; bring a comps-based counter.
Risks & watch-outs
- Climate carrying-cost: major wind risk, 76% chance of damaging wind over 30y; moderate wildfire risk; extreme-heat days projected 7→23/yr by 2055 (HVAC capex compounding) — expect insurance premiums to compound above CPI over the hold.
Questions for the listing agent
- It's been on market 38 days. Have you received any prior offers? Is the seller open to a 3% concession, seller financing, or rate buy-down credit?
- What does the HOA fee cover, when was the last increase, and are there any pending special assessments or reserve-fund shortfalls?
- Is there a deadline driving the sale (1031 exchange, divorce, estate, relocation)? That informs how much negotiation room exists.
- Crime grade is F in this area — have there been break-ins, vandalism, or insurance claims at this property in the last 3 years? What carrier currently insures it and at what premium?
- What's the average days-on-market for RENTAL listings here right now (not sales)? A rising rental-DOM trend means longer vacancies and softer asking-rent achievability than the comps imply.
- What's the recent tenant-quality profile in this submarket — average credit score on applications, eviction rate, late-payment / NSF rate, and stable-employment percentage? A property-management company in the area should have these aggregated.
- How much new for-sale + rental construction is in the pipeline within 1–3 miles? Heavy new supply typically softens prices + rents 12–24 months out; constrained supply supports both.
Investment metrics
- 1% rule
- 1.05% ✓
- Cap rate
- 7.04%
- Cash-on-cash
- 2.67%
- DSCR
- 1.12
- GRM
- 8.0
CMA / ARV
- ARV (median comp)
- $175,331
- List price
- $135,000
- Delta
- -23.00%
- Verdict
- UNDERPRICED
- Comps
- 20 within 1.0 mi
Show comp detail 6 sales within ~0.75 mi
| Address | Dist | Beds/Ba | Sqft | Sold | Price | $/sf | Match |
|---|---|---|---|---|---|---|---|
| 11218 Magic Cyn | 0.08mi | 2/1.0 | 851 (0%) | 4mo | $144,997 | $170 | 93 |
| 11219 Pecan Cyn | 0.18mi | 2/1.0 | 851 (0%) | 1mo | $149,900 | $176 | 91 |
| 11311 Indian Cyn | 0.08mi | 2/1.0 | 851 (0%) | 14mo | $119,000 | $140 | 84 |
| 11110 Indian Cyn | 0.17mi | 2/1.0 | 851 (0%) | 18mo | $167,900 | $197 | 77 |
| 11306 Fire Cyn | 0.14mi | 2/1.0 | 851 (0%) | 22mo | $159,000 | $187 | 75 |
| 11203 Country Cyn | 0.10mi | 2/1.0 | 968 (+14%) | 19mo | $170,000 | $176 | 56 |
Match score weights: distance 35% · size 25% · config 20% · recency 20%. Top-matched comps best support the ARV.
Projected returns pro-forma
-0.0% appreciation · 0.0% rent growth · sell at horizon
- IRR
- -1.5%
- Equity multiple
- 0.93×
- Total profit
- $-2,673
- Equity at exit
- $39,188
- IRR
- 1.8%
- Equity multiple
- 1.17×
- Total profit
- $6,575
- Equity at exit
- $47,096
Cash invested: $37,800 (down + closing). Projections, not guarantees.
Landlord ↔ Tenant lean methodology
- Overall (STATE)
- 87 Strongly Landlord-Friendly
- State Texas
- 87 Strongly Landlord-Friendly · R+5
- County
- — inherits STATE
- City
- — inherits STATE
ZIP-level market 78252
- Home prices YoY
- -0.0%
- Rents YoY
- -1.7%
- Active inventory
- 537
- Price-to-rent
- 8.0×
Monthly cashflow live
- Estimated rent
- $1,415 high interval (Pro) →
- Mortgage (P&I)
- −$708
- Tax from tax record
- −$255 /mo · $3,065/yr
- Insurance
- −$56
- HOA
- −$14
- Vacancy / Maint / Mgmt
- −$297
- Net cashflow
- $84
Break-even live
Sensitivity live
| Price | -10% $160 | -5% $122 | +0% $84 | +5% $46 | +10% $8 |
|---|---|---|---|---|---|
| Rent | -10% $-28 | -5% $28 | +0% $84 | +5% $140 | +10% $196 |
| Rate | -1.0pp $152 | -0.5pp $118 | base $84 | +0.5pp $49 | +1.0pp $13 |
UW: 25.0% down · 7.5% · 30yr · 1.5% tax · 5.0% vac · 8.0% maint · 8.0% mgmt
Financing live
Cash to close
- Down payment
- $33,750
- Closing costs
- $4,050
- Reserves months
- —
- Total cash needed
- —
Loan-product check · same deal, 3 products live
Conventional
25% down · 7.5% · 30yr
- Down + closing
- —
- Monthly P&I
- —
- Monthly cashflow
- —
- DSCR
- —
- Eligible?
- —
Personal DTI + credit; lowest rate.
DSCR
20% down · 8.5% · 30yr
- Down + closing
- —
- Monthly P&I
- —
- Monthly cashflow
- —
- DSCR
- —
- Eligible?
- —
No personal income docs; deal must DSCR.
Hard money
10% down · 12.0% · 12mo
- Down + closing
- —
- Monthly P&I
- —
- Monthly cashflow
- —
- DSCR
- —
- Eligible?
- —
Short-term bridge; refi at stabilization.
Rent comps 12 comps
| Address | Beds | Baths | Sqft | Rent | $/sqft | DOM | Units | Dist |
|---|---|---|---|---|---|---|---|---|
| 11407 Indian Cyn San Antonio, TX | 3.0 | 2.0 | 1097 | $1,535 | $1.40 | 5d | 1 | 0.12mi |
| 11324 Indian Cyn San Antonio, TX | 2.0 | 1.0 | 851 | $1,200 | $1.41 | 20d | 1 | 0.14mi |
| 11343 Fire Cyn San Antonio, TX | 2.0 | 1.0 | 851 | $1,180 | $1.39 | 24d | 1 | 0.21mi |
| 5706 Red Cyn San Antonio, TX | 2.0 | 1.0 | 968 | $1,295 | $1.34 | 44d | 1 | 0.24mi |
| 11459 Coral Cyn San Antonio, TX | 3.0 | 2.0 | 1097 | $1,500 | $1.37 | 24d | 1 | 0.27mi |
| 6175 Texas Cyn San Antonio, TX | 1.0–4.0 | 1.0–2.0 | 1056 | $1,128 | $1.07 | 24d | 1 | 0.31mi |
| 5607 Forest Cyn San Antonio, TX | 3.0 | 2.0 | 1097 | $1,480 | $1.35 | 44d | 1 | 0.36mi |
| 10858 Quinn Ct San Antonio, TX | 2.0–5.0 | 2.0–3.5 | 1733 | $1,840 | $1.06 | 2d | 1 | 0.96mi |
| 3237 Texas 1604 Loop San Antonio, TX | 1.0 | 1.0 | 826 | $1,345 | $1.63 | 44d | 1 | 1.02mi |
| 12136 W US Highway 90 San Antonio, TX | 2.0 | 1.0–2.0 | 867 | $1,580 | $1.82 | 2d | 21 | 1.13mi |
| 12136 U.S. 90 Unit 710 San Antonio, TX | 2.0 | 2.0 | 967 | $1,658 | $1.71 | 3d | 1 | 1.13mi |
| 12136 U.S. 90 Unit 610 San Antonio, TX | 1.0 | 1.0 | 661 | $1,438 | $2.18 | 3d | 1 | 1.13mi |
HOA detail
- Monthly dues
- $14 · $168/yr
Listing history 21 events
-
2026-06-18days on market $135,000 Active 38 DOM
-
2026-06-17days on market $135,000 Active 37 DOM
-
2026-06-16days on market $135,000 Active 36 DOM
-
2026-06-15days on market $135,000 Active 35 DOM
-
2026-06-13days on market $135,000 Active 33 DOM
-
2026-06-09days on market $135,000 Active 29 DOM
-
2026-06-08days on market $135,000 Active 28 DOM
-
2026-06-07days on market $135,000 Active 27 DOM
-
2026-06-04days on market $135,000 Active 24 DOM
-
2026-06-03days on market $135,000 Active 23 DOM
-
2026-06-02days on market $135,000 Active 22 DOM
-
2026-06-01days on market $135,000 Active 21 DOM
-
2026-05-31days on market $135,000 Active 20 DOM
-
2026-05-11$135,000 New 375-char remark
-
2024-03-06historical $1,295
-
2024-02-25$1,295
-
2017-09-26soldstatus
-
2017-09-25soldstatus Sold 318-char remark
Show marketing remark (318 chars)
Cozy home with 2 bedroom, 1 bath, and 1 car garage! Open Floor Plan! Laminate wood and vinyl flooring throughout! Refrigerator is included! Enjoy relaxing in the big backyard or while looking at the beautiful views from the front yard! Great location, just off Loop 1604 and close to Lackland AFB and the Toyota Plant.
-
2017-09-19status Pending 318-char remark
Show marketing remark (318 chars)
Cozy home with 2 bedroom, 1 bath, and 1 car garage! Open Floor Plan! Laminate wood and vinyl flooring throughout! Refrigerator is included! Enjoy relaxing in the big backyard or while looking at the beautiful views from the front yard! Great location, just off Loop 1604 and close to Lackland AFB and the Toyota Plant.
-
2017-09-03historical Active Option 318-char remark
Show marketing remark (318 chars)
Cozy home with 2 bedroom, 1 bath, and 1 car garage! Open Floor Plan! Laminate wood and vinyl flooring throughout! Refrigerator is included! Enjoy relaxing in the big backyard or while looking at the beautiful views from the front yard! Great location, just off Loop 1604 and close to Lackland AFB and the Toyota Plant.
-
2017-08-28$99,900 New 318-char remark
Show marketing remark (318 chars)
Cozy home with 2 bedroom, 1 bath, and 1 car garage! Open Floor Plan! Laminate wood and vinyl flooring throughout! Refrigerator is included! Enjoy relaxing in the big backyard or while looking at the beautiful views from the front yard! Great location, just off Loop 1604 and close to Lackland AFB and the Toyota Plant.
ⓘ Source: listings_history table (triggers on properties + properties_extension) + one-shot
backfill from property_details.listing_events for pre-trigger history.
Tax reassessment forecast TX · Resets to sale price
- Current annual tax
- $3,065 · $255/mo
- Projected year-2 tax
- $3,065 · $255/mo
- Expected delta
- $0/yr ($0/mo · 0.0%)
ⓘ Screening estimate from a state-policy table — verify with the county assessor before closing.
Climate risk First Street
- Flood 1/10 Low FEMA zone X (unshaded) · 0% chance over 30 yrs
- Wildfire 5/10 Major
- Heat 8/10 Severe 7 d/yr ≥110°F today · 23 d/yr by 30 yrs out
- Wind 6/10 Major 76% chance of damaging wind over 30 yrs
- Air quality 2/10 Low 1 unhealthy d/yr today · 1 by 30 yrs out
Nearby sold comps map
Loading sold comps map…
Walkable amenities ~0.75 mi
Loading nearby amenities…
Taxation est. · year 1
- Rental income
- $16,977
- − Mortgage interest
- −$7,562
- − Property taxes
- −$3,065
- − Insurance
- −$675
- − Repairs & maintenance
- −$1,358
- − Management
- −$1,358
- − HOA
- −$168
- − Depreciation
- −$3,927
- Taxable loss
- −$1,137
- Est. tax savings @ 24.0%
- +$273
- After-tax cash flow
- $1,281/yr
For passive investors: Depreciation is non-cash, so a rental often shows a tax loss while cash-flowing — sheltering income. Rental losses are passive: they offset passive income freely, and up to $25,000/yr can offset ordinary (W-2) income if you actively participate and your MAGI is under $100k (phasing out to $0 by $150k); unused losses carry forward. On sale, claimed depreciation is recaptured at up to 25%, and gains may owe capital-gains tax (a 1031 exchange can defer both). Figures are a year-1 estimate at your 24.0% rate — not tax advice; consult a CPA.
Schools (NCES district)
- District
- Southwest ISD
- NCES district ID
- 4840950
- Math proficiency
- 21% ▼ -21.00%
- Reading proficiency
- 31% ▼ -5.00%
- Median HH income
- $43,362
- Composite
- 22.22/100
- National rank
- #8153
- State rank
- #701 of 826 in TX
Livability — San Antonio
- Score
- 80/100
- State rank
- #31
- US rank
- #1616
Category grades
Schools grade is shown separately in the Schools card above.
Census & demographics
- County
- Bexar County · 1,990,555 people
- City population
- 1,806,925
- Metro
- San Antonio-New Braunfels, TX
- Population (ZIP)
- 21,790
- Household income
- $85,518
- Rent vs Own
- Severe rent burden
- 152.0
Population outlook (Bexar County) Hauer SSP2
- Today (2025)
- 2,336,851 people
- By 2030
- 2,560,728 · +9.6%
- By 2040
- 3,020,569 · +29.3%
- By 2050
- 3,493,522 · +49.5%
- By 2075
- 4,668,459 · +99.8%
- By 2100
- 5,533,242 · +136.8%
Race, ethnicity, and origin ACS 2023
- Neighborhood character
- Predominantly Hispanic (68%)
- Race & ethnicity
- Hispanic / Latino 68% Two or more races 29% White 17% Black 8% Asian 3% Native American 1%
- Hispanic origin (detail)
- Mexican 61% Puerto Rican 1%
- Common ancestry
- Hispanic 2% Lithuanian 1% German 1%
- Foreign-born
- 12% · Canada, South Korea
- Languages at home
- 58% English-only · Spanish 38% Tagalog/Filipino 2% Other Indo-European 1%
Political lean MEDSL · Bexar
- 2024 margin
- Lean D (+9.8) · D 54.3% · R 44.6% · Other 1.1%
- 2008→2024 swing
- +4.2pp toward D · 2008: 5.6pp · 2024: 9.8pp
- All cycles
- 2024: D+9.8 2020: D+18.2 2016: D+13.5 2012: D+4.6 2008: D+5.6
Not yet ingested
- Civics
- —
Market trends
- HPI YoY
- ▬ -0.00%
- Current HPI
- 183.6413
- Rent YoY
- ▼ -1.67%
- Metro
- San Antonio-New Braunfels, TX
- State GDP YoY
- ▲ 3.95%
- F500 in state
- 110
Industry mix (Fortune 500 HQ in TX)
| Industry | F500 HQs | Revenue |
|---|---|---|
| Energy | 16 | $1,198B |
|
||
| Technology | 5 | $198B |
|
||
| Engineering / Construction | 4 | $72B |
|
||
| Energy Services | 3 | $60B |
|
||
| Utilities | 3 | $41B |
|
||
| Healthcare | 2 | $330B |
|
||
Price history
+35.1% since first listed8 events — show timeline
- 2026-05-11 Listed $135,000 LERA
- 2024-03-06 Rental Removed $1,295 Avail
- 2024-02-25 Listed for Rent $1,295 Avail
- 2017-09-26 Sold (Public Records) — Public Records
- 2017-09-25 Sold (MLS) — LERA
- 2017-09-19 Pending — LERA
- 2017-09-03 Contingent — LERA
- 2017-08-28 Listed $99,900 LERA
Property tax history
+6.6%/yrLatest (2025): $3,065 · -4.4% YoY. Source: county tax records.
Cash-flow waterfall
monthlySold comps — $/sqft
last 12 mo · ≤1 miLoading sold comps…