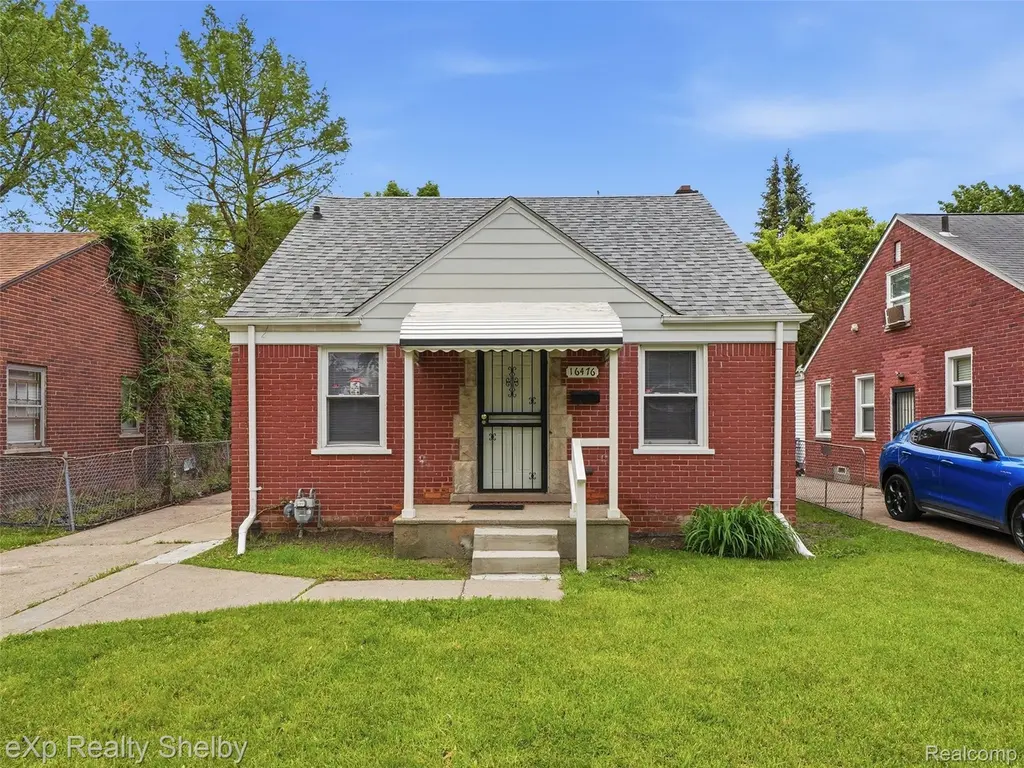
16476 Rossini Dr · Detroit, MI
Flood risk 1/10 · Minimal
- FEMA flood zone
- X (unshaded)
- Chance of flooding over 30 yrs
- 0.0%
- Est. flood insurance / yr
- $473 – $860
Fire risk 1/10 · Minimal
- Est. fire insurance / yr
- $784 – $1,456
Heat risk 3/10 · Minor
- Hot days now (above 96°F)
- 7 days/yr
- Hot days in 30 yrs
- 15 days/yr
Wind risk 2/10 · Minimal
- Chance of severe wind over 30 yrs
- —
Air-quality risk 3/10 · Minor
- Unhealthy air days now
- 3 days/yr
- Unhealthy air days in 30 yrs
- 4 days/yr
Risk factors via First Street. Map © Google.
Why this score? — see what drove the C grade
The composite is a weighted blend of 9 inputs, each scored 0–100. Each bar is that input's sub-score; the figure is the points it added to the 100-point composite (weight × sub-score).
- Cash flow +25.0/30.0
- DSCR +8.2/10.0
- ARV discount +7.5/15.0
- 1% rule +6.2/10.0
- Livability +3.7/5.0
- Rent growth +2.8/5.0
- Condition / age +2.5/5.0
- Schools +1.3/10.0
- Appreciation +0.0/10.0
$122,500
🖨 Deal sheet 📄 Offer letter ✓ Due diligence
Listing remarks MLS
Welcome home to this beautifully updated 3-bedroom, 2-bath bungalow offering comfort, functionality, and peace of mind. In addition to the spacious living areas, you'll love the bright sunroom - perfect for enjoying your morning coffee, creating a cozy reading nook, or providing additional space for relaxing and entertaining year-round. The finished basement adds valuable living space that can be used as a family room, recreation area, home office, or workout room. Outside, the oversized backyard offers plenty of room for gatherings, gardening, pets, play, or simply enjoying the outdoors. Major recent improvements provide added value and confidence, including a new furnace, new hot water heater, replacement of major plumbing drain and vent lines, professional basement waterproofing, a new garage roof, and a new garage door. The home also features a partial roof replacement, while the remaining roof section has been professionally treated with Roof Maxx to help extend its life and includes a 3-year maintenance program with annual gutter cleaning. Whether you're a first-time homebuyer, looking to downsize, or seeking an investment opportunity, this move-in-ready home offers an excellent combination of updates, space, and affordability. Some listing photos have been virtually staged to illustrate the home's potential layout and design possibilities. Furniture and decor shown in staged images are not included in the sale.
Key facts
- New furnace
- New garage roof
- New hot water heater
Tags
Property features AI
Finance
- Financial info: Tax amount provided but excluded per instructions
Exterior
- Parking: Detached garage with approximately 1.5 spaces
- Security: Smoke detector(s)
- Utilities: Public water; Public sewer
- Home design: Single family residence; Residential property; One and one-half stories; Ground-level entry with steps; Brick construction; Facing direction not provided
- Construction: Brick exterior; Block foundation; Built year not provided
- Exterior features: Enclosed patio/porch; Back yard fencing; Paved road access
Interior
- Kitchen: No kitchen appliance list provided
- Bedrooms: Total of 8 rooms (bedroom count not specified)
- Flooring: Flooring details not provided
- Bathrooms: 2 full bathrooms
- Heating & cooling: Forced air heating; Natural gas heating; No cooling
- Interior features: Gas water heater; Walk-out, daylight, full unfinished basement; Smoke detectors
- Laundry & utility: No laundry or utility appliance details provided
Neighborhood map
What this means for you Summary
Snapshot
- This is a 3-bed/1.0-bath single-family listed at $122k.
Deal economics
- At list price, monthly cash flow is $268 ($3k/yr) — positive.
- The deal already cash-flows at list — no discount required.
- Meets the 1% rule at list price ($1k rent vs $122k).
Location & tenants
- Location reads 73/100 on livability (#218 in MI) — a middle-class / working-renter tenant base. Strengths: amenities A+, commute A+, cost of living A+; Watch: schools F, crime F, employment F.
- Detroit Public Schools Community District (urban): math 10% / reading 24% proficiency, ranked #499 of 540 in MI (top 92%) — low school quality limits family demand, transient renter base, plan for 1-2y turnover; 90% free/reduced lunch — lower-income household profile, screen leases tightly.
- Market conditions: Rents rising (+1.3%/yr); 373 active listings in the ZIP; 26 comparable units currently listed for rent nearby; rentals at typical pace (median 17d on market — plan ~3-4 weeks tenant-placement turnaround); lower-income renter base — watch delinquency; 2,639 units permitted in Wayne County in 2024 (1,216 in 5+ unit buildings).
- This rent runs 42% of the median local income ($39k/yr) — at the standard rent-burdened threshold; future hikes will face affordability resistance.
Forward outlook
- Local home prices are declining (-3.0%/yr); year-one equity from $847 of loan paydown is wiped out by about $4k of value loss. Plan a longer hold.
- Wayne County population projected at -17% by 2050 — secular population decline; favor cash flow + early exit over multi-decade hold.
Negotiation context
- Only 2 days on market — expect competitive offers; lowballing is unlikely to land.
- 15 sale attempts since 25y ago with the ask held roughly flat each time — persistent listings suggest the price (not the market) is what's stuck; bring a comps-based counter.
- Current owner paid $50k; list at $122k implies a 145% gain — meaningful room to come down on a strong offer.
Risks & watch-outs
- Watch-outs: built in 1942 — expect roof / HVAC / electrical / plumbing capex.
Questions for the listing agent
- Built in 1942 — when were the roof, HVAC, electrical panel, plumbing, and water heater last replaced?
- Is there a deadline driving the sale (1031 exchange, divorce, estate, relocation)? That informs how much negotiation room exists.
- Schools are F-rated, which usually means shorter tenancies and higher turnover. Who's the typical renter profile here, and what's been the actual vacancy rate?
- Crime grade is F in this area — have there been break-ins, vandalism, or insurance claims at this property in the last 3 years? What carrier currently insures it and at what premium?
- What's the average days-on-market for RENTAL listings here right now (not sales)? A rising rental-DOM trend means longer vacancies and softer asking-rent achievability than the comps imply.
- What's the recent tenant-quality profile in this submarket — average credit score on applications, eviction rate, late-payment / NSF rate, and stable-employment percentage? A property-management company in the area should have these aggregated.
- How much new for-sale + rental construction is in the pipeline within 1–3 miles? Heavy new supply typically softens prices + rents 12–24 months out; constrained supply supports both.
Investment metrics
- 1% rule
- 1.12% ✓
- Cap rate
- 8.92%
- Cash-on-cash
- 9.37%
- DSCR
- 1.42
- GRM
- 7.5
CMA / ARV
- ARV (on-the-fly)
- $68,856
- Comps found
- 12
Show comp detail 12 sales within ~0.75 mi
| Address | Dist | Beds/Ba | Sqft | Sold | Price | $/sf | Match |
|---|---|---|---|---|---|---|---|
| 16107 Manning St | 0.27mi | 3/1.0 | 925 (+2%) | 2mo | $61,000 | $66 | 82 |
| 16277 Liberal St | 0.25mi | 3/1.0 | 945 (+4%) | 1mo | $25,000 | $26 | 80 |
| 16291 Fairmount Dr | 0.15mi | 3/1.0 | 977 (+8%) | 2mo | $112,000 | $115 | 79 |
| 16209 Tacoma St | 0.21mi | 3/1.0 | 968 (+7%) | 1mo | $62,900 | $65 | 78 |
| 16301 Coram St | 0.36mi | 3/1.0 | 929 (+2%) | 1mo | $19,500 | $21 | 78 |
| 18746 Woodside St | 0.39mi | 3/1.0 | 921 (+2%) | 2mo | $110,000 | $119 | 78 |
| 16062 CARLISLE St | 0.46mi | 3/1.0 | 957 (+6%) | 1mo | $42,000 | $44 | 69 |
| 16062 Carlisle St | 0.46mi | 3/1.0 | 957 (+6%) | 1mo | $42,000 | $44 | 69 |
| 16260 Bringard Dr | 0.24mi | 3/1.0 | 1,036 (+14%) | 0mo | $80,000 | $77 | 64 |
| 18905 Woodland St | 0.40mi | 3/1.5 | 1,023 (+13%) | 1mo | $105,000 | $103 | 57 |
| 18591 Kingsville St | 0.56mi | 2/1.0 (-1) | 824 (-9%) | 1mo | $74,000 | $90 | 53 |
| 12897 Riad St | 0.73mi | 3/1.0 | 831 (-8%) | 1mo | $63,000 | $76 | 51 |
Match score weights: distance 35% · size 25% · config 20% · recency 20%. Top-matched comps best support the ARV.
Projected returns pro-forma
-3.0% appreciation · 1.33% rent growth · sell at horizon
- IRR
- -4.0%
- Equity multiple
- 0.85×
- Total profit
- $-5,047
- Equity at exit
- $18,265
- IRR
- 3.7%
- Equity multiple
- 1.25×
- Total profit
- $8,610
- Equity at exit
- $10,592
Cash invested: $34,300 (down + closing). Projections, not guarantees.
Landlord ↔ Tenant lean methodology
- Overall (STATE)
- 62 Landlord-Friendly
- State Michigan
- 62 Landlord-Friendly · EVEN
- County
- — inherits STATE
- City
- — inherits STATE
ZIP-level market 48205
- Home prices YoY
- -28.1%
- Rents YoY
- 1.3%
- Active inventory
- 373
- Price-to-rent
- 7.5×
Monthly cashflow live
- Estimated rent
- $1,366 high interval (Pro) →
- Mortgage (P&I)
- −$642
- Tax from tax record
- −$118 /mo · $1,418/yr
- Insurance
- −$51
- HOA
- −$0
- Vacancy / Maint / Mgmt
- −$287
- Net cashflow
- $268
Break-even live
UW: 25.0% down · 7.5% · 30yr · 1.5% tax · 5.0% vac · 8.0% maint · 8.0% mgmt
Financing live
Cash to close
- Down payment
- $30,625
- Closing costs
- $3,675
- Reserves months
- —
- Total cash needed
- —
Loan-product check · same deal, 3 products live
Conventional
25% down · 7.5% · 30yr
- Down + closing
- —
- Monthly P&I
- —
- Monthly cashflow
- —
- DSCR
- —
- Eligible?
- —
Personal DTI + credit; lowest rate.
DSCR
20% down · 8.5% · 30yr
- Down + closing
- —
- Monthly P&I
- —
- Monthly cashflow
- —
- DSCR
- —
- Eligible?
- —
No personal income docs; deal must DSCR.
Hard money
10% down · 12.0% · 12mo
- Down + closing
- —
- Monthly P&I
- —
- Monthly cashflow
- —
- DSCR
- —
- Eligible?
- —
Short-term bridge; refi at stabilization.
Rent comps 26 comps
| Address | Beds | Baths | Sqft | Rent | $/sqft | DOM | Units | Dist |
|---|---|---|---|---|---|---|---|---|
| 16291 Eastburn St Detroit, MI | 3.0 | 1.0 | 1000 | $1,364 | $1.36 | 24d | 1 | 0.16mi |
| 16410 Edmore Dr Detroit, MI | 3.0 | 1.0 | 850 | $1,250 | $1.47 | 14d | 1 | 0.23mi |
| 16225 Manning St Detroit, MI | 4.0 | 2.0 | 1036 | $1,475 | $1.42 | 43d | 1 | 0.24mi |
| 16212 Maddelein St Detroit, MI | 2.0 | 1.0 | 800 | $1,200 | $1.50 | 12d | 1 | 0.55mi |
| 15909 Maddelein St Detroit, MI | 3.0 | 1.0 | 894 | $1,266 | $1.42 | 43d | 1 | 0.59mi |
| 15663 Carlisle St Detroit, MI | 2.0 | 1.0 | 803 | $1,050 | $1.31 | 14d | 1 | 0.62mi |
| 19152 Woodside St Harper Woods, MI | 3.0 | 1.0 | 916 | $1,500 | $1.64 | 17d | 1 | 0.65mi |
| 12716 Riad St Detroit, MI | 3.0 | 1.0 | 974 | $1,275 | $1.31 | 17d | 1 | 0.88mi |
| 19144 Moross Rd Detroit, MI | 2.0 | 1.0 | 900 | $1,050 | $1.17 | 43d | 1 | 0.89mi |
| 19365 Kingsville St Harper Woods, MI | 4.0 | 1.5 | 996 | $1,650 | $1.66 | 14d | 1 | 0.89mi |
| 19442 Kingsville St Harper Woods, MI | 3.0 | 1.0 | 1000 | $1,500 | $1.50 | 17d | 1 | 0.97mi |
| 19661 Kenosha St Harper Woods, MI | 3.0 | 2.0 | 1000 | $1,400 | $1.40 | 24d | 1 | 1.00mi |
| 12075 Rossiter St Detroit, MI | 3.0 | 1.0 | 1100 | $1,245 | $1.13 | 14d | 1 | 1.01mi |
| 12075 Rossiter St Detroit, MI | 3.0 | 1.0 | 1100 | $1,245 | $1.13 | 43d | 1 | 1.01mi |
| 19639 Moross Rd Unit 1 Detroit, MI | 2.0 | 1.0 | 900 | $1,100 | $1.22 | 43d | 1 | 1.09mi |
| 12201 Morang Ave Unit 8 Detroit, MI | 2.0 | 1.0 | 610 | $875 | $1.43 | 43d | 1 | 1.17mi |
| 20015 Lochmoor St Harper Woods, MI | 3.0 | 1.0 | 1006 | $1,500 | $1.49 | 16d | 1 | 1.17mi |
| 15494 Mapleridge St Detroit, MI | 3.0 | 1.0 | 937 | $1,275 | $1.36 | 43d | 1 | 1.18mi |
| 20600 Balfour St Harper Woods, MI | 1.0–2.0 | 1.0–2.0 | 971 | $1,671 | $1.72 | 1d | 12 | 1.20mi |
| 11776 Rossiter St Detroit, MI | 3.0 | 1.0 | 964 | $1,150 | $1.19 | 11d | 1 | 1.20mi |
| 19982 McCormick St Detroit, MI | 3.0 | 1.0 | 866 | $1,200 | $1.39 | 3d | 1 | 1.26mi |
| 11611 Morang Ave Detroit, MI | 1.0–2.0 | 1.0 | 709 | $1,040 | $1.47 | 43d | 1 | 1.30mi |
| 11529 Roxbury St Detroit, MI | 2.0 | 1.0 | 720 | $1,200 | $1.67 | 12d | 1 | 1.30mi |
| 14461 Lappin St Detroit, MI | 3.0 | 1.5 | 989 | $1,150 | $1.16 | 17d | 1 | 1.32mi |
| 10985 Peerless St Detroit, MI | 3.0 | 1.0 | 1000 | $1,364 | $1.36 | 4d | 1 | 1.41mi |
| 20461 Kingsville St Harper Woods, MI | 4.0 | 1.0 | 1100 | $1,399 | $1.27 | 14d | 1 | 1.49mi |
Listing history 3 events
-
2026-06-18days on market $122,500 Active 2 DOM
-
2026-06-17remarks 693-char remark
-
2026-06-17$122,500 Active 1 DOM
ⓘ Source: listings_history table (triggers on properties + properties_extension) + one-shot
backfill from property_details.listing_events for pre-trigger history.
Tax reassessment forecast MI · Partial reset (capped growth)
- Current annual tax
- $1,418 · $118/mo
- Projected year-2 tax
- $1,652 · $138/mo
- Expected delta
- +$234/yr (+$20/mo · 16.5%)
ⓘ Screening estimate from a state-policy table — verify with the county assessor before closing.
Climate risk First Street
- Flood 1/10 Low FEMA zone X (unshaded) · 0% chance over 30 yrs
- Wildfire 1/10 Low
- Heat 3/10 Moderate 7 d/yr ≥96°F today · 15 d/yr by 30 yrs out
- Wind 2/10 Low
- Air quality 3/10 Moderate 3 unhealthy d/yr today · 4 by 30 yrs out
Nearby sold comps map
Loading sold comps map…
Walkable amenities ~0.75 mi
Loading nearby amenities…
Taxation est. · year 1
- Rental income
- $16,397
- − Mortgage interest
- −$6,862
- − Property taxes
- −$1,418
- − Insurance
- −$612
- − Repairs & maintenance
- −$1,312
- − Management
- −$1,312
- − Depreciation
- −$3,564
- Taxable income
- $1,318
- Est. tax owed @ 24.0%
- −$316
- After-tax cash flow
- $2,898/yr
For passive investors: Depreciation is non-cash, so a rental often shows a tax loss while cash-flowing — sheltering income. Rental losses are passive: they offset passive income freely, and up to $25,000/yr can offset ordinary (W-2) income if you actively participate and your MAGI is under $100k (phasing out to $0 by $150k); unused losses carry forward. On sale, claimed depreciation is recaptured at up to 25%, and gains may owe capital-gains tax (a 1031 exchange can defer both). Figures are a year-1 estimate at your 24.0% rate — not tax advice; consult a CPA.
Schools (NCES district)
- District
- Detroit Public Schools Community District
- NCES district ID
- 2601103
- Math proficiency
- 10% ▼ -2.00%
- Reading proficiency
- 24% ▲ 6.00%
- Median HH income
- $25,815
- Composite
- 13.06/100
- National rank
- #9564
- State rank
- #499 of 540 in MI
Livability — Detroit
- Score
- 73/100
- State rank
- #218
- US rank
- #5427
Category grades
Schools grade is shown separately in the Schools card above.
Census & demographics
- Census place
- Detroit, MI
- County
- Wayne County · 1,562,939 people
- City population
- 572,865
- Metro
- Detroit-Warren-Dearborn, MI
- Population (ZIP)
- 34,187
- Household income
- $38,966
- Rent vs Own
- Severe rent burden
- 2121.0
Population outlook (Wayne County) Hauer SSP2
- Today (2025)
- 1,675,273 people
- By 2030
- 1,620,300 · -3.3%
- By 2040
- 1,502,341 · -10.3%
- By 2050
- 1,384,039 · -17.4%
- By 2075
- 1,124,592 · -32.9%
- By 2100
- 881,193 · -47.4%
Race, ethnicity, and origin ACS 2023
- Neighborhood character
- Predominantly Black (93%)
- Race & ethnicity
- Black 93% White 3% Two or more races 2%
- Foreign-born
- 1% · Canada
- Languages at home
- 98% English-only · Spanish 1%
Political lean MEDSL · Wayne
- 2024 margin
- Strong D (+29.0) · D 62.7% · R 33.7% · Other 3.6%
- 2008→2024 swing
- -20.5pp toward R · 2008: 49.5pp · 2024: 29.0pp
- All cycles
- 2024: D+29.0 2020: D+38.1 2016: D+37.3 2012: D+46.9 2008: D+49.5
Not yet ingested
- Civics
- —
Market trends
- HPI YoY
- ▼ -91.80%
- Current HPI
- 235.0926
- Rent YoY
- ▲ 1.33%
- Metro
- Detroit-Warren-Dearborn, MI
- State GDP YoY
- ▲ 1.37%
- F500 in state
- 28
Industry mix (Fortune 500 HQ in MI)
| Industry | F500 HQs | Revenue |
|---|---|---|
| Automotive Parts | 3 | $48B |
|
||
| Automotive | 2 | $372B |
|
||
| Chemicals | 1 | $45B |
|
||
| Automotive Retail | 1 | $29B |
|
||
| Healthcare / Medical Devices | 1 | $23B |
|
||
| Automotive Technology | 1 | $20B |
|
||
Price history
+36.3% since first listed37 events — show timeline
- 2026-06-16 Listed $122,500 REALCOMP
- 2026-06-16 Listed $122,500 MiRealSource-MiMLS
- 2026-03-03 Listing Removed — REALCOMP
- 2026-03-03 Listing Removed — MiRealSource-MiMLS
- 2026-02-12 Price Changed $127,500 MiRealSource-MiMLS
- 2026-02-11 Price Changed $127,500 REALCOMP
- 2025-12-02 Listed $130,000 MiRealSource-MiMLS
- 2025-12-02 Listed $130,000 REALCOMP
- 2025-10-09 Sold (Public Records) $50,000 Public Records
- 2025-10-01 Pending — REALCOMP
- 2025-09-30 Sold (MLS) $50,000 MiRealSource-MiMLS
- 2025-09-30 Sold (MLS) $50,000 REALCOMP
- 2025-05-06 Listed $75,000 MiRealSource-MiMLS
- 2025-05-06 Listed $75,000 REALCOMP
- 2024-12-09 Listing Removed — REALCOMP
- 2024-12-09 Listing Removed — MiRealSource-MiMLS
- 2024-08-26 Listed $87,000 REALCOMP
- 2024-08-26 Listed $87,000 MiRealSource-MiMLS
- 2024-08-01 Listing Removed — REALCOMP
- 2024-08-01 Listing Removed — MiRealSource-MiMLS
- 2024-04-29 Listed $90,000 REALCOMP
- 2024-04-29 Listed $90,000 MiRealSource-MiMLS
- 2023-01-03 Sold (Public Records) $60,000 Public Records
- 2019-08-22 Listing Removed — REALCOMP
- 2019-08-21 Listing Removed — MiRealSource-MiMLS
- 2019-04-11 Contingent — MiRealSource-MiMLS
- 2019-04-11 Contingent — REALCOMP
- 2019-04-01 Listed $22,000 MiRealSource-MiMLS
- 2019-04-01 Listed $22,000 REALCOMP
- 2011-03-16 Listing Removed — REALCOMP
- 2011-03-16 Listing Removed — MiRealSource-MiMLS
- 2010-09-16 Listed $15,900 REALCOMP
- 2010-09-16 Listed $15,900 MiRealSource-MiMLS
- 2002-02-22 Sold (Public Records) $87,500 Public Records
- 2001-12-27 Sold (MLS) $87,500 MiRealSource-MiMLS
- 2001-11-13 Listing Removed — MiRealSource-MiMLS
- 2001-09-12 Listed $89,900 MiRealSource-MiMLS
Property tax history
-3.5%/yrLatest (2025): $1,418 · +0.2% YoY. Source: county tax records.
Cash-flow waterfall
monthlySold comps — $/sqft
last 12 mo · ≤1 miLoading sold comps…