 8-Plex
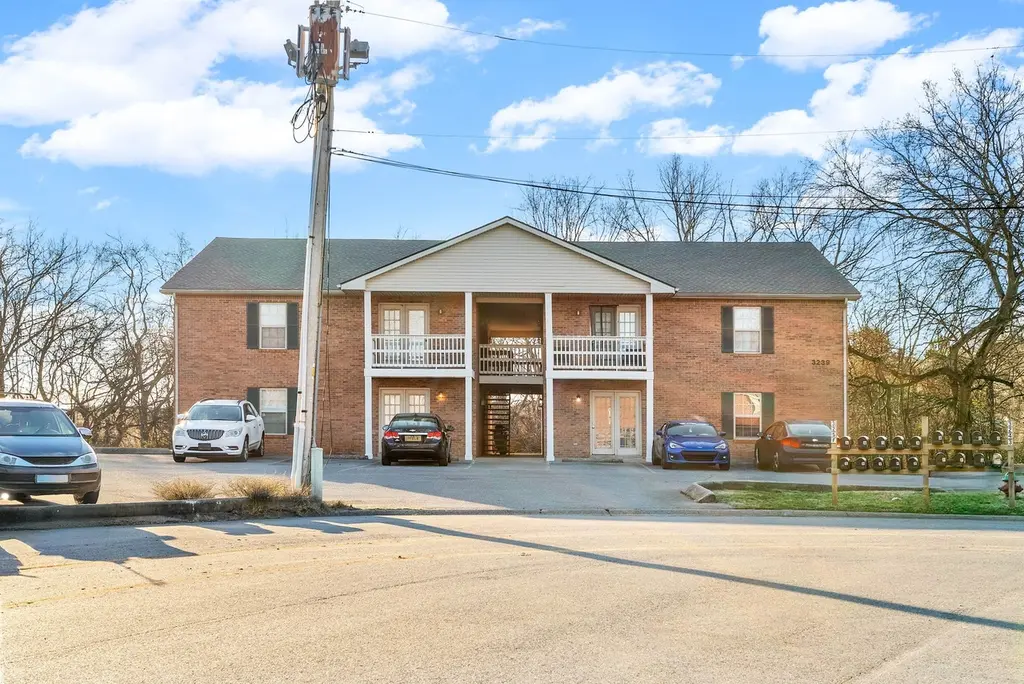
3239 Tower Dr · Clarksville, TN
Flood risk No data
- FEMA flood zone
- —
- Chance of flooding over 30 yrs
- —
- Est. flood insurance / yr
- —
Fire risk No data
- Est. fire insurance / yr
- —
Heat risk No data
- Hot days now (above threshold)
- —
- Hot days in 30 yrs
- —
Wind risk No data
- Chance of severe wind over 30 yrs
- —
Air-quality risk No data
- Unhealthy air days now
- —
- Unhealthy air days in 30 yrs
- —
Risk factors via First Street. Map © Google.
Why this score? — see what drove the D+ grade
The composite is a weighted blend of 9 inputs, each scored 0–100. Each bar is that input's sub-score; the figure is the points it added to the 100-point composite (weight × sub-score).
- Cash flow +16.9/30.0
- ARV discount +7.5/15.0
- DSCR +5.3/10.0
- Livability +4.2/5.0
- 1% rule +3.6/10.0
- Rent growth +2.8/5.0
- Schools +2.5/10.0
- Condition / age +2.5/5.0
- Appreciation +0.0/10.0
$969,000
🖨 Deal sheet (PDF) 📄 Offer letter ✓ Due diligence
Multi-family units
County records classify this as Multi-Family (5+ Unit). Listing-text estimate: 8 units. confirmed
5+ unit building — per-unit beds/baths from public records are typically unavailable; the breakdown below (if shown) is an estimate from the listing text.
Listing remarks
FULLY OCCUPIED 8-Unit All-Brick Apartment Building in a Prime Location! Excellent investment opportunity with this well-maintained, fully occupied 8-unit multifamily property, ideally situated just off Tiny Town Rd. Tenants enjoy easy access to shopping, dining, Fort Campbell, and the interstate, making this a highly desirable location for long-term occupancy. This all-brick building is a great addition to any investor’s portfolio. New Roof put on at the end of 2024! Please give a 48-hour notice to schedule a showing, no showings without an accepted offer.
Key facts
- Prime location
- Built 1996
- Listed 50 days
Tags
Property features AI
Finance
- Other: Zoned R-4
- Financial info: Gross annual income reported: $83,519; Net operating income reported: $52,498; Owner pays trash collection; Tenants pay cable TV, electricity, gas, and water
Exterior
- Parking: No designated parking spaces reported
- Utilities: Public water; Public sewer; Water service available
- Home design: Residential income property; Attached multi-family building; One level
- Construction: Brick and vinyl siding exterior; Approximate year built; Multi-family structure
- Exterior features: Public water available; Public sewer
Interior
- Bedrooms: Eight 2-bedroom units
- Flooring: Carpet
- Bathrooms: Each 2-bedroom unit has 1 bathroom
- Heating & cooling: Central heat; Central air
- Interior features: Carpet flooring; Individual laundry in units; Central heating; Central air conditioning
- Laundry & utility: Residents have individual laundry
Neighborhood map
What this means for you Summary
Snapshot
- This is a 8 × 1-bed/1-bath units multifamily listed at $969k.
Deal economics
- At list price, monthly cash flow is $636 ($8k/yr) — positive. Per door: $80/mo.
- The deal already cash-flows at list — no discount required.
- To meet the 1% rule (rent ≥ 1% of price), the offer needs to be $833k (14.0% below list).
- Recommended offer: $833k (14.0% below list) — sets the bar for 1% rule.
- Cap rate 7.1% vs local median 3.5% in Clarksville — top-decile yield for the area; either an underpriced asset or a hidden risk that comps aren't pricing in. Stress-test before assuming the spread holds.
Location & tenants
- Location reads 84/100 on livability (#1 in TN, #798 nationally) — a professional / high-income tenant draw. Strengths: amenities A+, commute A+, cost of living A+; Watch: employment C-, crime D+.
- Montgomery County (urban): math 25% / reading 31% proficiency, ranked #65 of 139 in TN (top 47%) — low school quality limits family demand, transient renter base, plan for 1-2y turnover.
- Zoned schools: Hazelwood Elementary (math 27% / reading 30%, grade F, #472 of 952 statewide, top 50%, 924 students, 0% FRL); Northeast Middle (math 16% / reading 20%, grade F, #211 of 333 statewide, top 64%, 1,026 students, 0% FRL); Northeast High (math 6% / reading 35%, grade F, #175 of 332 statewide, top 53%, 1,728 students, 0% FRL) — zoned schools average 0% FRL vs 40% district-wide (40 pts lower); this property's tenant base skews higher-income than the district average.
- Market conditions: Rents rising (+1.3%/yr); 895 active listings in the ZIP; 2,583 units permitted in Montgomery County in 2024 (617 in 5+ unit buildings).
- At $8,332/mo this rent would consume 142% of the median local household income ($70k/yr) (locally 2093% of renters already pay >50% of income on rent) — very limited rent-growth headroom before tenants either downsize or default.
Forward outlook
- Local home prices are declining (-3.0%/yr); year-one equity from $7k of loan paydown is wiped out by about $29k of value loss. Plan a longer hold.
- Montgomery County population projected at +49% by 2050 — long-run rental-demand tailwind backs the buy-and-hold thesis.
Negotiation context
- It's been on market 50 days — a 3% lower offer ($940k) is reasonable based on typical stale-listing flexibility.
- 11 sale attempts since 16y ago with the ask held roughly flat each time — persistent listings suggest the price (not the market) is what's stuck; bring a comps-based counter.
- Current owner paid $535k; list at $969k implies a 81% gain — meaningful room to come down on a strong offer.
Questions for the listing agent
- It's been on market 50 days. Have you received any prior offers? Is the seller open to a 14% concession, seller financing, or rate buy-down credit?
- Can we see the unit-by-unit rent roll, current vacancy, and any below-market leases? What's the average tenancy length?
- What capital expenditures (roof, boiler, parking lot, exteriors) have been made in the last 5 years, and what's planned in the next 2?
- Is there a deadline driving the sale (1031 exchange, divorce, estate, relocation)? That informs how much negotiation room exists.
- Crime grade is D in this area — have there been break-ins, vandalism, or insurance claims at this property in the last 3 years? What carrier currently insures it and at what premium?
- The area grade is low — what's the realistic commute time and amenity access for the typical tenant pool here? Any planned neighborhood developments (good or bad) we should know about?
- What's the average days-on-market for RENTAL listings here right now (not sales)? A rising rental-DOM trend means longer vacancies and softer asking-rent achievability than the comps imply.
- What's the recent tenant-quality profile in this submarket — average credit score on applications, eviction rate, late-payment / NSF rate, and stable-employment percentage? A property-management company in the area should have these aggregated.
- How much new apartment / multifamily construction is in the pipeline within 1–3 miles? Heavy new supply (>2% of stock underway) typically softens rents 12–24 months out; light construction supports rent growth.
Investment metrics
- 1% rule
- 0.86% ✗
- Cap rate
- 7.08%
- Cash-on-cash
- 2.81%
- DSCR
- 1.13
- GRM
- 9.7
CMA / ARV
No comps found within radius.
Projected returns pro-forma
-3.0% appreciation · 1.27% rent growth · sell at horizon
- IRR
- -13.7%
- Equity multiple
- 0.52×
- Total profit
- $-131,086
- Equity at exit
- $144,481
- IRR
- -7.5%
- Equity multiple
- 0.56×
- Total profit
- $-119,832
- Equity at exit
- $83,781
Cash invested: $271,320 (down + closing). Projections, not guarantees.
Landlord ↔ Tenant lean methodology
- Overall (STATE)
- 87 Strongly Landlord-Friendly
- State Tennessee
- 87 Strongly Landlord-Friendly · R+13
- County
- — inherits STATE
- City
- — inherits STATE
ZIP-level market 37042
- Home prices YoY
- -18.2%
- Rents YoY
- 1.3%
- Active inventory
- 895
- Price-to-rent
- 77.5×
Monthly cashflow live
- Estimated rent
- $8,332 high interval (Pro) →
- Mortgage (P&I)
- −$5,082
- Tax from tax record
- −$461 /mo · $5,528/yr
- Insurance
- −$404
- HOA
- −$0
- Vacancy / Maint / Mgmt
- −$1,750
- Net cashflow
- $636
Break-even live
Sensitivity live
| Price | -10% $1,185 | -5% $911 | +0% $636 | +5% $362 | +10% $88 |
|---|---|---|---|---|---|
| Rent | -10% $-22 | -5% $307 | +0% $636 | +5% $965 | +10% $1,295 |
| Rate | -1.0pp $1,124 | -0.5pp $883 | base $636 | +0.5pp $385 | +1.0pp $130 |
8-unit breakdown (identical units grouped — click to expand)
| Units | Beds | Baths | Est. rent |
|---|---|---|---|
| 8× units | 1 | 1 | $8,336 |
| #1 | 1 | 1 | $1,042 |
| #2 | 1 | 1 | $1,042 |
| #3 | 1 | 1 | $1,042 |
| #4 | 1 | 1 | $1,042 |
| #5 | 1 | 1 | $1,042 |
| #6 | 1 | 1 | $1,042 |
| #7 | 1 | 1 | $1,042 |
| #8 | 1 | 1 | $1,042 |
| Total (8 units) | $8,332 | ||
UW: 25.0% down · 7.5% · 30yr · 1.5% tax · 5.0% vac · 8.0% maint · 8.0% mgmt
Financing live
Cash to close
- Down payment
- $242,250
- Closing costs
- $29,070
- Reserves months
- —
- Total cash needed
- —
Loan-product check · same deal, 3 products live
Conventional
25% down · 7.5% · 30yr
- Down + closing
- —
- Monthly P&I
- —
- Monthly cashflow
- —
- DSCR
- —
- Eligible?
- —
Personal DTI + credit; lowest rate.
DSCR
20% down · 8.5% · 30yr
- Down + closing
- —
- Monthly P&I
- —
- Monthly cashflow
- —
- DSCR
- —
- Eligible?
- —
No personal income docs; deal must DSCR.
Hard money
10% down · 12.0% · 12mo
- Down + closing
- —
- Monthly P&I
- —
- Monthly cashflow
- —
- DSCR
- —
- Eligible?
- —
Short-term bridge; refi at stabilization.
Listing history 35 events
-
2026-06-10status $969,000 Pending 50 DOM
-
2026-06-09days on market $969,000 Active Under Contract 50 DOM
-
2026-06-08days on market $969,000 Active Under Contract 49 DOM
-
2026-06-07days on market $969,000 Active Under Contract 48 DOM
-
2026-06-05days on market $969,000 Active Under Contract 45 DOM
-
2026-06-03days on market $969,000 Active Under Contract 44 DOM
-
2026-06-02statusdays on market $969,000 Active Under Contract 43 DOM
-
2026-05-31days on market $969,000 Active 41 DOM
-
2026-05-30days on market $969,000 Active 40 DOM
-
2026-04-21$969,000 Active
-
2026-01-26historical
-
2026-01-05$969,000 Active
-
2026-01-03historical
-
2025-12-29historical
-
2025-07-30$999,999 Active
-
2025-01-18historical $825
-
2025-01-06$825
-
2023-07-12historical
-
2020-02-10soldstatus $535,000
-
2017-10-20historical
-
2017-09-07$449,500 Active
-
2017-03-14historical
-
2017-02-06$415,000 Active
-
2017-01-15historical
-
2016-10-14$415,000 Active
-
2016-10-01historical
-
2016-09-01price $415,000
-
2016-06-30$430,000 Active
-
2016-04-12historical
-
2016-01-11$430,000 Active
-
2015-11-18historical
-
2015-11-17price $430,000
-
2015-11-17$375,000 Active
-
2012-05-03historical
-
2010-07-01$448,000
ⓘ Source: listings_history table (triggers on properties + properties_extension) + one-shot
backfill from property_details.listing_events for pre-trigger history.
Tax reassessment forecast TN · Resets to sale price
- Current annual tax
- $5,528 · $461/mo
- Projected year-2 tax
- $6,880 · $573/mo
- Expected delta
- +$1,352/yr (+$113/mo · 24.5%)
ⓘ Screening estimate from a state-policy table — verify with the county assessor before closing.
Nearby sold comps map
Loading sold comps map…
Walkable amenities ~0.75 mi
Loading nearby amenities…
Taxation est. · year 1
- Rental income
- $99,984
- − Mortgage interest
- −$54,279
- − Property taxes
- −$5,528
- − Insurance
- −$4,845
- − Repairs & maintenance
- −$7,999
- − Management
- −$7,999
- − Depreciation
- −$28,189
- Taxable loss
- −$8,855
- Est. tax savings @ 24.0%
- +$2,125
- After-tax cash flow
- $9,761/yr
For passive investors: Depreciation is non-cash, so a rental often shows a tax loss while cash-flowing — sheltering income. Rental losses are passive: they offset passive income freely, and up to $25,000/yr can offset ordinary (W-2) income if you actively participate and your MAGI is under $100k (phasing out to $0 by $150k); unused losses carry forward. On sale, claimed depreciation is recaptured at up to 25%, and gains may owe capital-gains tax (a 1031 exchange can defer both). Figures are a year-1 estimate at your 24.0% rate — not tax advice; consult a CPA.
Schools (NCES district)
- District
- Montgomery County
- NCES district ID
- 4703030
- Math proficiency
- 25% ▼ -20.00%
- Reading proficiency
- 31% ▼ -10.00%
- Median HH income
- $50,423
- Composite
- 24.56/100
- National rank
- #7641
- State rank
- #65 of 139 in TN
Livability — Clarksville
- Score
- 84/100
- State rank
- #1
- US rank
- #798
Category grades
Schools grade is shown separately in the Schools card above.
Census & demographics
- Census place
- Clarksville, TN
- County
- Montgomery County · 211,371 people
- City population
- 211,371
- Metro
- Clarksville, TN-KY
- Population (ZIP)
- 87,652
- Household income
- $70,393
- Rent vs Own
- Severe rent burden
- 2093.0
Population outlook (Montgomery County) Hauer SSP2
- Today (2025)
- 236,633 people
- By 2030
- 258,978 · +9.4%
- By 2040
- 305,456 · +29.1%
- By 2050
- 353,147 · +49.2%
- By 2075
- 471,289 · +99.2%
- By 2100
- 564,122 · +138.4%
Race, ethnicity, and origin ACS 2023
- Neighborhood character
- Diverse neighborhood (Simpson 0.68)
- Race & ethnicity
- White 48% Black 26% Hispanic / Latino 15% Two or more races 13% Asian 3%
- Hispanic origin (detail)
- Mexican 6% Puerto Rican 4%
- Common ancestry
- Italian 4% Slovak 1% Lithuanian 1%
- Foreign-born
- 8% · Canada, South Korea, China
- Languages at home
- 88% English-only · Spanish 8% German/W. Germanic 1% Other Indo-European 1%
Political lean MEDSL · Montgomery
- 2024 margin
- R (+18.4) · D 40.0% · R 58.5% · Other 1.5%
- 2008→2024 swing
- -10.5pp toward R · 2008: -7.9pp · 2024: -18.4pp
- All cycles
- 2024: R+18.4 2020: R+12.7 2016: R+18.6 2012: R+10.5 2008: R+7.9
Not yet ingested
- Civics
- —
Market trends
- HPI YoY
- ▼ -58.81%
- Current HPI
- 264.4911
- Rent YoY
- ▲ 1.27%
- Metro
- Clarksville, TN-KY
- State GDP YoY
- ▲ 2.78%
- F500 in state
- 22
Industry mix (Fortune 500 HQ in TN)
| Industry | F500 HQs | Revenue |
|---|---|---|
| Healthcare | 3 | $91B |
|
||
| Retail | 3 | $72B |
|
||
| Transportation / Logistics | 1 | $88B |
|
||
| Paper / Packaging | 1 | $19B |
|
||
| Insurance | 1 | $13B |
|
||
| Energy | 1 | $12B |
|
||
Price history
+116.3% since first listed26 events — show timeline
- 2026-04-21 Listed $969,000 REALTRACS as Distributed by MLS Grid
- 2026-01-26 Listing Removed — REALTRACS as Distributed by MLS Grid
- 2026-01-05 Listed $969,000 REALTRACS as Distributed by MLS Grid
- 2026-01-03 Coming Soon — REALTRACS as Distributed by MLS Grid
- 2025-12-29 Listing Removed — REALTRACS as Distributed by MLS Grid
- 2025-07-30 Listed $999,999 REALTRACS as Distributed by MLS Grid
- 2025-01-18 Rental Removed $825 APPFOLIO
- 2025-01-06 Listed for Rent $825 APPFOLIO
- 2023-07-12 Rental Removed — REALTRACS
- 2020-02-10 Sold (Public Records) $535,000 Public Records
- 2017-10-20 Listing Removed — REALTRACS as Distributed by MLS Grid
- 2017-09-07 Listed $449,500 REALTRACS as Distributed by MLS Grid
- 2017-03-14 Listing Removed — REALTRACS as Distributed by MLS Grid
- 2017-02-06 Listed $415,000 REALTRACS as Distributed by MLS Grid
- 2017-01-15 Listing Removed — REALTRACS as Distributed by MLS Grid
- 2016-10-14 Listed $415,000 REALTRACS as Distributed by MLS Grid
- 2016-10-01 Listing Removed — REALTRACS as Distributed by MLS Grid
- 2016-09-01 Price Changed $415,000 REALTRACS as Distributed by MLS Grid
- 2016-06-30 Listed $430,000 REALTRACS as Distributed by MLS Grid
- 2016-04-12 Listing Removed — REALTRACS as Distributed by MLS Grid
- 2016-01-11 Listed $430,000 REALTRACS as Distributed by MLS Grid
- 2015-11-18 Listing Removed — REALTRACS as Distributed by MLS Grid
- 2015-11-17 Price Changed $430,000 REALTRACS as Distributed by MLS Grid
- 2015-11-17 Listed $375,000 REALTRACS as Distributed by MLS Grid
- 2012-05-03 Listing Removed — REALTRACS as Distributed by MLS Grid
- 2010-07-01 Listed $448,000 REALTRACS as Distributed by MLS Grid
Property tax history
+1.8%/yrLatest (2025): $5,528 · +1.3% YoY. Source: county tax records.
Cash-flow waterfall
monthlySold comps — $/sqft
last 12 mo · ≤1 miLoading sold comps…