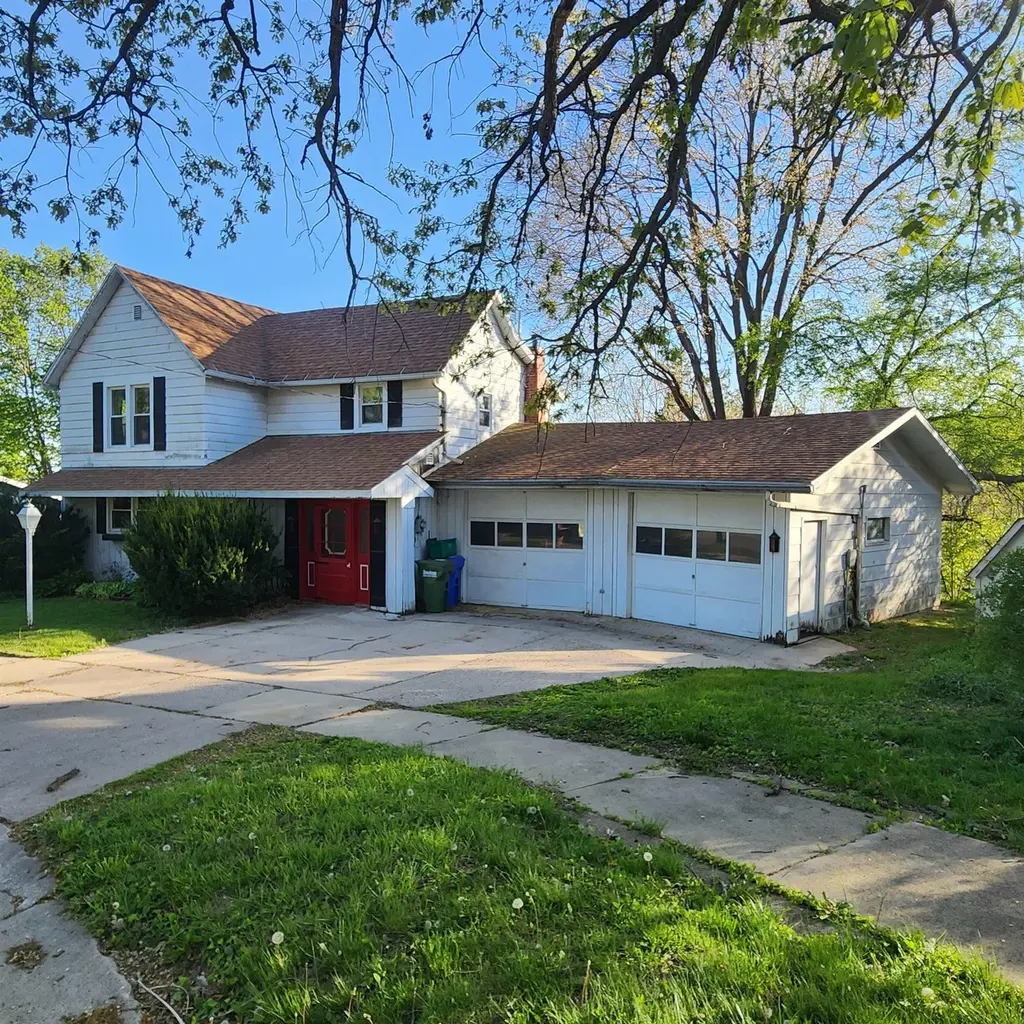
311 NE Second St. St · Elkader, IA
Flood risk 1/10 · Minimal
- FEMA flood zone
- X (unshaded)
- Chance of flooding over 30 yrs
- 0.0%
- Est. flood insurance / yr
- $473 – $860
Fire risk 1/10 · Minimal
- Est. fire insurance / yr
- $902 – $1,676
Heat risk 2/10 · Minimal
- Hot days now (above 101°F)
- 7 days/yr
- Hot days in 30 yrs
- 15 days/yr
Wind risk 2/10 · Minimal
- Chance of severe wind over 30 yrs
- —
Air-quality risk 1/10 · Minimal
- Unhealthy air days now
- 0 days/yr
- Unhealthy air days in 30 yrs
- 0 days/yr
Risk factors via First Street. Map © Google.
Why this score? — see what drove the C- grade
The composite is a weighted blend of 9 inputs, each scored 0–100. Each bar is that input's sub-score; the figure is the points it added to the 100-point composite (weight × sub-score).
- Cash flow +13.6/30.0
- Appreciation +8.3/10.0
- ARV discount +7.7/15.0
- Schools +5.3/10.0
- DSCR +4.1/10.0
- Livability +4.0/5.0
- 1% rule +3.8/10.0
- Rent growth +2.5/5.0
- Condition / age +2.5/5.0
$134,000
🖨 Deal sheet 📄 Offer letter ✓ Due diligence
Listing remarks
Perched on a hill overlooking the downtown and Turkey River area. This charming 2-story home offers character, potential, and a bird's eye view from its back deck. Being Located near the historic downtown area of Elkader, this 3-bedroom, 1-bath home blends small-town charm with endless opportunity. Built in 1900, the home offers character with its entryway railing, large beam support structed look, open downstairs floor plan and built in China hutch. All new windows have been installed within the last 3 years. While the property could use some TLC, it offers great potential for a starter home, investment property, rental, renovation project or just make it your home. Enjoy being within walk
Key facts
- Entryway railing
- Large beam support
- Overlooking downtown
Tags
Property features AI
Finance
- HOA & community: Sidewalks in the community
Exterior
- Parking: Carport for 2 vehicles; Garage with garage door opener; Oversized garage with workshop area
- Utilities: Public water; Public sewer
- Home design: Single-family residence; Multi/split level
- Construction: Aluminum siding; Vertical siding; HardiPlank type siding; Asphalt roof; Basement present (unfinished)
- Exterior features: Deck; Storage structure; Concrete road access; Property has a view; Sloped and irregular lot
Interior
- Kitchen: Dishwasher; Free-standing range; Refrigerator; Vented exhaust fan
- Bathrooms: One full bathroom
- Heating & cooling: Central air conditioning; Forced air heating; Exhaust fan; Natural gas heating
- Interior features: Dishwasher; Free-standing range; Refrigerator; Vented exhaust fan; Gas water heater; Owned water softener; Unfinished basement
- Laundry & utility: Laundry on main level; Gas water heater; Owned water softener
Neighborhood map
What this means for you Summary
Snapshot
- This is a 3-bed/1.5-bath single-family listed at $134k.
Deal economics
- At list price, monthly cash flow is $8 ($94/yr) — positive.
- The deal already cash-flows at list — no discount required.
- To meet the 1% rule (rent ≥ 1% of price), the offer needs to be $118k (11.8% below list).
- Recommended offer: $118k (11.8% below list) — sets the bar for 1% rule.
Location & tenants
- Location reads 80/100 on livability (#77 in IA, #1,634 nationally) — a professional / high-income tenant draw. Strengths: crime A+, cost of living A+, housing A+; Watch: amenities F, commute F.
- Central Community School District (rural): math 56% / reading 70% proficiency, ranked #214 of 289 in IA (top 74%) — acceptable for families but not a draw, mixed tenant base, ~2y average lease.
- Market conditions: 14 active listings in the ZIP; 48 units permitted in Clayton County in 2024 (0 in 5+ unit buildings).
Forward outlook
- In year one you build about $10k of equity ($926 loan paydown + $9k appreciation (6.6% local appreciation)).
- Clayton County population projected at -21% by 2050 — secular population decline; favor cash flow + early exit over multi-decade hold.
- At projected returns (6.6% appreciation + 3.0% rent growth), your $38k cash investment doubles in ~4 years — after that, you're playing with house money.
- By year 4, paydown + projected appreciation supports a ~$34k cash-out refi (75% LTV) — recoverable capital for the next deal without selling this one.
Negotiation context
- Only 5 days on market — expect competitive offers; lowballing is unlikely to land.
Risks & watch-outs
- Watch-outs: built in 1900 — expect roof / HVAC / electrical / plumbing capex.
Questions for the listing agent
- Built in 1900 — when were the roof, HVAC, electrical panel, plumbing, and water heater last replaced?
- Is there a deadline driving the sale (1031 exchange, divorce, estate, relocation)? That informs how much negotiation room exists.
- Schools are B-rated — typically a magnet for longer-tenancy family renters. What's the average tenant stay here, and is there a school-zone premium baked into asking?
- What's the average days-on-market for RENTAL listings here right now (not sales)? A rising rental-DOM trend means longer vacancies and softer asking-rent achievability than the comps imply.
- What's the recent tenant-quality profile in this submarket — average credit score on applications, eviction rate, late-payment / NSF rate, and stable-employment percentage? A property-management company in the area should have these aggregated.
- How much new for-sale + rental construction is in the pipeline within 1–3 miles? Heavy new supply typically softens prices + rents 12–24 months out; constrained supply supports both.
Investment metrics
- 1% rule
- 0.88% ✗
- Cap rate
- 6.36%
- Cash-on-cash
- 0.25%
- DSCR
- 1.01
- GRM
- 9.4
CMA / ARV
- ARV (on-the-fly)
- $134,568
- Comps found
- 6
Show comp detail 6 sales within ~0.75 mi
| Address | Dist | Beds/Ba | Sqft | Sold | Price | $/sf | Match |
|---|---|---|---|---|---|---|---|
| 311 NE Second St. St | 0.00mi | 3/1.0 | 1,602 (0%) | 0mo | $134,000 | $84 | 98 |
| 200 NE 2nd St | 0.08mi | 3/1.5 | 1,812 (+13%) | 13mo | $115,000 | $63 | 64 |
| 200 High Street Se, St | 0.25mi | 3/1.0 | 1,373 (-14%) | 3mo | $100,000 | $73 | 60 |
| 606 NE Plum St | 0.23mi | 3/2.0 | 1,364 (-15%) | 12mo | $120,000 | $88 | 52 |
| 405 NE Plum St | 0.15mi | 2/2.5 (-1) | 1,422 (-11%) | 21mo | $135,000 | $95 | 48 |
| 714 Davidson St | 0.46mi | 2/1.5 (-1) | 1,824 (+14%) | 11mo | $115,000 | $63 | 42 |
Match score weights: distance 35% · size 25% · config 20% · recency 20%. Top-matched comps best support the ARV.
Projected returns pro-forma
6.63% appreciation · 3.0% rent growth · sell at horizon
- IRR
- 17.1%
- Equity multiple
- 2.18×
- Total profit
- $44,270
- Equity at exit
- $89,624
- IRR
- 16.7%
- Equity multiple
- 4.43×
- Total profit
- $128,720
- Equity at exit
- $167,395
Cash invested: $37,520 (down + closing). Projections, not guarantees.
Landlord ↔ Tenant lean methodology
- Overall (STATE)
- 83 Strongly Landlord-Friendly
- State Iowa
- 83 Strongly Landlord-Friendly · R+6
- County
- — inherits STATE
- City
- — inherits STATE
ZIP-level market 52043
- Home prices YoY
- 4.8%
- Active inventory
- 14
- Price-to-rent
- 9.4×
Monthly cashflow live
- Estimated rent
- $1,182 medium interval (Pro) →
- Mortgage (P&I)
- −$703
- Tax est. 1.5%
- −$168 /mo · $2,010/yr
- Insurance
- −$56
- HOA
- −$0
- Vacancy / Maint / Mgmt
- −$248
- Net cashflow
- $8
Break-even live
UW: 25.0% down · 7.5% · 30yr · 1.5% tax · 5.0% vac · 8.0% maint · 8.0% mgmt
Financing live
Cash to close
- Down payment
- $33,500
- Closing costs
- $4,020
- Reserves months
- —
- Total cash needed
- —
Loan-product check · same deal, 3 products live
Conventional
25% down · 7.5% · 30yr
- Down + closing
- —
- Monthly P&I
- —
- Monthly cashflow
- —
- DSCR
- —
- Eligible?
- —
Personal DTI + credit; lowest rate.
DSCR
20% down · 8.5% · 30yr
- Down + closing
- —
- Monthly P&I
- —
- Monthly cashflow
- —
- DSCR
- —
- Eligible?
- —
No personal income docs; deal must DSCR.
Hard money
10% down · 12.0% · 12mo
- Down + closing
- —
- Monthly P&I
- —
- Monthly cashflow
- —
- DSCR
- —
- Eligible?
- —
Short-term bridge; refi at stabilization.
Listing history 2 events
-
2026-05-13status Pending
-
2026-05-08$134,000 Active
ⓘ Source: listings_history table (triggers on properties + properties_extension) + one-shot
backfill from property_details.listing_events for pre-trigger history.
Climate risk First Street
- Flood 1/10 Low FEMA zone X (unshaded) · 0% chance over 30 yrs
- Wildfire 1/10 Low
- Heat 2/10 Low 7 d/yr ≥101°F today · 15 d/yr by 30 yrs out
- Wind 2/10 Low
- Air quality 1/10 Low 0 unhealthy d/yr today · 0 by 30 yrs out
Nearby sold comps map
Loading sold comps map…
Walkable amenities ~0.75 mi
Loading nearby amenities…
Taxation est. · year 1
- Rental income
- $14,186
- − Mortgage interest
- −$7,506
- − Property taxes
- −$2,010
- − Insurance
- −$670
- − Repairs & maintenance
- −$1,135
- − Management
- −$1,135
- − Depreciation
- −$3,898
- Taxable loss
- −$2,168
- Est. tax savings @ 24.0%
- +$520
- After-tax cash flow
- $615/yr
For passive investors: Depreciation is non-cash, so a rental often shows a tax loss while cash-flowing — sheltering income. Rental losses are passive: they offset passive income freely, and up to $25,000/yr can offset ordinary (W-2) income if you actively participate and your MAGI is under $100k (phasing out to $0 by $150k); unused losses carry forward. On sale, claimed depreciation is recaptured at up to 25%, and gains may owe capital-gains tax (a 1031 exchange can defer both). Figures are a year-1 estimate at your 24.0% rate — not tax advice; consult a CPA.
Schools (NCES district)
- District
- Central Community School District
- NCES district ID
- 1906840
- Math proficiency
- 56% ▼ -4.00%
- Reading proficiency
- 70% ▲ 7.00%
- Median HH income
- $49,750
- Composite
- 53.48/100
- National rank
- #1456
- State rank
- #214 of 289 in IA
Livability — Elkader
- Score
- 80/100
- State rank
- #77
- US rank
- #1634
Category grades
Schools grade is shown separately in the Schools card above.
Census & demographics
- Census place
- Elkader, IA
- Population (ZIP)
- 1,853
Population outlook (Clayton County) Hauer SSP2
- Today (2025)
- 16,656 people
- By 2030
- 15,986 · -4.0%
- By 2040
- 14,554 · -12.6%
- By 2050
- 13,187 · -20.8%
- By 2075
- 11,131 · -33.2%
- By 2100
- 9,733 · -41.6%
Race, ethnicity, and origin ACS 2023
- Neighborhood character
- Predominantly White (96%)
- Race & ethnicity
- White 96% Two or more races 4% Hispanic / Latino 3%
- Common ancestry
- Portuguese 11% Romanian 2% Iranian 1%
- Foreign-born
- 2% · Canada
- Languages at home
- 98% English-only · Spanish 2%
Political lean MEDSL · Clayton
- 2024 margin
- Solid R (+34.5) · D 32.2% · R 66.7% · Other 1.2%
- 2008→2024 swing
- -51.7pp toward R · 2008: 17.2pp · 2024: -34.5pp
- All cycles
- 2024: R+34.5 2020: R+28.8 2016: R+22.8 2012: D+6.9 2008: D+17.2
Not yet ingested
- Civics
- —
Market trends
- HPI YoY
- ▲ 6.63%
- Current HPI
- 143.93
- Rent YoY
- —
- Metro
- —
- State GDP YoY
- ▲ 2.48%
- F500 in state
- 4
Industry mix (Fortune 500 HQ in IA)
| Industry | F500 HQs | Revenue |
|---|---|---|
| Financial Services | 1 | $16B |
|
||
| Retail / Convenience | 1 | $15B |
|
||
Price history
2 events — show timeline
- 2026-05-13 Pending — NEIRBR as distributed by MLS GRID
- 2026-05-08 Listed $134,000 NEIRBR as distributed by MLS GRID
Property tax history
-12.2%/yrLatest (2025): $256 · +7.6% YoY. Source: county tax records.
Cash-flow waterfall
monthlySold comps — $/sqft
last 12 mo · ≤1 miLoading sold comps…