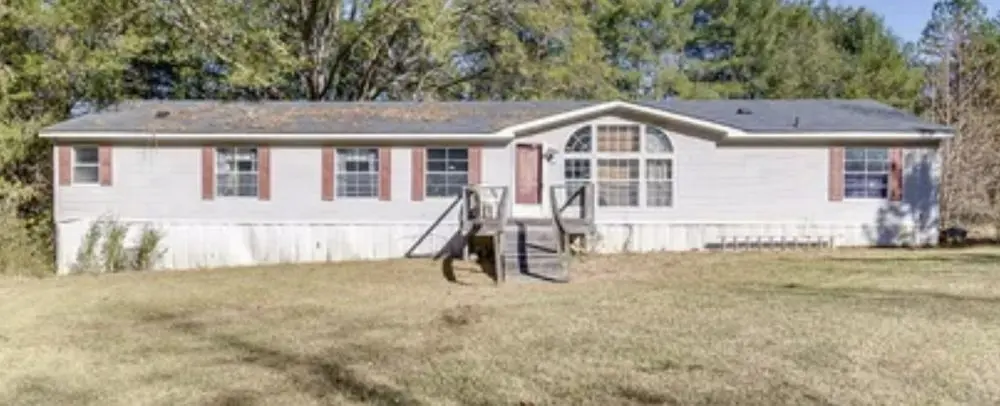
2962 Dacusville Hwy · Dacusville, SC
Flood risk 1/10 · Minimal
- FEMA flood zone
- X (unshaded)
- Chance of flooding over 30 yrs
- 0.0%
- Est. flood insurance / yr
- $507 – $1,088
Fire risk 4/10 · Minor
- Est. fire insurance / yr
- $783 – $1,453
Heat risk 5/10 · Moderate
- Hot days now (above 104°F)
- 7 days/yr
- Hot days in 30 yrs
- 17 days/yr
Wind risk 2/10 · Minimal
- Chance of severe wind over 30 yrs
- —
Air-quality risk 3/10 · Minor
- Unhealthy air days now
- 3 days/yr
- Unhealthy air days in 30 yrs
- 3 days/yr
Risk factors via First Street. Map © Google.
Why this score? — see what drove the D+ grade
The composite is a weighted blend of 9 inputs, each scored 0–100. Each bar is that input's sub-score; the figure is the points it added to the 100-point composite (weight × sub-score).
- Cash flow +15.0/30.0
- ARV discount +7.5/15.0
- 1% rule +5.0/10.0
- DSCR +5.0/10.0
- Rent growth +3.9/5.0
- Schools +3.9/10.0
- Livability +2.5/5.0
- Condition / age +2.5/5.0
- Appreciation +0.0/10.0
$45,000
🖨 Deal sheet 📄 Offer letter ✓ Due diligence
Listing remarks
If you are looking for space, this home has it! Home has 4 bedrooms, 2 bathrooms, office, living room, den, dining room, kitchen, kitchen nook and laundry room. MUST BE MOVED!! I can send more pictures with interest.
Key facts
- Built 1999
- Listed 14 days
Neighborhood map
What this means for you Summary
Snapshot
- This is a 4-bed/2.0-bath manufactured listed at $45k.
Deal economics
- At list price, monthly cash flow is $1k ($15k/yr) — positive.
- The deal already cash-flows at list — no discount required.
- Meets the 1% rule at list price ($2k rent vs $45k).
- Cap rate 39.4% vs local median 2.5% in Dacusville — top-decile yield for the area; either an underpriced asset or a hidden risk that comps aren't pricing in. Stress-test before assuming the spread holds.
Location & tenants
- Location reads: area grade D — affects rentability + tenant quality, not the cash-flow math above.
- Pickens 01 (rural): math 42% / reading 50% proficiency, ranked #21 of 80 in SC (top 26%) — families likely to look elsewhere, expect single-tenant / working-renter base with shorter leases.
- Market conditions: Rents rising fast (+5.7%/yr); 229 active listings in the ZIP; 1,440 units permitted in Pickens County in 2024 (245 in 5+ unit buildings).
- This rent runs 37% of the median local income ($62k/yr) — at the standard rent-burdened threshold; future hikes will face affordability resistance.
Forward outlook
- Local home prices are declining (-3.0%/yr); year-one equity from $311 of loan paydown is wiped out by about $1k of value loss. Plan a longer hold.
- Pickens County population projected at +6% by 2050 — modest demand growth; plan on rents tracking national, not racing it.
- At projected returns (-3.0% appreciation + 5.7% rent growth), your $13k cash investment doubles in ~1 year — after that, you're playing with house money.
Negotiation context
- Only 14 days on market — expect competitive offers; lowballing is unlikely to land.
- 3 sale attempts since 2y ago with the ask held roughly flat each time — persistent listings suggest the price (not the market) is what's stuck; bring a comps-based counter.
Risks & watch-outs
- Climate carrying-cost: extreme-heat days projected 7→17/yr by 2055 (HVAC capex compounding) — expect insurance premiums to compound above CPI over the hold.
Questions for the listing agent
- Is there a deadline driving the sale (1031 exchange, divorce, estate, relocation)? That informs how much negotiation room exists.
- The area grade is low — what's the realistic commute time and amenity access for the typical tenant pool here? Any planned neighborhood developments (good or bad) we should know about?
- What's the average days-on-market for RENTAL listings here right now (not sales)? A rising rental-DOM trend means longer vacancies and softer asking-rent achievability than the comps imply.
- What's the recent tenant-quality profile in this submarket — average credit score on applications, eviction rate, late-payment / NSF rate, and stable-employment percentage? A property-management company in the area should have these aggregated.
- How much new for-sale + rental construction is in the pipeline within 1–3 miles? Heavy new supply typically softens prices + rents 12–24 months out; constrained supply supports both.
Investment metrics
- 1% rule
- 4.25% ✓
- Cap rate
- 39.40%
- Cash-on-cash
- 118.25%
- DSCR
- 6.26
- GRM
- 2.0
CMA / ARV
No comps found within radius.
Projected returns pro-forma
-3.0% appreciation · 5.69% rent growth · sell at horizon
- IRR
- —
- Equity multiple
- 7.12×
- Total profit
- $77,112
- Equity at exit
- $6,710
- IRR
- —
- Equity multiple
- 16.24×
- Total profit
- $192,057
- Equity at exit
- $3,891
Cash invested: $12,600 (down + closing). Projections, not guarantees.
Landlord ↔ Tenant lean methodology
- Overall (STATE)
- 90 Strongly Landlord-Friendly
- State South Carolina
- 90 Strongly Landlord-Friendly · R+6
- County
- — inherits STATE
- City
- — inherits STATE
ZIP-level market 29640
- Home prices YoY
- -28.0%
- Rents YoY
- 5.7%
- Active inventory
- 229
- Price-to-rent
- 2.0×
Monthly cashflow live
- Estimated rent
- $1,914 medium interval (Pro) →
- Mortgage (P&I)
- −$236
- Tax from tax record
- −$15 /mo · $186/yr
- Insurance
- −$19
- HOA
- −$0
- Vacancy / Maint / Mgmt
- −$402
- Net cashflow
- $1,242
Break-even live
UW: 25.0% down · 7.5% · 30yr · 1.5% tax · 5.0% vac · 8.0% maint · 8.0% mgmt
Financing live
Cash to close
- Down payment
- $11,250
- Closing costs
- $1,350
- Reserves months
- —
- Total cash needed
- —
Loan-product check · same deal, 3 products live
Conventional
25% down · 7.5% · 30yr
- Down + closing
- —
- Monthly P&I
- —
- Monthly cashflow
- —
- DSCR
- —
- Eligible?
- —
Personal DTI + credit; lowest rate.
DSCR
20% down · 8.5% · 30yr
- Down + closing
- —
- Monthly P&I
- —
- Monthly cashflow
- —
- DSCR
- —
- Eligible?
- —
No personal income docs; deal must DSCR.
Hard money
10% down · 12.0% · 12mo
- Down + closing
- —
- Monthly P&I
- —
- Monthly cashflow
- —
- DSCR
- —
- Eligible?
- —
Short-term bridge; refi at stabilization.
Listing history 11 events
-
2026-06-18days on market $45,000 Active 14 DOM
-
2026-06-17days on market $45,000 Active 13 DOM
-
2026-06-16days on market $45,000 Active 12 DOM
-
2026-06-15days on market $45,000 Active 11 DOM
-
2026-06-13days on market $45,000 Active 9 DOM
-
2026-06-10days on market $45,000 Active 6 DOM
-
2026-06-09days on market $45,000 Active 5 DOM
-
2026-06-08days on market $45,000 Active 4 DOM
-
2026-06-07days on market $45,000 Active 3 DOM
-
2026-06-05remarks 216-char remark
-
2026-06-05$45,000 Active 1 DOM
ⓘ Source: listings_history table (triggers on properties + properties_extension) + one-shot
backfill from property_details.listing_events for pre-trigger history.
Tax reassessment forecast SC · Resets to sale price
- Current annual tax
- $186 · $15/mo
- Projected year-2 tax
- $256 · $21/mo
- Expected delta
- +$71/yr (+$6/mo · 38.2%)
ⓘ Screening estimate from a state-policy table — verify with the county assessor before closing.
Climate risk First Street
- Flood 1/10 Low FEMA zone X (unshaded) · 0% chance over 30 yrs
- Wildfire 4/10 Moderate
- Heat 5/10 Major 7 d/yr ≥104°F today · 17 d/yr by 30 yrs out
- Wind 2/10 Low
- Air quality 3/10 Moderate 3 unhealthy d/yr today · 3 by 30 yrs out
Nearby sold comps map
Loading sold comps map…
Walkable amenities ~0.75 mi
Loading nearby amenities…
Taxation est. · year 1
- Rental income
- $22,965
- − Mortgage interest
- −$2,521
- − Property taxes
- −$186
- − Insurance
- −$225
- − Repairs & maintenance
- −$1,837
- − Management
- −$1,837
- − Depreciation
- −$1,309
- Taxable income
- $15,050
- Est. tax owed @ 24.0%
- −$3,612
- After-tax cash flow
- $11,288/yr
For passive investors: Depreciation is non-cash, so a rental often shows a tax loss while cash-flowing — sheltering income. Rental losses are passive: they offset passive income freely, and up to $25,000/yr can offset ordinary (W-2) income if you actively participate and your MAGI is under $100k (phasing out to $0 by $150k); unused losses carry forward. On sale, claimed depreciation is recaptured at up to 25%, and gains may owe capital-gains tax (a 1031 exchange can defer both). Figures are a year-1 estimate at your 24.0% rate — not tax advice; consult a CPA.
Schools (NCES district)
- District
- Pickens 01
- NCES district ID
- 4503330
- Math proficiency
- 42% ▼ -11.00%
- Reading proficiency
- 50% ▼ -2.00%
- Median HH income
- $42,534
- Composite
- 38.73/100
- National rank
- #4130
- State rank
- #21 of 80 in SC
Livability — Dacusville
No livability data for this city. (Only ~50 U.S. cities are tracked.)
Census & demographics
- County
- Pickens County · 102,825 people
- Metro
- Greenville-Anderson, SC
- Population (ZIP)
- 33,142
- Household income
- $62,207
- Rent vs Own
- Severe rent burden
- 789.0
Population outlook (Pickens County) Hauer SSP2
- Today (2025)
- 126,530 people
- By 2030
- 128,780 · +1.8%
- By 2040
- 132,151 · +4.4%
- By 2050
- 133,800 · +5.7%
- By 2075
- 137,594 · +8.7%
- By 2100
- 139,784 · +10.5%
Race, ethnicity, and origin ACS 2023
- Neighborhood character
- Predominantly White (81%)
- Race & ethnicity
- White 81% Hispanic / Latino 8% Black 8% Two or more races 4%
- Hispanic origin (detail)
- Mexican 4% Puerto Rican 3%
- Common ancestry
- Slovak 2% Serbian 2% Italian 2%
- Foreign-born
- 3% · Canada
- Languages at home
- 95% English-only · Spanish 4%
Political lean MEDSL · Pickens
- 2024 margin
- Solid R (+52.7) · D 23.0% · R 75.6% · Other 1.4%
- 2008→2024 swing
- -6.4pp toward R · 2008: -46.2pp · 2024: -52.7pp
- All cycles
- 2024: R+52.7 2020: R+50.9 2016: R+52.7 2012: R+49.0 2008: R+46.2
Not yet ingested
- Civics
- —
Market trends
- HPI YoY
- ▼ -106.69%
- Current HPI
- 274.4751
- Rent YoY
- ▲ 5.69%
- Metro
- Greenville-Anderson, SC
- State GDP YoY
- ▲ 4.51%
- F500 in state
- 2
Industry mix (Fortune 500 HQ in SC)
| Industry | F500 HQs | Revenue |
|---|---|---|
| Packaging | 1 | $7B |
|
||
Price history
-72.7% since first listed7 events — show timeline
- 2026-06-04 Listed $45,000 ForSaleByOwner.com
- 2025-01-02 Pending — WUMLS
- 2025-01-02 Pending — Greater Greenville MLS
- 2025-01-01 Listing Removed — Greater Greenville MLS
- 2025-01-01 Listing Removed — WUMLS
- 2024-11-24 Listed $165,000 Greater Greenville MLS
- 2024-11-24 Listed $165,000 WUMLS
Property tax history
+7.5%/yrLatest (2025): $186 · +7.3% YoY. Source: county tax records.
Cash-flow waterfall
monthlySold comps — $/sqft
last 12 mo · ≤1 miLoading sold comps…