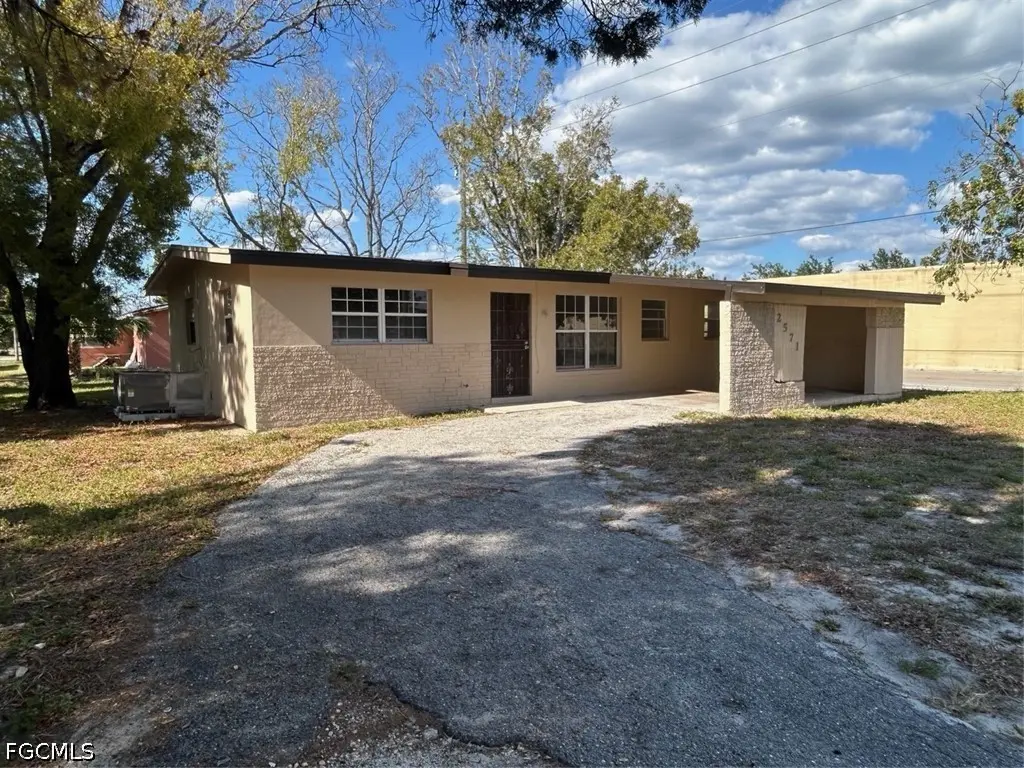
2571 Parkway St · Fort Myers, FL
Flood risk 3/10 · Minor
- FEMA flood zone
- X (unshaded)
- Chance of flooding over 30 yrs
- 0.07%
- Est. flood insurance / yr
- $507 – $1,088
Fire risk 1/10 · Minimal
- Est. fire insurance / yr
- $947 – $1,759
Heat risk 10/10 · Severe
- Hot days now (above 107°F)
- 7 days/yr
- Hot days in 30 yrs
- 31 days/yr
Wind risk 10/10 · Severe
- Chance of severe wind over 30 yrs
- 99.0%
Air-quality risk 2/10 · Minimal
- Unhealthy air days now
- 1 days/yr
- Unhealthy air days in 30 yrs
- 1 days/yr
Risk factors via First Street. Map © Google.
Why this score? — see what drove the C grade
The composite is a weighted blend of 9 inputs, each scored 0–100. Each bar is that input's sub-score; the figure is the points it added to the 100-point composite (weight × sub-score).
- Cash flow +18.5/30.0
- ARV discount +15.0/15.0
- DSCR +5.8/10.0
- 1% rule +4.8/10.0
- Livability +4.3/5.0
- Schools +4.1/10.0
- Condition / age +2.5/5.0
- Rent growth +1.7/5.0
- Appreciation +0.0/10.0
$159,000
🖨 Deal sheet 📄 Offer letter ✓ Due diligence
Listing remarks
Great Location, Easy to Show * Fresh Paint * Tile Floors * Original House. HVAC 2025, ROOF 2010, WATER HEATER 2022 * Large driveway with second pad on side street. Rear slider is secured - Not Operable - SOLD AS-IS
Key facts
- Large driveway
- Tile floors
- 8,450 sq ft lot
Tags
Property features AI
Finance
- Financial info: Pets allowed
- HOA & community: No association fee
Exterior
- Parking: Attached carport (1 covered space); Detached/covered driveway access with circular, paved driveway
- Utilities: Public water; Public sewer; Cable available
- Home design: Single-story; Resale property; Faces west; RS-7 zoning
- Construction: Block, concrete and stucco construction; Rolled/hot mop roof
- Exterior features: Open patio and porch; Patio; Porch; Corner lot; East exposures; Public maintained road
Interior
- Kitchen: Range
- Bedrooms: Two secondary bedrooms (each about 10 x 11); Primary bedroom (about 12 x 15)
- Flooring: Tile
- Bathrooms: Two full bathrooms; Shower-only configuration with separate shower
- Heating & cooling: Central electric heating; Central electric cooling (central air)
- Interior features: Single-hung windows; Built-in features; Living/dining room; Main-level primary; Bedroom on main level; Split bedrooms; Separate shower (shower only)
- Laundry & utility: Washer hookup inside; Dryer hookup inside
Neighborhood map
What this means for you Summary
Snapshot
- This is a 3-bed/2.0-bath single-family listed at $159k.
Deal economics
- At list price, monthly cash flow is $150 ($2k/yr) — positive.
- The deal already cash-flows at list — no discount required.
- To meet the 1% rule (rent ≥ 1% of price), the offer needs to be $156k (2.1% below list).
- Recommended offer: $156k (2.1% below list) — sets the bar for 1% rule.
- Cap rate 7.4% vs local median 3.0% in Fort Myers — top-decile yield for the area; either an underpriced asset or a hidden risk that comps aren't pricing in. Stress-test before assuming the spread holds.
Location & tenants
- Location reads 86/100 on livability (#14 in FL, #383 nationally) — a professional / high-income tenant draw. Strengths: amenities A+, commute A+, housing A+.
- Lee (suburban): math 47% / reading 50% proficiency, ranked #42 of 73 in FL (top 58%) — families likely to look elsewhere, expect single-tenant / working-renter base with shorter leases.
- Market conditions: Rents falling (-3.2%/yr); 286 active listings in the ZIP; 40 comparable units currently listed for rent nearby; rentals at typical pace (median 24d on market — plan ~3-4 weeks tenant-placement turnaround); 15,411 units permitted in Lee County in 2024 (4,686 in 5+ unit buildings).
- This rent runs 36% of the median local income ($52k/yr) — at the standard rent-burdened threshold; future hikes will face affordability resistance.
Forward outlook
- Local home prices are declining (-3.0%/yr); year-one equity from $1k of loan paydown is wiped out by about $5k of value loss. Plan a longer hold.
- Lee County population projected at +44% by 2050 — long-run rental-demand tailwind backs the buy-and-hold thesis.
Negotiation context
- Only 4 days on market — expect competitive offers; lowballing is unlikely to land.
- Current owner paid $88k; list at $159k implies a 81% gain — meaningful room to come down on a strong offer.
Risks & watch-outs
- Climate carrying-cost: severe wind risk, 99% chance of damaging wind over 30y; extreme-heat days projected 7→31/yr by 2055 (HVAC capex compounding) — expect insurance premiums to compound above CPI over the hold.
Questions for the listing agent
- Built in 1970 — when were the roof, HVAC, electrical panel, plumbing, and water heater last replaced?
- Is there a deadline driving the sale (1031 exchange, divorce, estate, relocation)? That informs how much negotiation room exists.
- What's the average days-on-market for RENTAL listings here right now (not sales)? A rising rental-DOM trend means longer vacancies and softer asking-rent achievability than the comps imply.
- What's the recent tenant-quality profile in this submarket — average credit score on applications, eviction rate, late-payment / NSF rate, and stable-employment percentage? A property-management company in the area should have these aggregated.
- How much new for-sale + rental construction is in the pipeline within 1–3 miles? Heavy new supply typically softens prices + rents 12–24 months out; constrained supply supports both.
Investment metrics
- 1% rule
- 0.98% ✗
- Cap rate
- 7.43%
- Cash-on-cash
- 4.05%
- DSCR
- 1.18
- GRM
- 8.5
CMA / ARV
- ARV (on-the-fly)
- $205,800
- Comps found
- 3
Show comp detail 3 sales within ~0.75 mi
| Address | Dist | Beds/Ba | Sqft | Sold | Price | $/sf | Match |
|---|---|---|---|---|---|---|---|
| 2571 Parkway St | 0.00mi | 3/2.0 | 1,050 (0%) | 0mo | $161,000 | $153 | 100 |
| 3547 Central Ave | 0.37mi | 3/2.0 | 1,034 (-2%) | 8mo | $202,500 | $196 | 73 |
| 20 Broadway Cir | 0.42mi | 3/2.0 | 1,176 (+12%) | 11mo | $269,900 | $230 | 52 |
Match score weights: distance 35% · size 25% · config 20% · recency 20%. Top-matched comps best support the ARV.
Projected returns pro-forma
-3.0% appreciation · 0.0% rent growth · sell at horizon
- IRR
- -13.3%
- Equity multiple
- 0.53×
- Total profit
- $-20,749
- Equity at exit
- $23,707
- IRR
- -9.9%
- Equity multiple
- 0.48×
- Total profit
- $-23,336
- Equity at exit
- $13,747
Cash invested: $44,520 (down + closing). Projections, not guarantees.
Landlord ↔ Tenant lean methodology
- Overall (STATE)
- 87 Strongly Landlord-Friendly
- State Florida
- 87 Strongly Landlord-Friendly · R+3
- County
- — inherits STATE
- City
- — inherits STATE
ZIP-level market 33901
- Home prices YoY
- -25.9%
- Rents YoY
- -3.2%
- Active inventory
- 286
- Price-to-rent
- 8.5×
Monthly cashflow live
- Estimated rent
- $1,557 high interval (Pro) →
- Mortgage (P&I)
- −$834
- Tax from tax record
- −$180 /mo · $2,159/yr
- Insurance
- −$66
- HOA
- −$0
- Vacancy / Maint / Mgmt
- −$327
- Net cashflow
- $150
Break-even live
UW: 25.0% down · 7.5% · 30yr · 1.5% tax · 5.0% vac · 8.0% maint · 8.0% mgmt
Financing live
Cash to close
- Down payment
- $39,750
- Closing costs
- $4,770
- Reserves months
- —
- Total cash needed
- —
Loan-product check · same deal, 3 products live
Conventional
25% down · 7.5% · 30yr
- Down + closing
- —
- Monthly P&I
- —
- Monthly cashflow
- —
- DSCR
- —
- Eligible?
- —
Personal DTI + credit; lowest rate.
DSCR
20% down · 8.5% · 30yr
- Down + closing
- —
- Monthly P&I
- —
- Monthly cashflow
- —
- DSCR
- —
- Eligible?
- —
No personal income docs; deal must DSCR.
Hard money
10% down · 12.0% · 12mo
- Down + closing
- —
- Monthly P&I
- —
- Monthly cashflow
- —
- DSCR
- —
- Eligible?
- —
Short-term bridge; refi at stabilization.
Rent comps 40 comps
| Address | Beds | Baths | Sqft | Rent | $/sqft | DOM | Units | Dist |
|---|---|---|---|---|---|---|---|---|
| 3585 Central Ave Fort Myers, FL | 1.0–2.0 | 1.0–2.0 | 1000 | $1,450 | $1.45 | 24d | 1 | 0.44mi |
| 2405 Hanson St Fort Myers, FL | 2.0 | 1.0 | 882 | $1,125 | $1.28 | 2d | 2 | 0.47mi |
| 33 Broadway Cir Fort Myers, FL | 3.0 | 2.0 | 1122 | $1,800 | $1.60 | 16d | 1 | 0.47mi |
| 2950 Royal Palm Ave Fort Myers, FL | 2.0 | 1.0 | 732 | $1,522 | $2.08 | 24d | 1 | 0.51mi |
| 2650 Park Windsor Dr #111 Fort Myers, FL | 2.0 | 2.0 | 752 | $1,300 | $1.73 | 24d | 1 | 0.55mi |
| 2680 Park Windsor Dr #503 Fort Myers, FL | 2.0 | 2.0 | 752 | $1,300 | $1.73 | 2d | 1 | 0.56mi |
| 2320 Maple Ave Fort Myers, FL | 2.0 | 2.0 | 861 | $1,300 | $1.51 | 3d | 1 | 0.57mi |
| 2408 Linhart Ave Fl , USA Fort Myers, FL | 2.0 | 1.0 | 792 | $1,175 | $1.48 | 24d | 1 | 0.57mi |
| 2700 Park Windsor Dr #713 Fort Myers, FL | 2.0 | 2.0 | 752 | $1,500 | $1.99 | 16d | 1 | 0.57mi |
| 2690 Park Windsor Dr #601 Fort Myers, FL | 2.0 | 2.0 | 752 | $1,374 | $1.83 | 24d | 1 | 0.58mi |
| 2310 Maple Ave Fort Myers, FL | 2.0 | 1.0 | 750 | $1,250 | $1.67 | 3d | 1 | 0.58mi |
| 2103 Unity Ave Fort Myers, FL | 4.0 | 2.0 | 1456 | $1,900 | $1.30 | 24d | 1 | 0.61mi |
| 2944 Jackson St Fort Myers, FL | 2.0 | 1.0 | 796 | $1,099 | $1.38 | 24d | 1 | 0.64mi |
| 2920 Jackson St Fort Myers, FL | 2.0 | 1.5 | 980 | $1,200 | $1.22 | 3d | 1 | 0.65mi |
| 2811-2845 Central Ave Fort Myers, FL | 2.0 | 1.0 | 798 | $1,395 | $1.75 | 24d | 1 | 0.65mi |
| 3647 Pine Oak Cir #107 Fort Myers, FL | 3.0 | 2.5 | 1447 | $1,749 | $1.21 | 21d | 1 | 0.69mi |
| 3647 Pine Oak Cir #107 Fort Myers, FL | 3.0 | 2.5 | 1447 | $1,749 | $1.21 | 3d | 1 | 0.69mi |
| 3726 Central Ave Fort Myers, FL | 1.0–2.0 | 1.0–2.0 | 907 | $1,700 | $1.87 | 24d | 1 | 0.69mi |
| 2817 Jackson St Fort Myers, FL | 3.0 | 2.0 | 1200 | $2,200 | $1.83 | 24d | 1 | 0.71mi |
| 2828 Jackson St Fort Myers, FL | 2.0 | 2.0 | 1159 | $1,438 | $1.24 | 3d | 5 | 0.71mi |
| 2119-2123 Hanson St Fort Myers, FL | 2.0 | 1.0 | 850 | $1,150 | $1.35 | 24d | 1 | 0.72mi |
| 3643 Pine Oak Cir #105 Fort Myers, FL | 3.0 | 2.5 | 1447 | $1,800 | $1.24 | 24d | 1 | 0.73mi |
| 3637 Pine Oak Cir #105 Fort Myers, FL | 2.0 | 2.5 | 1447 | $1,750 | $1.21 | 3d | 1 | 0.74mi |
| 3704 Broadway #101 Fort Myers, FL | 2.0 | 1.0 | 910 | $1,100 | $1.21 | 24d | 1 | 0.77mi |
| 3706 Broadway Unit A29 Fort Myers, FL | 2.0 | 2.0 | 949 | $1,250 | $1.32 | 24d | 1 | 0.79mi |
| 1942 Passaic Ave Apt 8 Fort Myers, FL | 2.0 | 1.0 | 750 | $995 | $1.33 | 24d | 1 | 0.79mi |
| 3706 Broadway #30 Fort Myers, FL | 2.0 | 2.0 | 962 | $1,100 | $1.14 | 24d | 1 | 0.81mi |
| 3706 Broadway #29 Fort Myers, FL | 2.0 | 2.0 | 949 | $1,150 | $1.21 | 3d | 1 | 0.81mi |
| 3604 Cedar Oak Dr Fort Myers, FL | 3.0 | 2.5 | 1434 | $1,650 | $1.15 | 16d | 1 | 0.82mi |
| 1935 Ricardo Ave Fort Myers, FL | 2.0 | 1.0 | 810 | $895 | $1.10 | 10d | 1 | 0.82mi |
| 2121 Collier Ave Fort Myers, FL | 2.0 | 2.0 | 958 | $1,375 | $1.44 | 11d | 4 | 0.83mi |
| 2121 Collier Ave Fort Myers, FL | 2.0 | 2.0 | 958 | $1,448 | $1.51 | 3d | 3 | 0.83mi |
| 3620 Pine Oak Cir #105 Fort Myers, FL | 2.0 | 2.5 | 1206 | $1,700 | $1.41 | 24d | 1 | 0.85mi |
| 3630 Pine Oak Cir #105 Fort Myers, FL | 3.0 | 2.5 | 1434 | $1,750 | $1.22 | 24d | 1 | 0.85mi |
| 3891 Solomon Blvd Fort Myers, FL | 1.0–3.0 | 1.0–2.0 | 856 | $1,819 | $2.12 | 2d | 23 | 0.85mi |
| 3629 Pine Oak Cir #102 Fort Myers, FL | 2.0 | 2.5 | 1394 | $1,699 | $1.22 | 24d | 1 | 0.86mi |
| 3629 Pine Oak Cir #102 Fort Myers, FL | 2.0 | 2.5 | 1450 | $1,699 | $1.17 | 21d | 1 | 0.86mi |
| 2039 Kurtz St Fort Myers, FL | 2.0 | 1.0 | 810 | $1,200 | $1.48 | 10d | 1 | 0.86mi |
| 1915 Braman Ave Unit 05 Fort Myers, FL | 2.0 | 1.0 | 850 | $1,150 | $1.35 | 16d | 1 | 0.87mi |
| 2865 Winkler Ave #411 Fort Myers, FL | 2.0 | 2.0 | 883 | $1,250 | $1.42 | 24d | 1 | 0.88mi |
Listing history 10 events
-
2026-05-11status Pending
-
2026-05-07$159,000 Active
-
2004-08-25soldstatus $87,900
-
2004-08-05soldstatus $87,900
-
2004-07-02price $88,000
-
2000-08-01soldstatus $70,000
-
2000-08-01soldstatus $70,000
-
1997-12-09soldstatus $62,500
-
1997-12-09soldstatus $62,500
-
1997-10-30soldstatus $30,100
ⓘ Source: listings_history table (triggers on properties + properties_extension) + one-shot
backfill from property_details.listing_events for pre-trigger history.
Tax reassessment forecast FL · Resets to sale price
- Current annual tax
- $2,159 · $180/mo
- Projected year-2 tax
- $2,159 · $180/mo
- Expected delta
- $0/yr ($0/mo · 0.0%)
ⓘ Screening estimate from a state-policy table — verify with the county assessor before closing.
Climate risk First Street
- Flood 3/10 Moderate FEMA zone X (unshaded) · 7% chance over 30 yrs
- Wildfire 1/10 Low
- Heat 10/10 Extreme 7 d/yr ≥107°F today · 31 d/yr by 30 yrs out
- Wind 10/10 Extreme 99% chance of damaging wind over 30 yrs
- Air quality 2/10 Low 1 unhealthy d/yr today · 1 by 30 yrs out
Nearby sold comps map
Loading sold comps map…
Walkable amenities ~0.75 mi
Loading nearby amenities…
Taxation est. · year 1
- Rental income
- $18,686
- − Mortgage interest
- −$8,906
- − Property taxes
- −$2,159
- − Insurance
- −$795
- − Repairs & maintenance
- −$1,495
- − Management
- −$1,495
- − Depreciation
- −$4,625
- Taxable loss
- −$789
- Est. tax savings @ 24.0%
- +$189
- After-tax cash flow
- $1,992/yr
For passive investors: Depreciation is non-cash, so a rental often shows a tax loss while cash-flowing — sheltering income. Rental losses are passive: they offset passive income freely, and up to $25,000/yr can offset ordinary (W-2) income if you actively participate and your MAGI is under $100k (phasing out to $0 by $150k); unused losses carry forward. On sale, claimed depreciation is recaptured at up to 25%, and gains may owe capital-gains tax (a 1031 exchange can defer both). Figures are a year-1 estimate at your 24.0% rate — not tax advice; consult a CPA.
Schools (NCES district)
- District
- Lee
- NCES district ID
- 1201080
- Math proficiency
- 47% ▼ -11.00%
- Reading proficiency
- 50% ▼ -4.00%
- Median HH income
- $49,518
- Composite
- 41.49/100
- National rank
- #3458
- State rank
- #42 of 73 in FL
Livability — Fort Myers
- Score
- 86/100
- State rank
- #14
- US rank
- #383
Category grades
Schools grade is shown separately in the Schools card above.
Census & demographics
- Census place
- Fort Myers, FL
- County
- Lee County · 788,662 people
- City population
- 278,598
- Metro
- Cape Coral-Fort Myers, FL
- Population (ZIP)
- 24,481
- Household income
- $51,816
- Rent vs Own
- Severe rent burden
- 1782.0
Population outlook (Lee County) Hauer SSP2
- Today (2025)
- 871,946 people
- By 2030
- 955,468 · +9.6%
- By 2040
- 1,113,587 · +27.7%
- By 2050
- 1,256,891 · +44.1%
- By 2075
- 1,560,270 · +78.9%
- By 2100
- 1,726,848 · +98.0%
Race, ethnicity, and origin ACS 2023
- Neighborhood character
- Diverse neighborhood (Simpson 0.65)
- Race & ethnicity
- White 50% Hispanic / Latino 23% Black 22% Two or more races 15% Asian 1%
- Hispanic origin (detail)
- Mexican 6% Puerto Rican 4% Cuban 4%
- Common ancestry
- Hispanic 7% Estonian 2% Lithuanian 2%
- Foreign-born
- 22% · Canada, Jamaica
- Languages at home
- 68% English-only · Spanish 18% French/Haitian/Cajun 8% Other Indo-European 4%
Political lean MEDSL · Lee
- 2024 margin
- Strong R (+28.4) · D 35.5% · R 63.9%
- 2008→2024 swing
- -18.0pp toward R · 2008: -10.4pp · 2024: -28.4pp
- All cycles
- 2024: R+28.4 2020: R+19.2 2016: R+20.4 2012: R+16.6 2008: R+10.4
Not yet ingested
- Civics
- —
Market trends
- HPI YoY
- ▼ -108.70%
- Current HPI
- 311.8283
- Rent YoY
- ▼ -3.23%
- Metro
- Cape Coral-Fort Myers, FL
- State GDP YoY
- ▲ 3.28%
- F500 in state
- 36
Industry mix (Fortune 500 HQ in FL)
| Industry | F500 HQs | Revenue |
|---|---|---|
| Industrial Technology | 2 | $29B |
|
||
| Insurance | 2 | $17B |
|
||
| Retail | 1 | $60B |
|
||
| Technology Distribution | 1 | $58B |
|
||
| Homebuilding | 1 | $35B |
|
||
| Technology Manufacturing | 1 | $35B |
|
||
Price history
+428.2% since first listed10 events — show timeline
- 2026-05-11 Pending — FORTMLS
- 2026-05-07 Listed $159,000 FORTMLS
- 2004-08-25 Sold (Public Records) $87,900 Public Records
- 2004-08-05 Sold (MLS) $87,900 FORTMLS
- 2004-07-02 Price Changed $88,000 FORTMLS
- 2000-08-01 Sold (Public Records) $70,000 Public Records
- 2000-08-01 Sold (Public Records) $70,000 Public Records
- 1997-12-09 Sold (Public Records) $62,500 Public Records
- 1997-12-09 Sold (Public Records) $62,500 Public Records
- 1997-10-30 Sold (Public Records) $30,100 Public Records
Property tax history
+8.5%/yrLatest (2025): $2,159 · -1.2% YoY. Source: county tax records.
Cash-flow waterfall
monthlySold comps — $/sqft
last 12 mo · ≤1 miLoading sold comps…