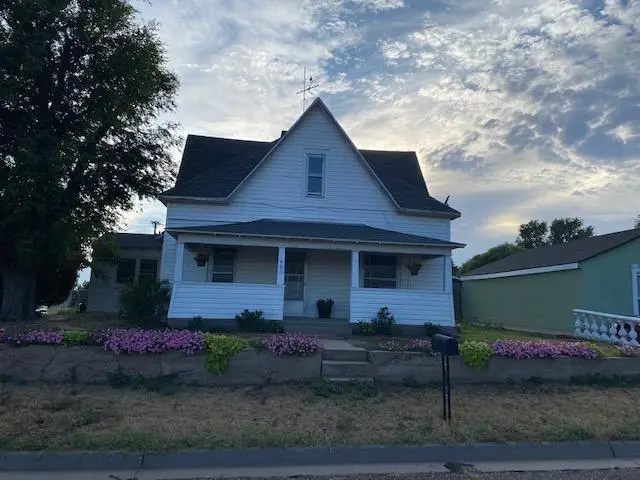
401 Main St · Kismet, KS
Flood risk 1/10 · Minimal
- FEMA flood zone
- X (unshaded)
- Chance of flooding over 30 yrs
- 0.0%
- Est. flood insurance / yr
- $507 – $1,088
Fire risk 7/10 · Major
- Est. fire insurance / yr
- $1,154 – $2,142
Heat risk 5/10 · Moderate
- Hot days now (above 102°F)
- 7 days/yr
- Hot days in 30 yrs
- 19 days/yr
Wind risk 2/10 · Minimal
- Chance of severe wind over 30 yrs
- —
Air-quality risk 2/10 · Minimal
- Unhealthy air days now
- 1 days/yr
- Unhealthy air days in 30 yrs
- 1 days/yr
Risk factors via First Street. Map © Google.
Why this score? — see what drove the B grade
The composite is a weighted blend of 9 inputs, each scored 0–100. Each bar is that input's sub-score; the figure is the points it added to the 100-point composite (weight × sub-score).
- Cash flow +30.0/30.0
- 1% rule +10.0/10.0
- DSCR +10.0/10.0
- ARV discount +7.5/15.0
- Appreciation +6.1/10.0
- Livability +3.2/5.0
- Rent growth +2.5/5.0
- Condition / age +2.5/5.0
- Schools +1.3/10.0
$58,000
🖨 Deal sheet (PDF) 📄 Offer letter ✓ Due diligence
Key facts
- Front porch swing
- Updated electrical
- Gas stove
Tags
Property features AI
Finance
- Other: Listing broker: Heritage Real Estate Group, Inc
- Financial info: Annual tax amount listed
Exterior
- Parking: 2-car garage
- Utilities: Public water; Public sewer; Natural gas available
- Home design: Single-family residence; 2-story
- Construction: Vinyl siding; Composition roof; Partial basement
- Exterior features: Covered patio/porch; 56 x 140 lot dimensions; Lot is approximately 0.18 acre; Zoned for single-family dwelling
Interior
- Kitchen: Cooktop; Gas range; Refrigerator
- Bathrooms: 1 full bathroom
- Heating & cooling: Natural gas heating; Central heating
- Interior features: Cooktop; Gas range; Refrigerator; Gas water heater; Partial basement
Neighborhood map
What this means for you Summary
Snapshot
- This is a 3-bed/1.0-bath single-family listed at $58k.
Deal economics
- At list price, monthly cash flow is $523 ($6k/yr) — positive.
- The deal already cash-flows at list — no discount required.
- Meets the 1% rule at list price ($1k rent vs $58k).
- Recommended offer: $51k (12.0% below list) — sets the bar for market timing.
Location & tenants
- Location reads 65/100 on livability (#284 in KS) — a middle-class / working-renter tenant base. Strengths: cost of living A+, housing A+, health & safety A+; Watch: schools F, crime F, amenities F.
- Kismet-Plains (rural): math 12% / reading 16% proficiency, ranked #166 of 169 in KS (top 98%) — low school quality limits family demand, transient renter base, plan for 1-2y turnover; 61% free/reduced lunch — lower-income household profile, screen leases tightly.
- Market conditions: 5 active listings in the ZIP; 23 units permitted in Seward County in 2024 (0 in 5+ unit buildings).
Forward outlook
- In year one you build about $2k of equity ($401 loan paydown + $1k appreciation (2.1% local appreciation)).
- Seward County population projected at +12% by 2050 — modest demand growth; plan on rents tracking national, not racing it.
- At projected returns (2.1% appreciation + 3.0% rent growth), your $16k cash investment doubles in ~3 years — after that, you're playing with house money.
Negotiation context
- It's been on market 491 days — a 12% lower offer ($51k) is reasonable based on typical stale-listing flexibility.
- 3 sale attempts since 4y ago with the ask held roughly flat each time — persistent listings suggest the price (not the market) is what's stuck; bring a comps-based counter.
Risks & watch-outs
- Watch-outs: built in 1920 — expect roof / HVAC / electrical / plumbing capex.
- Climate carrying-cost: major wildfire risk; extreme-heat days projected 7→19/yr by 2055 (HVAC capex compounding) — expect insurance premiums to compound above CPI over the hold.
Questions for the listing agent
- It's been on market 491 days. Have you received any prior offers? Is the seller open to a 12% concession, seller financing, or rate buy-down credit?
- Built in 1920 — when were the roof, HVAC, electrical panel, plumbing, and water heater last replaced?
- Why hasn't it sold? Are there any deal-killer items the seller is aware of (foundation, flood, title, zoning, code violations)?
- Is there a deadline driving the sale (1031 exchange, divorce, estate, relocation)? That informs how much negotiation room exists.
- Schools are F-rated, which usually means shorter tenancies and higher turnover. Who's the typical renter profile here, and what's been the actual vacancy rate?
- Crime grade is F in this area — have there been break-ins, vandalism, or insurance claims at this property in the last 3 years? What carrier currently insures it and at what premium?
- What's the average days-on-market for RENTAL listings here right now (not sales)? A rising rental-DOM trend means longer vacancies and softer asking-rent achievability than the comps imply.
- What's the recent tenant-quality profile in this submarket — average credit score on applications, eviction rate, late-payment / NSF rate, and stable-employment percentage? A property-management company in the area should have these aggregated.
- How much new for-sale + rental construction is in the pipeline within 1–3 miles? Heavy new supply typically softens prices + rents 12–24 months out; constrained supply supports both.
Investment metrics
- 1% rule
- 2.07% ✓
- Cap rate
- 17.10%
- Cash-on-cash
- 38.61%
- DSCR
- 2.72
- GRM
- 4.0
CMA / ARV
No comps found within radius.
Projected returns pro-forma
2.11% appreciation · 3.0% rent growth · sell at horizon
- IRR
- 42.8%
- Equity multiple
- 3.32×
- Total profit
- $37,605
- Equity at exit
- $23,214
- IRR
- 43.6%
- Equity multiple
- 6.59×
- Total profit
- $90,761
- Equity at exit
- $33,689
Cash invested: $16,240 (down + closing). Projections, not guarantees.
Landlord ↔ Tenant lean methodology
- Overall (STATE)
- 83 Strongly Landlord-Friendly
- State Kansas
- 83 Strongly Landlord-Friendly · R+10
- County
- — inherits STATE
- City
- — inherits STATE
ZIP-level market 67859
- Home prices YoY
- 1.6%
- Active inventory
- 5
- Price-to-rent
- 4.0×
Monthly cashflow live
- Estimated rent
- $1,198 medium interval (Pro) →
- Mortgage (P&I)
- −$304
- Tax from tax record
- −$95 /mo · $1,145/yr
- Insurance
- −$24
- HOA
- −$0
- Vacancy / Maint / Mgmt
- −$252
- Net cashflow
- $523
Break-even live
Sensitivity live
| Price | -10% $555 | -5% $539 | +0% $523 | +5% $506 | +10% $490 |
|---|---|---|---|---|---|
| Rent | -10% $428 | -5% $475 | +0% $523 | +5% $570 | +10% $617 |
| Rate | -1.0pp $552 | -0.5pp $537 | base $523 | +0.5pp $507 | +1.0pp $492 |
UW: 25.0% down · 7.5% · 30yr · 1.5% tax · 5.0% vac · 8.0% maint · 8.0% mgmt
Financing live
Cash to close
- Down payment
- $14,500
- Closing costs
- $1,740
- Reserves months
- —
- Total cash needed
- —
Loan-product check · same deal, 3 products live
Conventional
25% down · 7.5% · 30yr
- Down + closing
- —
- Monthly P&I
- —
- Monthly cashflow
- —
- DSCR
- —
- Eligible?
- —
Personal DTI + credit; lowest rate.
DSCR
20% down · 8.5% · 30yr
- Down + closing
- —
- Monthly P&I
- —
- Monthly cashflow
- —
- DSCR
- —
- Eligible?
- —
No personal income docs; deal must DSCR.
Hard money
10% down · 12.0% · 12mo
- Down + closing
- —
- Monthly P&I
- —
- Monthly cashflow
- —
- DSCR
- —
- Eligible?
- —
Short-term bridge; refi at stabilization.
Listing history 21 events
-
2026-06-21days on market $58,000 Active 491 DOM
-
2026-06-18days on market $58,000 Active 489 DOM
-
2026-06-17days on market $58,000 Active 488 DOM
-
2026-06-16days on market $58,000 Active 487 DOM
-
2026-06-15days on market $58,000 Active 486 DOM
-
2026-06-13days on market $58,000 Active 484 DOM
-
2026-06-12days on market $58,000 Active 483 DOM
-
2026-06-09days on market $58,000 Active 480 DOM
-
2026-06-08days on market $58,000 Active 479 DOM
-
2026-06-07days on market $58,000 Active 478 DOM
-
2026-06-05days on market $58,000 Active 476 DOM
-
2026-06-04days on market $58,000 Active 474 DOM
-
2026-06-02days on market $58,000 Active 473 DOM
-
2026-06-01days on market $58,000 Active 472 DOM
-
2026-05-31days on market $58,000 Active 471 DOM
-
2026-05-31days on market $58,000 Active 470 DOM
-
2025-02-14$58,000 Active
-
2023-08-23historical
-
2023-04-27status Active
-
2023-04-26historical
-
2022-07-29$58,000 Active
ⓘ Source: listings_history table (triggers on properties + properties_extension) + one-shot
backfill from property_details.listing_events for pre-trigger history.
Tax reassessment forecast KS · Resets to sale price
- Current annual tax
- $1,145 · $95/mo
- Projected year-2 tax
- $1,145 · $95/mo
- Expected delta
- $0/yr ($0/mo · 0.0%)
ⓘ Screening estimate from a state-policy table — verify with the county assessor before closing.
Climate risk First Street
- Flood 1/10 Low FEMA zone X (unshaded) · 0% chance over 30 yrs
- Wildfire 7/10 Severe
- Heat 5/10 Major 7 d/yr ≥102°F today · 19 d/yr by 30 yrs out
- Wind 2/10 Low
- Air quality 2/10 Low 1 unhealthy d/yr today · 1 by 30 yrs out
Nearby sold comps map
Loading sold comps map…
Walkable amenities ~0.75 mi
Loading nearby amenities…
Taxation est. · year 1
- Rental income
- $14,373
- − Mortgage interest
- −$3,249
- − Property taxes
- −$1,145
- − Insurance
- −$290
- − Repairs & maintenance
- −$1,150
- − Management
- −$1,150
- − Depreciation
- −$1,687
- Taxable income
- $5,703
- Est. tax owed @ 24.0%
- −$1,369
- After-tax cash flow
- $4,902/yr
For passive investors: Depreciation is non-cash, so a rental often shows a tax loss while cash-flowing — sheltering income. Rental losses are passive: they offset passive income freely, and up to $25,000/yr can offset ordinary (W-2) income if you actively participate and your MAGI is under $100k (phasing out to $0 by $150k); unused losses carry forward. On sale, claimed depreciation is recaptured at up to 25%, and gains may owe capital-gains tax (a 1031 exchange can defer both). Figures are a year-1 estimate at your 24.0% rate — not tax advice; consult a CPA.
Schools (NCES district)
- District
- Kismet-Plains
- NCES district ID
- 2008190
- Math proficiency
- 12% ▼ -12.00%
- Reading proficiency
- 16% ▼ -2.00%
- Median HH income
- $49,718
- Composite
- 12.9/100
- National rank
- #9584
- State rank
- #166 of 169 in KS
Livability — Kismet
- Score
- 65/100
- State rank
- #284
- US rank
- #12775
Category grades
Schools grade is shown separately in the Schools card above.
Census & demographics
- Census place
- Kismet, KS
- Population (ZIP)
- 648
Population outlook (Seward County) Hauer SSP2
- Today (2025)
- 24,106 people
- By 2030
- 24,590 · +2.0%
- By 2040
- 25,797 · +7.0%
- By 2050
- 27,053 · +12.2%
- By 2075
- 30,074 · +24.8%
- By 2100
- 31,968 · +32.6%
Race, ethnicity, and origin ACS 2023
- Neighborhood character
- Majority White (61%)
- Race & ethnicity
- White 61% Hispanic / Latino 32% Two or more races 11% Asian 3%
- Hispanic origin (detail)
- Mexican 30%
- Common ancestry
- Iranian 3% Italian 1% Scottish 1%
- Foreign-born
- 18% · Canada, China, Philippines
- Languages at home
- 76% English-only · Spanish 23% Other Asian/Pacific 1%
Political lean MEDSL · Seward
- 2024 margin
- Solid R (+39.0) · D 29.7% · R 68.6% · Other 1.7%
- 2008→2024 swing
- +4.1pp toward D · 2008: -43.1pp · 2024: -39.0pp
- All cycles
- 2024: R+39.0 2020: R+30.4 2016: R+32.3 2012: R+42.4 2008: R+43.1
Not yet ingested
- Civics
- —
Market trends
- HPI YoY
- ▲ 2.11%
- Current HPI
- 136.3828
- Rent YoY
- —
- Metro
- —
- State GDP YoY
- —
- F500 in state
- 0
Price history
+0.0% since first listed5 events — show timeline
- 2025-02-14 Listed $58,000 SWKSBOR
- 2023-08-23 Delisted — SWKSBOR
- 2023-04-27 Relisted — SWKSBOR
- 2023-04-26 Delisted — SWKSBOR
- 2022-07-29 Listed $58,000 SWKSBOR
Property tax history
+5.0%/yrLatest (2025): $1,145 · +51.2% YoY. Source: county tax records.
Cash-flow waterfall
monthlySold comps — $/sqft
last 12 mo · ≤1 miLoading sold comps…