1313 W Water St · Pinckneyville, IL
Flood risk 1/10 · Minimal
- FEMA flood zone
- X (unshaded)
- Chance of flooding over 30 yrs
- 0.0%
- Est. flood insurance / yr
- $473 – $860
Fire risk 1/10 · Minimal
- Est. fire insurance / yr
- $804 – $1,492
Heat risk 5/10 · Moderate
- Hot days now (above 106°F)
- 7 days/yr
- Hot days in 30 yrs
- 21 days/yr
Wind risk 2/10 · Minimal
- Chance of severe wind over 30 yrs
- 1.0%
Air-quality risk 2/10 · Minimal
- Unhealthy air days now
- 1 days/yr
- Unhealthy air days in 30 yrs
- 1 days/yr
Risk factors via First Street. Map © Google.
Why this score? — see what drove the B- grade
The composite is a weighted blend of 9 inputs, each scored 0–100. Each bar is that input's sub-score; the figure is the points it added to the 100-point composite (weight × sub-score).
- Cash flow +30.0/30.0
- 1% rule +10.0/10.0
- DSCR +10.0/10.0
- ARV discount +7.5/15.0
- Livability +3.2/5.0
- Schools +2.6/10.0
- Rent growth +2.5/5.0
- Condition / age +2.5/5.0
- Appreciation +0.0/10.0
$49,900
🖨 Deal sheet 📄 Offer letter ✓ Due diligence
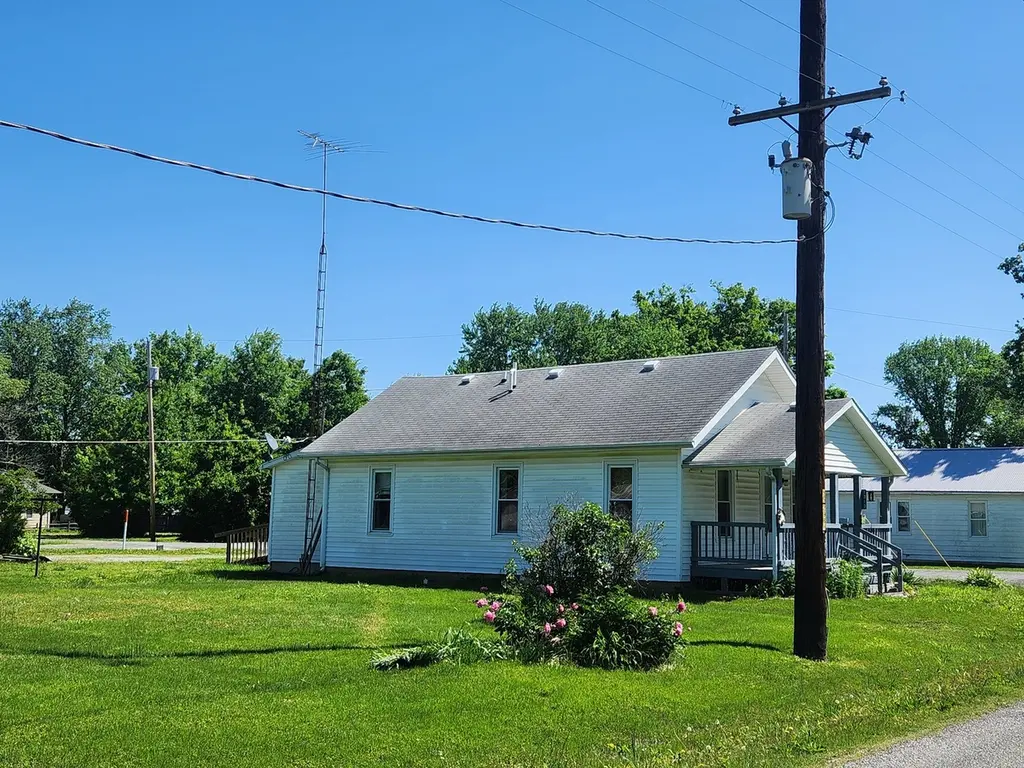
Listing remarks
Charming 3- bedroom home on spacious triple corner lot! - Opportunity awaits - exterior features vinyl siding and replacement windows and inviting covered front porch - perfect place to relax and enjoy the neighborhood - 2 car detached garage with easy ally access and additional parking space - comfortable floor plan featuring LR and DR combo - utility room with washer and dryer - affordable space and great lot size - bring your vision to make this home shine
Key facts
- Covered front porch
- Easy ally access
- Triple corner lot
Tags
Property features AI
Finance
- Other: Ownership: Fee simple
- HOA & community: No master association fee required
Exterior
- Parking: Detached garage (2 garage spaces, 2 total parking spaces)
- Utilities: Public water; Public sewer
- Home design: Detached single-family home; One-story
- Construction: Vinyl siding; Built approximately 81–90 years ago; Home built before 1978
- Exterior features: Lot dimensions approximately 138 x 134; Quarter to half acre lot (.25-.49 acre); Unincorporated location
Interior
- Kitchen: Range; Refrigerator
- Bedrooms: Three bedrooms (all on the main level); Bedroom dimensions: 9 x 10, 10 x 10, and 9 x 10
- Bathrooms: One full bathroom
- Heating & cooling: Natural gas heating; Window air conditioning units
- Interior features: Five total rooms; Ceiling fan(s)
- Laundry & utility: Dedicated laundry room
Neighborhood map
What this means for you Summary
Snapshot
- This is a 3-bed/1.0-bath single-family listed at $50k.
Deal economics
- At list price, monthly cash flow is $373 ($4k/yr) — positive.
- The deal already cash-flows at list — no discount required.
- Meets the 1% rule at list price ($909 rent vs $50k).
- Recommended offer: $48k (3.0% below list) — sets the bar for market timing.
Location & tenants
- Location reads 63/100 on livability (#772 in IL) — a middle-class / working-renter tenant base. Strengths: crime A+, cost of living A+, housing A-; Watch: amenities F, commute F, employment F.
- Pinckneyville Chsd 101 (town): math 25% / reading 30% proficiency, ranked #557 of 919 in IL (top 61%) — low school quality limits family demand, transient renter base, plan for 1-2y turnover.
- Zoned schools: Pinckneyville Comm High School (math 17% / reading 17%, grade F, #430 of 693 statewide, top 66%, 429 students, 0% FRL).
- Market conditions: 33 active listings in the ZIP; 20 units permitted in Perry County in 2024 (0 in 5+ unit buildings).
Forward outlook
- Local home prices are declining (-3.0%/yr); year-one equity from $345 of loan paydown is wiped out by about $1k of value loss. Plan a longer hold.
- Perry County population projected at -19% by 2050 — secular population decline; favor cash flow + early exit over multi-decade hold.
- At projected returns (-3.0% appreciation + 3.0% rent growth), your $14k cash investment doubles in ~4 years — after that, you're playing with house money.
Negotiation context
- It's been on market 49 days — a 3% lower offer ($48k) is reasonable based on typical stale-listing flexibility.
Risks & watch-outs
- Watch-outs: built in 1936 — expect roof / HVAC / electrical / plumbing capex.
- Climate carrying-cost: extreme-heat days projected 7→21/yr by 2055 (HVAC capex compounding) — expect insurance premiums to compound above CPI over the hold.
Questions for the listing agent
- It's been on market 49 days. Have you received any prior offers? Is the seller open to a 3% concession, seller financing, or rate buy-down credit?
- Built in 1936 — when were the roof, HVAC, electrical panel, plumbing, and water heater last replaced?
- Is there a deadline driving the sale (1031 exchange, divorce, estate, relocation)? That informs how much negotiation room exists.
- Schools are F-rated, which usually means shorter tenancies and higher turnover. Who's the typical renter profile here, and what's been the actual vacancy rate?
- What's the average days-on-market for RENTAL listings here right now (not sales)? A rising rental-DOM trend means longer vacancies and softer asking-rent achievability than the comps imply.
- What's the recent tenant-quality profile in this submarket — average credit score on applications, eviction rate, late-payment / NSF rate, and stable-employment percentage? A property-management company in the area should have these aggregated.
- How much new for-sale + rental construction is in the pipeline within 1–3 miles? Heavy new supply typically softens prices + rents 12–24 months out; constrained supply supports both.
Investment metrics
- 1% rule
- 1.82% ✓
- Cap rate
- 15.27%
- Cash-on-cash
- 32.08%
- DSCR
- 2.43
- GRM
- 4.6
CMA / ARV
- ARV (on-the-fly)
- $25,296
- Comps found
- 1
Show comp detail 1 sale within ~0.75 mi
| Address | Dist | Beds/Ba | Sqft | Sold | Price | $/sf | Match |
|---|---|---|---|---|---|---|---|
| 718 W Water St | 0.62mi | 2/1.0 (-1) | 881 (+8%) | 2mo | $27,500 | $31 | 51 |
Match score weights: distance 35% · size 25% · config 20% · recency 20%. Top-matched comps best support the ARV.
Projected returns pro-forma
-3.0% appreciation · 3.0% rent growth · sell at horizon
- IRR
- 27.1%
- Equity multiple
- 2.12×
- Total profit
- $15,715
- Equity at exit
- $7,440
- IRR
- 34.7%
- Equity multiple
- 4.18×
- Total profit
- $44,370
- Equity at exit
- $4,314
Cash invested: $13,972 (down + closing). Projections, not guarantees.
Landlord ↔ Tenant lean methodology
- Overall (STATE)
- 43 Moderately Tenant-Leaning
- State Illinois
- 43 Moderately Tenant-Leaning · D+7
- County
- — inherits STATE
- City
- — inherits STATE
ZIP-level market 62274
- Home prices YoY
- -30.7%
- Active inventory
- 33
- Price-to-rent
- 4.6×
Monthly cashflow live
- Estimated rent
- $909 medium interval (Pro) →
- Mortgage (P&I)
- −$262
- Tax est. 1.5%
- −$62 /mo · $748/yr
- Insurance
- −$21
- HOA
- −$0
- Vacancy / Maint / Mgmt
- −$191
- Net cashflow
- $373
Break-even live
UW: 25.0% down · 7.5% · 30yr · 1.5% tax · 5.0% vac · 8.0% maint · 8.0% mgmt
Financing live
Cash to close
- Down payment
- $12,475
- Closing costs
- $1,497
- Reserves months
- —
- Total cash needed
- —
Loan-product check · same deal, 3 products live
Conventional
25% down · 7.5% · 30yr
- Down + closing
- —
- Monthly P&I
- —
- Monthly cashflow
- —
- DSCR
- —
- Eligible?
- —
Personal DTI + credit; lowest rate.
DSCR
20% down · 8.5% · 30yr
- Down + closing
- —
- Monthly P&I
- —
- Monthly cashflow
- —
- DSCR
- —
- Eligible?
- —
No personal income docs; deal must DSCR.
Hard money
10% down · 12.0% · 12mo
- Down + closing
- —
- Monthly P&I
- —
- Monthly cashflow
- —
- DSCR
- —
- Eligible?
- —
Short-term bridge; refi at stabilization.
Listing history 16 events
-
2026-06-18days on market $49,900 Active 49 DOM
-
2026-06-17days on market $49,900 Active 48 DOM
-
2026-06-16days on market $49,900 Active 47 DOM
-
2026-06-15days on market $49,900 Active 46 DOM
-
2026-06-13days on market $49,900 Active 44 DOM
-
2026-06-12days on market $49,900 Active 43 DOM
-
2026-06-09days on market $49,900 Active 40 DOM
-
2026-06-08days on market $49,900 Active 39 DOM
-
2026-06-07days on market $49,900 Active 38 DOM
-
2026-06-07days on market $49,900 Active 37 DOM
-
2026-06-04days on market $49,900 Active 34 DOM
-
2026-06-02days on market $49,900 Active 33 DOM
-
2026-06-01days on market $49,900 Active 32 DOM
-
2026-05-31days on market $49,900 Active 31 DOM
-
2026-05-31days on market $49,900 Active 30 DOM
-
2026-04-30$49,900 Active
ⓘ Source: listings_history table (triggers on properties + properties_extension) + one-shot
backfill from property_details.listing_events for pre-trigger history.
Climate risk First Street
- Flood 1/10 Low FEMA zone X (unshaded) · 0% chance over 30 yrs
- Wildfire 1/10 Low
- Heat 5/10 Major 7 d/yr ≥106°F today · 21 d/yr by 30 yrs out
- Wind 2/10 Low 100% chance of damaging wind over 30 yrs
- Air quality 2/10 Low 1 unhealthy d/yr today · 1 by 30 yrs out
Nearby sold comps map
Loading sold comps map…
Walkable amenities ~0.75 mi
Loading nearby amenities…
Taxation est. · year 1
- Rental income
- $10,911
- − Mortgage interest
- −$2,795
- − Property taxes
- −$748
- − Insurance
- −$250
- − Repairs & maintenance
- −$873
- − Management
- −$873
- − Depreciation
- −$1,452
- Taxable income
- $3,921
- Est. tax owed @ 24.0%
- −$941
- After-tax cash flow
- $3,541/yr
For passive investors: Depreciation is non-cash, so a rental often shows a tax loss while cash-flowing — sheltering income. Rental losses are passive: they offset passive income freely, and up to $25,000/yr can offset ordinary (W-2) income if you actively participate and your MAGI is under $100k (phasing out to $0 by $150k); unused losses carry forward. On sale, claimed depreciation is recaptured at up to 25%, and gains may owe capital-gains tax (a 1031 exchange can defer both). Figures are a year-1 estimate at your 24.0% rate — not tax advice; consult a CPA.
Schools (NCES district)
- District
- Pinckneyville Chsd 101
- NCES district ID
- 1731620
- Math proficiency
- 25% ▼ -10.00%
- Reading proficiency
- 30% ▲ 5.00%
- Median HH income
- $43,433
- Composite
- 26.43/100
- National rank
- #12648
- State rank
- #557 of 919 in IL
Livability — Pinckneyville
- Score
- 63/100
- State rank
- #772
- US rank
- #15454
Category grades
Schools grade is shown separately in the Schools card above.
Census & demographics
- Census place
- Pinckneyville, IL
- Population (ZIP)
- 8,147
Population outlook (Perry County) Hauer SSP2
- Today (2025)
- 19,868 people
- By 2030
- 19,131 · -3.7%
- By 2040
- 17,720 · -10.8%
- By 2050
- 16,057 · -19.2%
- By 2075
- 11,979 · -39.7%
- By 2100
- 8,434 · -57.5%
Race, ethnicity, and origin ACS 2023
- Neighborhood character
- Predominantly White (78%)
- Race & ethnicity
- White 78% Black 14% Hispanic / Latino 6% Two or more races 4% Asian 1%
- Hispanic origin (detail)
- Mexican 6%
- Common ancestry
- Romanian 5% Lithuanian 3% Slovak 1%
- Foreign-born
- 2% · Canada
- Languages at home
- 94% English-only · Spanish 4% Other Indo-European 1%
Political lean MEDSL · Perry
- 2024 margin
- Solid R (+52.0) · D 23.2% · R 75.2% · Other 1.6%
- 2008→2024 swing
- -48.1pp toward R · 2008: -3.9pp · 2024: -52.0pp
- All cycles
- 2024: R+52.0 2020: R+46.7 2016: R+45.1 2012: R+17.7 2008: R+3.9
Not yet ingested
- Civics
- —
Market trends
- HPI YoY
- ▼ -62.13%
- Current HPI
- 140.388
- Rent YoY
- —
- Metro
- —
- State GDP YoY
- ▲ 1.59%
- F500 in state
- 60
Industry mix (Fortune 500 HQ in IL)
| Industry | F500 HQs | Revenue |
|---|---|---|
| Insurance | 4 | $201B |
|
||
| Consumer Goods | 4 | $87B |
|
||
| Industrial Machinery | 3 | $64B |
|
||
| Healthcare | 2 | $55B |
|
||
| Retail / Pharmacy | 1 | $148B |
|
||
| Agriculture / Food | 1 | $86B |
|
||
Price history
1 event — show timeline
- 2026-04-30 Listed $49,900 MRED as Distributed by MLS Grid
Cash-flow waterfall
monthlySold comps — $/sqft
last 12 mo · ≤1 miLoading sold comps…