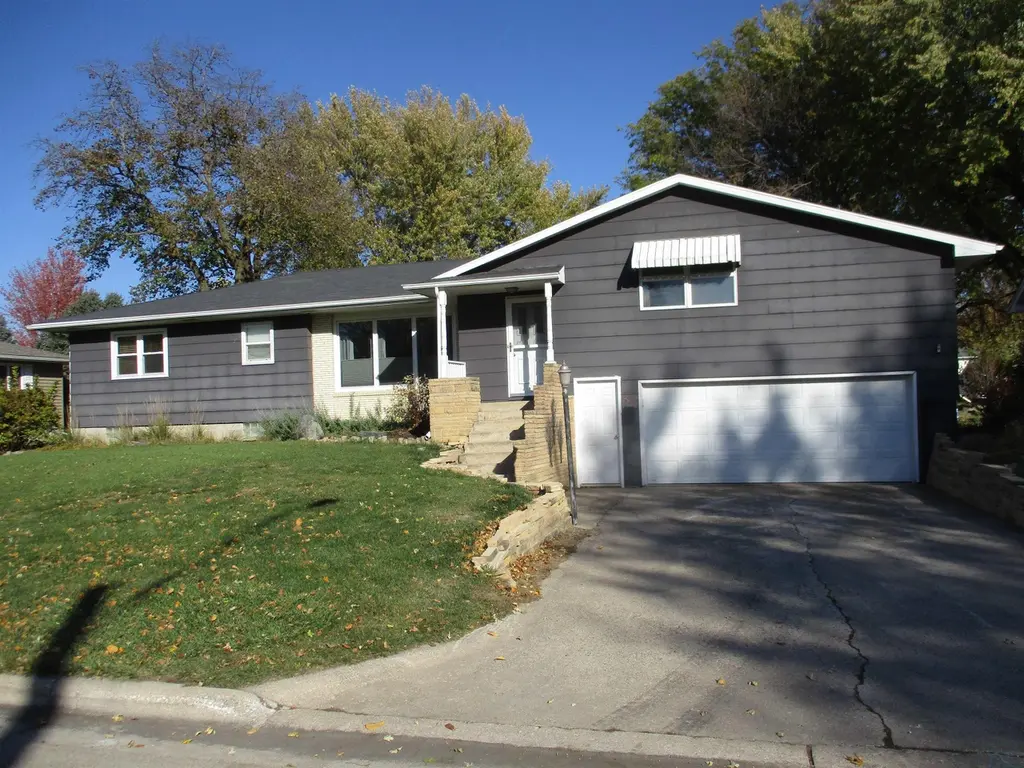
526 W Arthur St · Laurens, IA
Flood risk 5/10 · Moderate
- FEMA flood zone
- X (unshaded)
- Chance of flooding over 30 yrs
- 0.47%
- Est. flood insurance / yr
- $473 – $860
Fire risk 1/10 · Minimal
- Est. fire insurance / yr
- $902 – $1,676
Heat risk 2/10 · Minimal
- Hot days now (above 100°F)
- 7 days/yr
- Hot days in 30 yrs
- 15 days/yr
Wind risk 2/10 · Minimal
- Chance of severe wind over 30 yrs
- —
Air-quality risk 1/10 · Minimal
- Unhealthy air days now
- 0 days/yr
- Unhealthy air days in 30 yrs
- 0 days/yr
Risk factors via First Street. Map © Google.
Why this score? — see what drove the D grade
The composite is a weighted blend of 9 inputs, each scored 0–100. Each bar is that input's sub-score; the figure is the points it added to the 100-point composite (weight × sub-score).
- Cash flow +13.8/30.0
- Appreciation +7.1/10.0
- Schools +4.8/10.0
- 1% rule +4.2/10.0
- DSCR +4.2/10.0
- Livability +3.7/5.0
- Rent growth +2.5/5.0
- Condition / age +2.5/5.0
- ARV discount +0.0/15.0
$153,900
🖨 Deal sheet (PDF) 📄 Offer letter ✓ Due diligence
Listing remarks
Welcome to your 4 bedroom, two bath home. This home has been well maintained and is waiting for you. The main floor has a kitchen, formal dining room, living room, three bedrooms and an updated bath. In the upper level you will find the primary bedroom with a bath as well as laundry. There is TONS of storage throughout the home. The lower level is partially finished waiting for your touches to make into an extra living space. There is a screened porch and a glassed in porch to enjoy your backyard oasis. All of this with a two stall built in garage.
Key facts
- 0.34 acre lot
- 2 garage spots
- Built 1961
Property features AI
Exterior
- Parking: 2-car garage with garage door opener; Concrete driveway/parking
- Utilities: Public water; Public sewer
- Home design: Single-family residence; Residential property
- Construction: Vinyl siding; Shingle roof; Below-grade finished area
- Exterior features: Porch; Landscaped yard with a few trees
Interior
- Bathrooms: 2 full bathrooms
- Heating & cooling: Central air conditioning; Natural gas heating; Hot water (boiler) heating
- Interior features: Fireplace; Full, partially finished basement
Neighborhood map
What this means for you Summary
Snapshot
- This is a 4-bed/2.0-bath single-family listed at $154k.
Deal economics
- At list price, monthly cash flow is $13 ($160/yr) — positive.
- The deal already cash-flows at list — no discount required.
- To meet the 1% rule (rent ≥ 1% of price), the offer needs to be $142k (7.7% below list).
- Recommended offer: $142k (7.7% below list) — sets the bar for 1% rule.
Location & tenants
- Location reads 74/100 on livability (#248 in IA, #4,769 nationally) — a middle-class / working-renter tenant base. Strengths: crime A+, cost of living A+, housing A+; Watch: employment D, amenities F, commute F.
- Laurens-Marathon Community School District (rural): math 55% / reading 55% proficiency, ranked #311 of 330 in IA (top 94%) — acceptable for families but not a draw, mixed tenant base, ~2y average lease.
- Zoned schools: Laurens-Marathon Elementary School (math 74% / reading 54%, grade B, #317 of 616 statewide, top 58%, 140 students, 51% FRL) — zoned schools at 51% FRL track the district average.
- Market conditions: 2 active listings in the ZIP; 1 units permitted in Pocahontas County in 2024 (0 in 5+ unit buildings).
Forward outlook
- In year one you build about $7k of equity ($1k loan paydown + $6k appreciation (4.2% local appreciation)).
- At projected returns (4.2% appreciation + 3.0% rent growth), your $43k cash investment doubles in ~5 years — after that, you're playing with house money.
- By year 5, paydown + projected appreciation supports a ~$32k cash-out refi (75% LTV) — recoverable capital for the next deal without selling this one.
Negotiation context
- It's been on market 45 days — a 3% lower offer ($149k) is reasonable based on typical stale-listing flexibility.
- 2 sale attempts with the ask held roughly flat each time — persistent listings suggest the price (not the market) is what's stuck; bring a comps-based counter.
Risks & watch-outs
- Climate carrying-cost: moderate flood risk — expect insurance premiums to compound above CPI over the hold.
Questions for the listing agent
- It's been on market 45 days. Have you received any prior offers? Is the seller open to a 8% concession, seller financing, or rate buy-down credit?
- Built in 1961 — when were the roof, HVAC, electrical panel, plumbing, and water heater last replaced?
- Is there a deadline driving the sale (1031 exchange, divorce, estate, relocation)? That informs how much negotiation room exists.
- Schools are B-rated — typically a magnet for longer-tenancy family renters. What's the average tenant stay here, and is there a school-zone premium baked into asking?
- The area grade is low — what's the realistic commute time and amenity access for the typical tenant pool here? Any planned neighborhood developments (good or bad) we should know about?
- What's the average days-on-market for RENTAL listings here right now (not sales)? A rising rental-DOM trend means longer vacancies and softer asking-rent achievability than the comps imply.
- What's the recent tenant-quality profile in this submarket — average credit score on applications, eviction rate, late-payment / NSF rate, and stable-employment percentage? A property-management company in the area should have these aggregated.
- How much new for-sale + rental construction is in the pipeline within 1–3 miles? Heavy new supply typically softens prices + rents 12–24 months out; constrained supply supports both.
Investment metrics
- 1% rule
- 0.92% ✗
- Cap rate
- 6.40%
- Cash-on-cash
- 0.37%
- DSCR
- 1.02
- GRM
- 9.0
CMA / ARV
- ARV (median comp)
- $131,501
- List price
- $153,900
- Delta
- 17.03%
- Verdict
- OVERPRICED
- Comps
- 16 within 1.0 mi
Show comp detail 2 sales within ~0.75 mi
| Address | Dist | Beds/Ba | Sqft | Sold | Price | $/sf | Match |
|---|---|---|---|---|---|---|---|
| 315 Oak St | 0.56mi | 3/3.0 (-1) | 3,010 (+2%) | 2mo | $164,000 | $54 | 59 |
| 318 Oak St | 0.58mi | 5/2.0 (+1) | 2,604 (-11%) | 10mo | $207,500 | $80 | 40 |
Match score weights: distance 35% · size 25% · config 20% · recency 20%. Top-matched comps best support the ARV.
Projected returns pro-forma
4.15% appreciation · 3.0% rent growth · sell at horizon
- IRR
- 11.0%
- Equity multiple
- 1.67×
- Total profit
- $29,006
- Equity at exit
- $79,378
- IRR
- 12.6%
- Equity multiple
- 3.11×
- Total profit
- $90,915
- Equity at exit
- $130,916
Cash invested: $43,092 (down + closing). Projections, not guarantees.
Landlord ↔ Tenant lean methodology
- Overall (STATE)
- 83 Strongly Landlord-Friendly
- State Iowa
- 83 Strongly Landlord-Friendly · R+6
- County
- — inherits STATE
- City
- — inherits STATE
ZIP-level market 50544
- Home prices YoY
- 2.8%
- Active inventory
- 2
- Price-to-rent
- 9.0×
Monthly cashflow live
- Estimated rent
- $1,421 medium interval (Pro) →
- Mortgage (P&I)
- −$807
- Tax from tax record
- −$238 /mo · $2,854/yr
- Insurance
- −$64
- HOA
- −$0
- Vacancy / Maint / Mgmt
- −$298
- Net cashflow
- $13
Break-even live
Sensitivity live
| Price | -10% $100 | -5% $57 | +0% $13 | +5% $-30 | +10% $-74 |
|---|---|---|---|---|---|
| Rent | -10% $-99 | -5% $-43 | +0% $13 | +5% $69 | +10% $126 |
| Rate | -1.0pp $91 | -0.5pp $52 | base $13 | +0.5pp $-27 | +1.0pp $-67 |
UW: 25.0% down · 7.5% · 30yr · 1.5% tax · 5.0% vac · 8.0% maint · 8.0% mgmt
Financing live
Cash to close
- Down payment
- $38,475
- Closing costs
- $4,617
- Reserves months
- —
- Total cash needed
- —
Loan-product check · same deal, 3 products live
Conventional
25% down · 7.5% · 30yr
- Down + closing
- —
- Monthly P&I
- —
- Monthly cashflow
- —
- DSCR
- —
- Eligible?
- —
Personal DTI + credit; lowest rate.
DSCR
20% down · 8.5% · 30yr
- Down + closing
- —
- Monthly P&I
- —
- Monthly cashflow
- —
- DSCR
- —
- Eligible?
- —
No personal income docs; deal must DSCR.
Hard money
10% down · 12.0% · 12mo
- Down + closing
- —
- Monthly P&I
- —
- Monthly cashflow
- —
- DSCR
- —
- Eligible?
- —
Short-term bridge; refi at stabilization.
Listing history 20 events
-
2026-06-21days on market $153,900 Active 45 DOM
-
2026-06-21days on market $153,900 Active 44 DOM
-
2026-06-18days on market $153,900 Active 42 DOM
-
2026-06-17days on market $153,900 Active 41 DOM
-
2026-06-16days on market $153,900 Active 40 DOM
-
2026-06-15days on market $153,900 Active 39 DOM
-
2026-06-13days on market $153,900 Active 37 DOM
-
2026-06-12days on market $153,900 Active 36 DOM
-
2026-06-09days on market $153,900 Active 33 DOM
-
2026-06-08days on market $153,900 Active 32 DOM
-
2026-06-07days on market $153,900 Active 31 DOM
-
2026-06-05days on market $153,900 Active 29 DOM
-
2026-06-04days on market $153,900 Active 27 DOM
-
2026-06-02days on market $153,900 Active 26 DOM
-
2026-06-01days on market $153,900 Active 25 DOM
-
2026-05-31days on market $153,900 Active 24 DOM
-
2026-05-31days on market $153,900 Active 23 DOM
-
2026-05-07$153,900 Active 556-char remark
-
2026-04-02price $153,900
-
2025-11-05$167,500 Active
ⓘ Source: listings_history table (triggers on properties + properties_extension) + one-shot
backfill from property_details.listing_events for pre-trigger history.
Tax reassessment forecast IA · Partial reset (capped growth)
- Current annual tax
- $2,854 · $238/mo
- Projected year-2 tax
- $2,854 · $238/mo
- Expected delta
- $0/yr ($0/mo · 0.0%)
ⓘ Screening estimate from a state-policy table — verify with the county assessor before closing.
Climate risk First Street
- Flood 5/10 Major FEMA zone X (unshaded) · 47% chance over 30 yrs
- Wildfire 1/10 Low
- Heat 2/10 Low 7 d/yr ≥100°F today · 15 d/yr by 30 yrs out
- Wind 2/10 Low
- Air quality 1/10 Low 0 unhealthy d/yr today · 0 by 30 yrs out
Nearby sold comps map
Loading sold comps map…
Walkable amenities ~0.75 mi
Loading nearby amenities…
Taxation est. · year 1
- Rental income
- $17,049
- − Mortgage interest
- −$8,621
- − Property taxes
- −$2,854
- − Insurance
- −$770
- − Repairs & maintenance
- −$1,364
- − Management
- −$1,364
- − Depreciation
- −$4,477
- Taxable loss
- −$2,401
- Est. tax savings @ 24.0%
- +$576
- After-tax cash flow
- $736/yr
For passive investors: Depreciation is non-cash, so a rental often shows a tax loss while cash-flowing — sheltering income. Rental losses are passive: they offset passive income freely, and up to $25,000/yr can offset ordinary (W-2) income if you actively participate and your MAGI is under $100k (phasing out to $0 by $150k); unused losses carry forward. On sale, claimed depreciation is recaptured at up to 25%, and gains may owe capital-gains tax (a 1031 exchange can defer both). Figures are a year-1 estimate at your 24.0% rate — not tax advice; consult a CPA.
Schools (NCES district)
- District
- Laurens-Marathon Community School District
- NCES district ID
- 1916420
- Math proficiency
- 55% ▼ -10.00%
- Reading proficiency
- 55% ▼ -10.00%
- Median HH income
- $42,146
- Composite
- 48.0/100
- National rank
- #4796
- State rank
- #311 of 330 in IA
Livability — Laurens
- Score
- 74/100
- State rank
- #248
- US rank
- #4769
Category grades
Schools grade is shown separately in the Schools card above.
Census & demographics
- Census place
- Laurens, IA
- City population
- 1,639
- Population (ZIP)
- 554
Population outlook (Pocahontas County) Hauer SSP2
- Today (2025)
- 6,624 people
- By 2030
- 6,482 · -2.1%
- By 2040
- 6,359 · -4.0%
- By 2050
- 6,439 · -2.8%
- By 2075
- 7,397 · +11.7%
- By 2100
- 8,428 · +27.2%
Race, ethnicity, and origin ACS 2023
- Neighborhood character
- Predominantly White (97%)
- Race & ethnicity
- White 97% Two or more races 2% Hispanic / Latino 1%
- Common ancestry
- Portuguese 15% Serbian 3% Iranian 1%
- Foreign-born
- 1%
- Languages at home
- 98% English-only · Other Indo-European 1% Spanish 1%
Political lean MEDSL · Pocahontas
- 2024 margin
- Solid R (+54.0) · D 22.3% · R 76.3% · Other 1.4%
- 2008→2024 swing
- -45.6pp toward R · 2008: -8.4pp · 2024: -54.0pp
- All cycles
- 2024: R+54.0 2020: R+49.5 2016: R+45.2 2012: R+21.8 2008: R+8.4
Not yet ingested
- Civics
- —
Market trends
- HPI YoY
- ▲ 4.15%
- Current HPI
- 153.9517
- Rent YoY
- —
- Metro
- —
- State GDP YoY
- ▲ 2.48%
- F500 in state
- 4
Industry mix (Fortune 500 HQ in IA)
| Industry | F500 HQs | Revenue |
|---|---|---|
| Financial Services | 1 | $16B |
|
||
| Retail / Convenience | 1 | $15B |
|
||
Price history
-8.1% since first listed3 events — show timeline
- 2026-05-07 Listed $153,900 NWIA
- 2026-04-02 Price Changed $153,900 NWIA
- 2025-11-05 Listed $167,500 NWIA
Property tax history
+2.9%/yrLatest (2025): $2,854 · -3.3% YoY. Source: county tax records.
Cash-flow waterfall
monthlySold comps — $/sqft
last 12 mo · ≤1 miLoading sold comps…