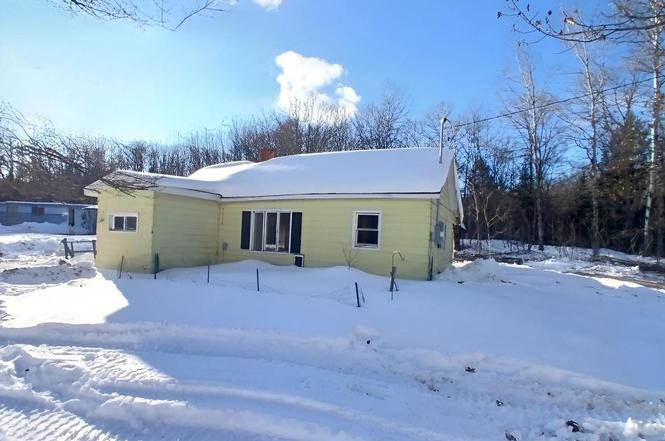
87765 Hwy 13 · Bayfield, WI
Flood risk No data
- FEMA flood zone
- —
- Chance of flooding over 30 yrs
- —
- Est. flood insurance / yr
- —
Fire risk No data
- Est. fire insurance / yr
- —
Heat risk No data
- Hot days now (above threshold)
- —
- Hot days in 30 yrs
- —
Wind risk No data
- Chance of severe wind over 30 yrs
- —
Air-quality risk No data
- Unhealthy air days now
- —
- Unhealthy air days in 30 yrs
- —
Risk factors via First Street. Map © Google.
Why this score? — see what drove the B grade
The composite is a weighted blend of 9 inputs, each scored 0–100. Each bar is that input's sub-score; the figure is the points it added to the 100-point composite (weight × sub-score).
- Cash flow +30.0/30.0
- 1% rule +10.0/10.0
- DSCR +10.0/10.0
- ARV discount +7.5/15.0
- Appreciation +5.8/10.0
- Livability +3.9/5.0
- Rent growth +2.5/5.0
- Condition / age +2.5/5.0
- Schools +2.2/10.0
$44,950
🖨 Deal sheet 📄 Offer letter ✓ Due diligence
Listing remarks MLS
Great location close to Red Cliff and Bayfield with the casino and marina just down the street. Nice treed lot with Brickyard creek running through the property.
Key facts
- Great location
- Treed lot
- Brickyard creek
Tags
Neighborhood map
What this means for you Summary
Snapshot
- This is a 1-bed/1.0-bath other listed at $45k.
Deal economics
- At list price, monthly cash flow is $381 ($5k/yr) — positive.
- The deal already cash-flows at list — no discount required.
- Meets the 1% rule at list price ($874 rent vs $45k).
- Recommended offer: $44k (3.0% below list) — sets the bar for market timing.
Location & tenants
- Location reads 77/100 on livability (#121 in WI, #3,135 nationally) — a middle-class / working-renter tenant base. Strengths: crime A+, cost of living A+, health & safety A+; Watch: schools D+, amenities D+, commute D-.
- Bayfield School District (rural): math 20% / reading 25% proficiency, ranked #407 of 426 in WI (top 96%) — low school quality limits family demand, transient renter base, plan for 1-2y turnover; 70% free/reduced lunch — lower-income household profile, screen leases tightly.
- Market conditions: 65 active listings in the ZIP; 106 units permitted in Bayfield County in 2024 (0 in 5+ unit buildings).
Forward outlook
- In year one you build about $1k of equity ($310 loan paydown + $692 appreciation (1.5% local appreciation)).
- Bayfield County population projected at -13% by 2050 — secular population decline; favor cash flow + early exit over multi-decade hold.
- At projected returns (1.5% appreciation + 3.0% rent growth), your $13k cash investment doubles in ~3 years — after that, you're playing with house money.
Negotiation context
- It's been on market 57 days — a 3% lower offer ($44k) is reasonable based on typical stale-listing flexibility.
- 2 sale attempts; this cycle's ask has dropped $5k (10%) from the opening price — seller is motivated, your offer sets the floor, not the list.
Risks & watch-outs
- Watch-outs: built in 1950 — expect roof / HVAC / electrical / plumbing capex.
Questions for the listing agent
- It's been on market 57 days. Have you received any prior offers? Is the seller open to a 3% concession, seller financing, or rate buy-down credit?
- Built in 1950 — when were the roof, HVAC, electrical panel, plumbing, and water heater last replaced?
- Is there a deadline driving the sale (1031 exchange, divorce, estate, relocation)? That informs how much negotiation room exists.
- Schools are D-rated, which usually means shorter tenancies and higher turnover. Who's the typical renter profile here, and what's been the actual vacancy rate?
- What's the average days-on-market for RENTAL listings here right now (not sales)? A rising rental-DOM trend means longer vacancies and softer asking-rent achievability than the comps imply.
- What's the recent tenant-quality profile in this submarket — average credit score on applications, eviction rate, late-payment / NSF rate, and stable-employment percentage? A property-management company in the area should have these aggregated.
- How much new for-sale + rental construction is in the pipeline within 1–3 miles? Heavy new supply typically softens prices + rents 12–24 months out; constrained supply supports both.
Investment metrics
- 1% rule
- 1.95% ✓
- Cap rate
- 16.45%
- Cash-on-cash
- 36.28%
- DSCR
- 2.61
- GRM
- 4.3
CMA / ARV
No comps found within radius.
Projected returns pro-forma
1.54% appreciation · 3.0% rent growth · sell at horizon
- IRR
- 39.6%
- Equity multiple
- 3.09×
- Total profit
- $26,287
- Equity at exit
- $16,619
- IRR
- 41.1%
- Equity multiple
- 6.09×
- Total profit
- $64,099
- Equity at exit
- $23,107
Cash invested: $12,586 (down + closing). Projections, not guarantees.
Landlord ↔ Tenant lean methodology
- Overall (STATE)
- 73 Landlord-Friendly
- State Wisconsin
- 73 Landlord-Friendly · R+2
- County
- — inherits STATE
- City
- — inherits STATE
ZIP-level market 54814
- Home prices YoY
- 0.9%
- Active inventory
- 65
- Price-to-rent
- 4.3×
Monthly cashflow live
- Estimated rent
- $874 medium interval (Pro) →
- Mortgage (P&I)
- −$236
- Tax from tax record
- −$56 /mo · $670/yr
- Insurance
- −$19
- HOA
- −$0
- Vacancy / Maint / Mgmt
- −$184
- Net cashflow
- $381
Break-even live
UW: 25.0% down · 7.5% · 30yr · 1.5% tax · 5.0% vac · 8.0% maint · 8.0% mgmt
Financing live
Cash to close
- Down payment
- $11,238
- Closing costs
- $1,348
- Reserves months
- —
- Total cash needed
- —
Loan-product check · same deal, 3 products live
Conventional
25% down · 7.5% · 30yr
- Down + closing
- —
- Monthly P&I
- —
- Monthly cashflow
- —
- DSCR
- —
- Eligible?
- —
Personal DTI + credit; lowest rate.
DSCR
20% down · 8.5% · 30yr
- Down + closing
- —
- Monthly P&I
- —
- Monthly cashflow
- —
- DSCR
- —
- Eligible?
- —
No personal income docs; deal must DSCR.
Hard money
10% down · 12.0% · 12mo
- Down + closing
- —
- Monthly P&I
- —
- Monthly cashflow
- —
- DSCR
- —
- Eligible?
- —
Short-term bridge; refi at stabilization.
Listing history 7 events
-
2026-04-22status Pending 161-char remark
Show marketing remark (161 chars)
Great location close to Red Cliff and Bayfield with the casino and marina just down the street. Nice treed lot with Brickyard creek running through the property.
-
2026-04-22status Pending 161-char remark
Show marketing remark (161 chars)
Great location close to Red Cliff and Bayfield with the casino and marina just down the street. Nice treed lot with Brickyard creek running through the property.
-
2026-04-06price $44,950 161-char remark
Show marketing remark (161 chars)
Great location close to Red Cliff and Bayfield with the casino and marina just down the street. Nice treed lot with Brickyard creek running through the property.
-
2026-04-06price $44,950 161-char remark
Show marketing remark (161 chars)
Great location close to Red Cliff and Bayfield with the casino and marina just down the street. Nice treed lot with Brickyard creek running through the property.
-
2026-02-24$49,950 Active 161-char remark
Show marketing remark (161 chars)
Great location close to Red Cliff and Bayfield with the casino and marina just down the street. Nice treed lot with Brickyard creek running through the property.
-
2026-02-24$49,950 Active 161-char remark
Show marketing remark (161 chars)
Great location close to Red Cliff and Bayfield with the casino and marina just down the street. Nice treed lot with Brickyard creek running through the property.
-
2025-08-11soldstatus $81,551
ⓘ Source: listings_history table (triggers on properties + properties_extension) + one-shot
backfill from property_details.listing_events for pre-trigger history.
Tax reassessment forecast WI · Partial reset (capped growth)
- Current annual tax
- $670 · $56/mo
- Projected year-2 tax
- $751 · $63/mo
- Expected delta
- +$81/yr (+$7/mo · 12.1%)
ⓘ Screening estimate from a state-policy table — verify with the county assessor before closing.
Nearby sold comps map
Loading sold comps map…
Walkable amenities ~0.75 mi
Loading nearby amenities…
Taxation est. · year 1
- Rental income
- $10,493
- − Mortgage interest
- −$2,518
- − Property taxes
- −$670
- − Insurance
- −$225
- − Repairs & maintenance
- −$839
- − Management
- −$839
- − Depreciation
- −$1,308
- Taxable income
- $4,094
- Est. tax owed @ 24.0%
- −$983
- After-tax cash flow
- $3,584/yr
For passive investors: Depreciation is non-cash, so a rental often shows a tax loss while cash-flowing — sheltering income. Rental losses are passive: they offset passive income freely, and up to $25,000/yr can offset ordinary (W-2) income if you actively participate and your MAGI is under $100k (phasing out to $0 by $150k); unused losses carry forward. On sale, claimed depreciation is recaptured at up to 25%, and gains may owe capital-gains tax (a 1031 exchange can defer both). Figures are a year-1 estimate at your 24.0% rate — not tax advice; consult a CPA.
Schools (NCES district)
- District
- Bayfield School District
- NCES district ID
- 5500900
- Math proficiency
- 20% ▼ -5.00%
- Reading proficiency
- 25% ▼ -5.00%
- Median HH income
- $41,219
- Composite
- 22.28/100
- National rank
- #13500
- State rank
- #407 of 426 in WI
Livability — Bayfield
- Score
- 77/100
- State rank
- #121
- US rank
- #3135
Category grades
Schools grade is shown separately in the Schools card above.
Census & demographics
- Population (ZIP)
- 2,811
Population outlook (Bayfield County) Hauer SSP2
- Today (2025)
- 14,698 people
- By 2030
- 14,481 · -1.5%
- By 2040
- 13,709 · -6.7%
- By 2050
- 12,777 · -13.1%
- By 2075
- 11,550 · -21.4%
- By 2100
- 9,908 · -32.6%
Race, ethnicity, and origin ACS 2023
- Neighborhood character
- Highly diverse neighborhood (Simpson 0.72)
- Race & ethnicity
- White 53% Native American 35% Two or more races 9% Hispanic / Latino 3% Asian 2%
- Common ancestry
- Portuguese 7% Romanian 4% Italian 2%
- Foreign-born
- 2% · China, Canada
- Languages at home
- 90% English-only · Spanish 1% French/Haitian/Cajun 1% Chinese 1%
Political lean MEDSL · Bayfield
- 2024 margin
- D (+11.1) · D 54.5% · R 43.4% · Other 2.1%
- 2008→2024 swing
- -16.4pp toward R · 2008: 27.5pp · 2024: 11.1pp
- All cycles
- 2024: D+11.1 2020: D+14.1 2016: D+8.7 2012: D+24.9 2008: D+27.5
Not yet ingested
- Civics
- —
Market trends
- HPI YoY
- ▲ 1.54%
- Current HPI
- 181.1481
- Rent YoY
- —
- Metro
- —
- State GDP YoY
- ▲ 2.10%
- F500 in state
- 20
Industry mix (Fortune 500 HQ in WI)
| Industry | F500 HQs | Revenue |
|---|---|---|
| Industrial Machinery | 4 | $23B |
|
||
| Industrial Technology | 2 | $36B |
|
||
| Insurance | 1 | $36B |
|
||
| Professional Services | 1 | $19B |
|
||
| Utilities | 1 | $9B |
|
||
| Consumer Goods | 1 | $3B |
|
||
Price history
-44.9% since first listed7 events — show timeline
- 2026-04-22 Pending — SAAR
- 2026-04-22 Pending — LSAR
- 2026-04-06 Price Changed $44,950 SAAR
- 2026-04-06 Price Changed $44,950 LSAR
- 2026-02-24 Listed $49,950 LSAR
- 2026-02-24 Listed $49,950 SAAR
- 2025-08-11 Sold (Public Records) $81,551 Public Records
Property tax history
+2.5%/yrLatest (2024): $670 · +18.8% YoY. Source: county tax records.
Cash-flow waterfall
monthlySold comps — $/sqft
last 12 mo · ≤1 miLoading sold comps…