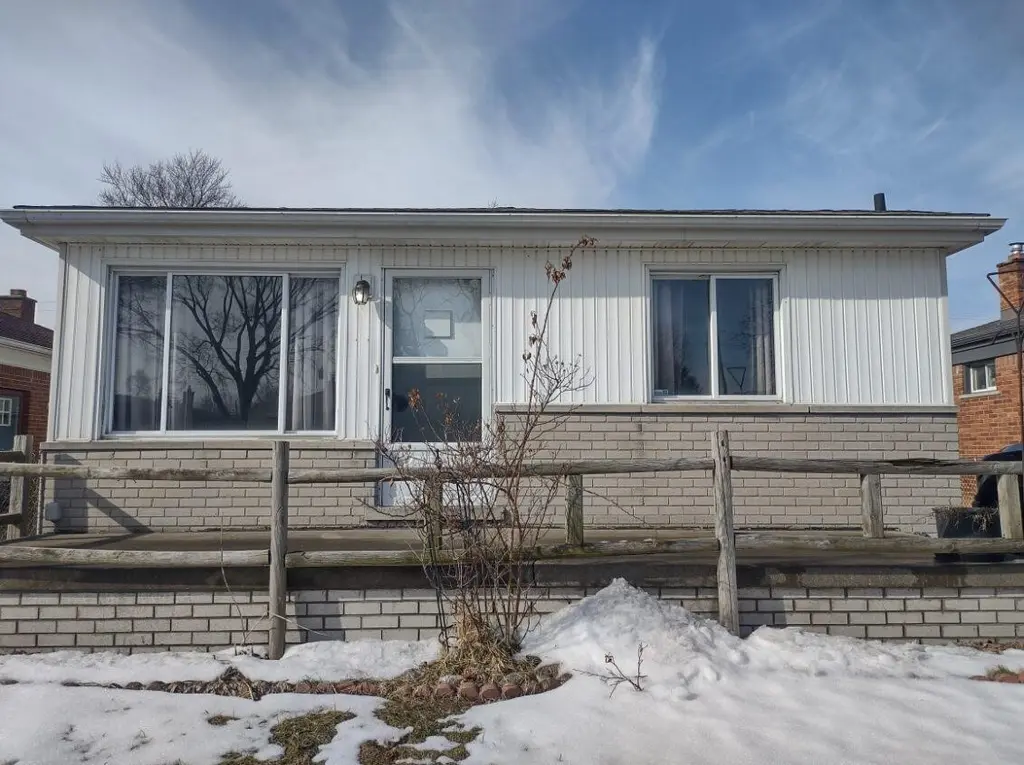
5136 Cornell St · Dearborn Heights, MI
Flood risk 1/10 · Minimal
- FEMA flood zone
- X (unshaded)
- Chance of flooding over 30 yrs
- 0.0%
- Est. flood insurance / yr
- $473 – $860
Fire risk 1/10 · Minimal
- Est. fire insurance / yr
- $784 – $1,456
Heat risk 3/10 · Minor
- Hot days now (above 98°F)
- 7 days/yr
- Hot days in 30 yrs
- 15 days/yr
Wind risk 2/10 · Minimal
- Chance of severe wind over 30 yrs
- —
Air-quality risk 2/10 · Minimal
- Unhealthy air days now
- 1 days/yr
- Unhealthy air days in 30 yrs
- 2 days/yr
Risk factors via First Street. Map © Google.
Why this score? — see what drove the F grade
The composite is a weighted blend of 9 inputs, each scored 0–100. Each bar is that input's sub-score; the figure is the points it added to the 100-point composite (weight × sub-score).
- Cash flow +14.9/30.0
- DSCR +4.6/10.0
- Livability +4.0/5.0
- 1% rule +3.5/10.0
- Rent growth +3.0/5.0
- Condition / age +2.5/5.0
- Schools +1.7/10.0
- ARV discount +0.0/15.0
- Appreciation +0.0/10.0
$189,000
🖨 Deal sheet 📄 Offer letter ✓ Due diligence
Listing remarks MLS
Terrific ranch home in a high-value neighborhood. Nicely situated with easy access to main thoroughfares and freeways. Large Eat-In Kitchen with open floor plan to Living Room. Main bath has jetted tub. Extensive closet space in all bedrooms. Spacious basement has a second full bath with shower, laundry room, carpeting and paneled walls. Newer furnace. 2-Car detached garage and large back yard. Ready for you to move in and make your own!
Key facts
- Open floor plan
- Laundry room
- Large back yard
Tags
Property features AI
Exterior
- Parking: Detached 2-car garage
- Utilities: Public water; Natural gas water heater; Public sewer
- Home design: Ranch-style single family home; One-story; Living area listed as 1672
- Construction: Built in 1957; Aluminum siding and brick exterior; Asphalt roof; Full foundation
- Exterior features: Paved road access; Lot size approximately 0.13 acres
Interior
- Kitchen: Kitchen (approx. 12 x 11); Dishwasher; Disposal
- Bedrooms: Primary bedroom (approx. 12 x 11); Bedroom 2 (approx. 11 x 11); Bedroom 3 (approx. 11 x 10)
- Bathrooms: 3 full bathrooms; Primary bathroom (approx. 8 x 5); Bathroom 2 (approx. 5 x 5)
- Heating & cooling: Forced air heating; Cooling present
- Interior features: 6 total rooms; Full basement
- Laundry & utility: Laundry room (includes bath and furnace) (approx. 15 x 12); Natural gas water heater
Neighborhood map
What this means for you Summary
Snapshot
- This is a 3-bed/1.0-bath single-family listed at $189k.
Deal economics
- At list price, monthly cash flow is $56 ($673/yr) — positive.
- The deal already cash-flows at list — no discount required.
- To meet the 1% rule (rent ≥ 1% of price), the offer needs to be $160k (15.3% below list).
- Recommended offer: $160k (15.3% below list) — sets the bar for 1% rule.
- Cap rate 6.6% vs local median 5.5% in Dearborn Heights — meaningfully above typical; check what's discounted (condition, days-on-market, listing class) to confirm the premium yield is real.
Location & tenants
- Location reads 79/100 on livability (#82 in MI, #1,885 nationally) — a middle-class / working-renter tenant base. Strengths: commute A+, cost of living A+, housing A+; Watch: schools C-, crime D+, employment D+.
- Dearborn Heights School District #7 (suburban): math 13% / reading 26% proficiency, ranked #466 of 540 in MI (top 86%) — low school quality limits family demand, transient renter base, plan for 1-2y turnover; 60% free/reduced lunch — lower-income household profile, screen leases tightly.
- Market conditions: Rents rising (+2.0%/yr); 137 active listings in the ZIP; 20 comparable units currently listed for rent nearby; rentals leasing fast (median 12d on market — plan ~1-2 weeks tenant-placement turnaround); 2,639 units permitted in Wayne County in 2024 (1,216 in 5+ unit buildings).
- This rent runs 32% of the median local income ($60k/yr) — at the standard rent-burdened threshold; future hikes will face affordability resistance.
Forward outlook
- Local home prices are declining (-3.0%/yr); year-one equity from $1k of loan paydown is wiped out by about $6k of value loss. Plan a longer hold.
- Wayne County population projected at -17% by 2050 — secular population decline; favor cash flow + early exit over multi-decade hold.
Negotiation context
- It's been on market 43 days — a 3% lower offer ($183k) is reasonable based on typical stale-listing flexibility.
- 3 sale attempts with the ask held roughly flat each time — persistent listings suggest the price (not the market) is what's stuck; bring a comps-based counter.
Risks & watch-outs
- Watch-outs: built in 1957 — expect roof / HVAC / electrical / plumbing capex.
Questions for the listing agent
- It's been on market 43 days. Have you received any prior offers? Is the seller open to a 15% concession, seller financing, or rate buy-down credit?
- Built in 1957 — when were the roof, HVAC, electrical panel, plumbing, and water heater last replaced?
- Is there a deadline driving the sale (1031 exchange, divorce, estate, relocation)? That informs how much negotiation room exists.
- Crime grade is D in this area — have there been break-ins, vandalism, or insurance claims at this property in the last 3 years? What carrier currently insures it and at what premium?
- The area grade is low — what's the realistic commute time and amenity access for the typical tenant pool here? Any planned neighborhood developments (good or bad) we should know about?
- What's the average days-on-market for RENTAL listings here right now (not sales)? A rising rental-DOM trend means longer vacancies and softer asking-rent achievability than the comps imply.
- What's the recent tenant-quality profile in this submarket — average credit score on applications, eviction rate, late-payment / NSF rate, and stable-employment percentage? A property-management company in the area should have these aggregated.
- How much new for-sale + rental construction is in the pipeline within 1–3 miles? Heavy new supply typically softens prices + rents 12–24 months out; constrained supply supports both.
Investment metrics
- 1% rule
- 0.85% ✗
- Cap rate
- 6.65%
- Cash-on-cash
- 1.27%
- DSCR
- 1.06
- GRM
- 9.8
CMA / ARV
- ARV (on-the-fly)
- $160,950
- Comps found
- 12
Show comp detail 12 sales within ~0.75 mi
| Address | Dist | Beds/Ba | Sqft | Sold | Price | $/sf | Match |
|---|---|---|---|---|---|---|---|
| 5952 Banner St | 0.49mi | 3/1.0 | 949 (+3%) | 0mo | $144,000 | $152 | 72 |
| 4901 Cornell St | 0.09mi | 2/1.0 (-1) | 819 (-12%) | 3mo | $92,150 | $113 | 70 |
| 24337 Pennie St | 0.31mi | 3/1.0 | 1,008 (+9%) | 2mo | $168,000 | $167 | 69 |
| 24426 Lehigh St | 0.54mi | 4/1.0 (+1) | 922 (-0%) | 1mo | $165,000 | $179 | 69 |
| 23245 Annapolis St | 0.38mi | 2/1.0 (-1) | 870 (-6%) | 0mo | $150,000 | $172 | 67 |
| 4140 Syracuse St | 0.43mi | 3/1.0 | 860 (-7%) | 2mo | $150,000 | $174 | 67 |
| 4165 Westpoint St | 0.40mi | 3/1.0 | 847 (-8%) | 1mo | $170,000 | $201 | 66 |
| 23300 N Brookside Dr | 0.33mi | 3/1.0 | 1,026 (+11%) | 0mo | $155,000 | $151 | 66 |
| 4145 Parker St | 0.57mi | 3/1.0 | 976 (+6%) | 1mo | $195,000 | $200 | 63 |
| 24301 Stanford St | 0.48mi | 2/1.0 (-1) | 824 (-11%) | 2mo | $155,000 | $188 | 53 |
| 25038 Annapolis St | 0.71mi | 2/1.0 (-1) | 841 (-9%) | 1mo | $125,000 | $149 | 46 |
| 25037 Hopkins St | 0.72mi | 2/1.0 (-1) | 812 (-12%) | 2mo | $159,900 | $197 | 39 |
Match score weights: distance 35% · size 25% · config 20% · recency 20%. Top-matched comps best support the ARV.
Projected returns pro-forma
-3.0% appreciation · 2.03% rent growth · sell at horizon
- IRR
- -15.3%
- Equity multiple
- 0.46×
- Total profit
- $-28,636
- Equity at exit
- $28,181
- IRR
- -8.4%
- Equity multiple
- 0.50×
- Total profit
- $-26,707
- Equity at exit
- $16,341
Cash invested: $52,920 (down + closing). Projections, not guarantees.
Landlord ↔ Tenant lean methodology
- Overall (STATE)
- 62 Landlord-Friendly
- State Michigan
- 62 Landlord-Friendly · EVEN
- County
- — inherits STATE
- City
- — inherits STATE
ZIP-level market 48125
- Rents YoY
- 2.0%
- Active inventory
- 137
- Price-to-rent
- 9.8×
Monthly cashflow live
- Estimated rent
- $1,601 high interval (Pro) →
- Mortgage (P&I)
- −$991
- Tax from tax record
- −$139 /mo · $1,665/yr
- Insurance
- −$79
- HOA
- −$0
- Vacancy / Maint / Mgmt
- −$336
- Net cashflow
- $56
Break-even live
UW: 25.0% down · 7.5% · 30yr · 1.5% tax · 5.0% vac · 8.0% maint · 8.0% mgmt
Financing live
Cash to close
- Down payment
- $47,250
- Closing costs
- $5,670
- Reserves months
- —
- Total cash needed
- —
Loan-product check · same deal, 3 products live
Conventional
25% down · 7.5% · 30yr
- Down + closing
- —
- Monthly P&I
- —
- Monthly cashflow
- —
- DSCR
- —
- Eligible?
- —
Personal DTI + credit; lowest rate.
DSCR
20% down · 8.5% · 30yr
- Down + closing
- —
- Monthly P&I
- —
- Monthly cashflow
- —
- DSCR
- —
- Eligible?
- —
No personal income docs; deal must DSCR.
Hard money
10% down · 12.0% · 12mo
- Down + closing
- —
- Monthly P&I
- —
- Monthly cashflow
- —
- DSCR
- —
- Eligible?
- —
Short-term bridge; refi at stabilization.
Rent comps 20 comps
| Address | Beds | Baths | Sqft | Rent | $/sqft | DOM | Units | Dist |
|---|---|---|---|---|---|---|---|---|
| 4481 Westpoint St Dearborn Heights, MI | 3.0 | 2.0 | 768 | $1,549 | $2.02 | 14d | 1 | 0.28mi |
| 24684 Lehigh St Dearborn Heights, MI | 4.0 | 1.0 | 878 | $1,600 | $1.82 | 12d | 1 | 0.63mi |
| 24154 Dartmouth St Dearborn, MI | 2.0 | 1.0 | 950 | $1,275 | $1.34 | 14d | 1 | 0.67mi |
| 24601 Andover Dr Dearborn Heights, MI | 3.0 | 1.5 | 1092 | $1,700 | $1.56 | 1d | 1 | 0.69mi |
| 25016 Lehigh St Dearborn Heights, MI | 2.0 | 1.0 | 1000 | $1,400 | $1.40 | 4d | 1 | 0.74mi |
| 4934 McKinley St Dearborn Heights, MI | 3.0 | 1.0 | 1051 | $1,700 | $1.62 | 1d | 1 | 0.75mi |
| 5845 Michael St Taylor, MI | 2.0 | 1.0 | 618 | $1,325 | $2.14 | 4d | 1 | 0.86mi |
| 24442 Union St Dearborn, MI | 3.0 | 1.5 | 1000 | $1,900 | $1.90 | 1d | 1 | 0.89mi |
| 3809 Heritage Pkwy Dearborn, MI | 2.0 | 1.5 | 1035 | $1,400 | $1.35 | 43d | 1 | 0.99mi |
| 4757 Dudley St Dearborn Heights, MI | 3.0 | 1.0 | 995 | $1,350 | $1.36 | 10d | 1 | 1.03mi |
| 3755 Heritage Pkwy Dearborn, MI | 2.0 | 1.0 | 830 | $1,450 | $1.75 | 43d | 1 | 1.04mi |
| 3763 Heritage Pkwy Dearborn, MI | 2.0 | 1.5 | 1035 | $1,450 | $1.40 | 43d | 1 | 1.06mi |
| 3620 Monroe St Dearborn, MI | 3.0 | 2.0 | 1100 | $1,800 | $1.64 | 10d | 1 | 1.17mi |
| 4810 Campbell St Dearborn Heights, MI | 3.0 | 1.0 | 1000 | $1,700 | $1.70 | 1d | 1 | 1.18mi |
| 4914 Gertrude St Dearborn Heights, MI | 2.0 | 1.0 | 908 | $1,230 | $1.35 | 17d | 1 | 1.23mi |
| 4638 Gertrude St Dearborn Heights, MI | 3.0 | 1.0 | 1020 | $1,700 | $1.67 | 5d | 1 | 1.25mi |
| 25722 Carlysle St Dearborn Heights, MI | 3.0 | 1.0 | 1040 | $1,450 | $1.39 | 17d | 1 | 1.30mi |
| 2825 Queen St Dearborn, MI | 2.0 | 1.0 | 1000 | $1,299 | $1.30 | 43d | 1 | 1.32mi |
| 26089 Lehigh St Inkster, MI | 2.0 | 1.0 | 900 | $1,295 | $1.44 | 17d | 1 | 1.32mi |
| 26159 Stanford St Inkster, MI | 4.0 | 1.0 | 1056 | $1,350 | $1.28 | 5d | 1 | 1.42mi |
Listing history 6 events
-
2026-05-07status Pending 441-char remark
Show marketing remark (441 chars)
Terrific ranch home in a high-value neighborhood. Nicely situated with easy access to main thoroughfares and freeways. Large Eat-In Kitchen with open floor plan to Living Room. Main bath has jetted tub. Extensive closet space in all bedrooms. Spacious basement has a second full bath with shower, laundry room, carpeting and paneled walls. Newer furnace. 2-Car detached garage and large back yard. Ready for you to move in and make your own!
-
2026-05-07status Pending
Show marketing remark (441 chars)
Terrific ranch home in a high-value neighborhood. Nicely situated with easy access to main thoroughfares and freeways. Large Eat-In Kitchen with open floor plan to Living Room. Main bath has jetted tub. Extensive closet space in all bedrooms. Spacious basement has a second full bath with shower, laundry room, carpeting and paneled walls. Newer furnace. 2-Car detached garage and large back yard. Ready for you to move in and make your own!
-
2026-03-25$189,000 Active 441-char remark
Show marketing remark (441 chars)
Terrific ranch home in a high-value neighborhood. Nicely situated with easy access to main thoroughfares and freeways. Large Eat-In Kitchen with open floor plan to Living Room. Main bath has jetted tub. Extensive closet space in all bedrooms. Spacious basement has a second full bath with shower, laundry room, carpeting and paneled walls. Newer furnace. 2-Car detached garage and large back yard. Ready for you to move in and make your own!
-
2026-03-25$189,000 Active
Show marketing remark (441 chars)
Terrific ranch home in a high-value neighborhood. Nicely situated with easy access to main thoroughfares and freeways. Large Eat-In Kitchen with open floor plan to Living Room. Main bath has jetted tub. Extensive closet space in all bedrooms. Spacious basement has a second full bath with shower, laundry room, carpeting and paneled walls. Newer furnace. 2-Car detached garage and large back yard. Ready for you to move in and make your own!
ⓘ Source: listings_history table (triggers on properties + properties_extension) + one-shot
backfill from property_details.listing_events for pre-trigger history.
Tax reassessment forecast MI · Partial reset (capped growth)
- Current annual tax
- $1,665 · $139/mo
- Projected year-2 tax
- $2,288 · $191/mo
- Expected delta
- +$623/yr (+$52/mo · 37.4%)
ⓘ Screening estimate from a state-policy table — verify with the county assessor before closing.
Climate risk First Street
- Flood 1/10 Low FEMA zone X (unshaded) · 0% chance over 30 yrs
- Wildfire 1/10 Low
- Heat 3/10 Moderate 7 d/yr ≥98°F today · 15 d/yr by 30 yrs out
- Wind 2/10 Low
- Air quality 2/10 Low 1 unhealthy d/yr today · 2 by 30 yrs out
Nearby sold comps map
Loading sold comps map…
Walkable amenities ~0.75 mi
Loading nearby amenities…
Taxation est. · year 1
- Rental income
- $19,211
- − Mortgage interest
- −$10,587
- − Property taxes
- −$1,665
- − Insurance
- −$945
- − Repairs & maintenance
- −$1,537
- − Management
- −$1,537
- − Depreciation
- −$5,498
- Taxable loss
- −$2,558
- Est. tax savings @ 24.0%
- +$614
- After-tax cash flow
- $1,287/yr
For passive investors: Depreciation is non-cash, so a rental often shows a tax loss while cash-flowing — sheltering income. Rental losses are passive: they offset passive income freely, and up to $25,000/yr can offset ordinary (W-2) income if you actively participate and your MAGI is under $100k (phasing out to $0 by $150k); unused losses carry forward. On sale, claimed depreciation is recaptured at up to 25%, and gains may owe capital-gains tax (a 1031 exchange can defer both). Figures are a year-1 estimate at your 24.0% rate — not tax advice; consult a CPA.
Schools (NCES district)
- District
- Dearborn Heights School District #7
- NCES district ID
- 2611610
- Math proficiency
- 13% ▼ -10.00%
- Reading proficiency
- 26% ▼ -7.00%
- Median HH income
- $47,468
- Composite
- 17.21/100
- National rank
- #9101
- State rank
- #466 of 540 in MI
Livability — Dearborn Heights
- Score
- 79/100
- State rank
- #82
- US rank
- #1885
Category grades
Schools grade is shown separately in the Schools card above.
Census & demographics
- Census place
- Dearborn Heights, MI
- County
- Wayne County · 1,562,939 people
- City population
- 61,771
- Metro
- Detroit-Warren-Dearborn, MI
- Population (ZIP)
- 22,125
- Household income
- $60,195
- Rent vs Own
- Severe rent burden
- 654.0
Population outlook (Wayne County) Hauer SSP2
- Today (2025)
- 1,675,273 people
- By 2030
- 1,620,300 · -3.3%
- By 2040
- 1,502,341 · -10.3%
- By 2050
- 1,384,039 · -17.4%
- By 2075
- 1,124,592 · -32.9%
- By 2100
- 881,193 · -47.4%
Race, ethnicity, and origin ACS 2023
- Neighborhood character
- Predominantly White (76%)
- Race & ethnicity
- White 76% Black 10% Two or more races 9% Hispanic / Latino 9%
- Hispanic origin (detail)
- Mexican 6%
- Common ancestry
- Romanian 11% Arab 3% Slovak 2%
- Foreign-born
- 11% · Canada
- Languages at home
- 82% English-only · Arabic 13% Spanish 3% Russian/Polish/Slavic 1%
Political lean MEDSL · Wayne
- 2024 margin
- Strong D (+29.0) · D 62.7% · R 33.7% · Other 3.6%
- 2008→2024 swing
- -20.5pp toward R · 2008: 49.5pp · 2024: 29.0pp
- All cycles
- 2024: D+29.0 2020: D+38.1 2016: D+37.3 2012: D+46.9 2008: D+49.5
Not yet ingested
- Civics
- —
Market trends
- HPI YoY
- ▼ -214.70%
- Current HPI
- 218.4698
- Rent YoY
- ▲ 2.03%
- Metro
- Detroit-Warren-Dearborn, MI
- State GDP YoY
- ▲ 1.37%
- F500 in state
- 28
Industry mix (Fortune 500 HQ in MI)
| Industry | F500 HQs | Revenue |
|---|---|---|
| Automotive Parts | 3 | $48B |
|
||
| Automotive | 2 | $372B |
|
||
| Chemicals | 1 | $45B |
|
||
| Automotive Retail | 1 | $29B |
|
||
| Healthcare / Medical Devices | 1 | $23B |
|
||
| Automotive Technology | 1 | $20B |
|
||
Price history
+0.0% since first listed6 events — show timeline
- 2026-05-07 Pending — REALCOMP
- 2026-05-07 Pending — MiRealSource-MiMLS
- 2026-05-07 Pending — SW Michigan MLS
- 2026-03-25 Listed $189,000 SW Michigan MLS
- 2026-03-25 Listed $189,000 MiRealSource-MiMLS
- 2026-03-25 Listed $189,000 REALCOMP
Property tax history
-1.4%/yrLatest (2025): $1,665 · -32.4% YoY. Source: county tax records.
Cash-flow waterfall
monthlySold comps — $/sqft
last 12 mo · ≤1 miLoading sold comps…