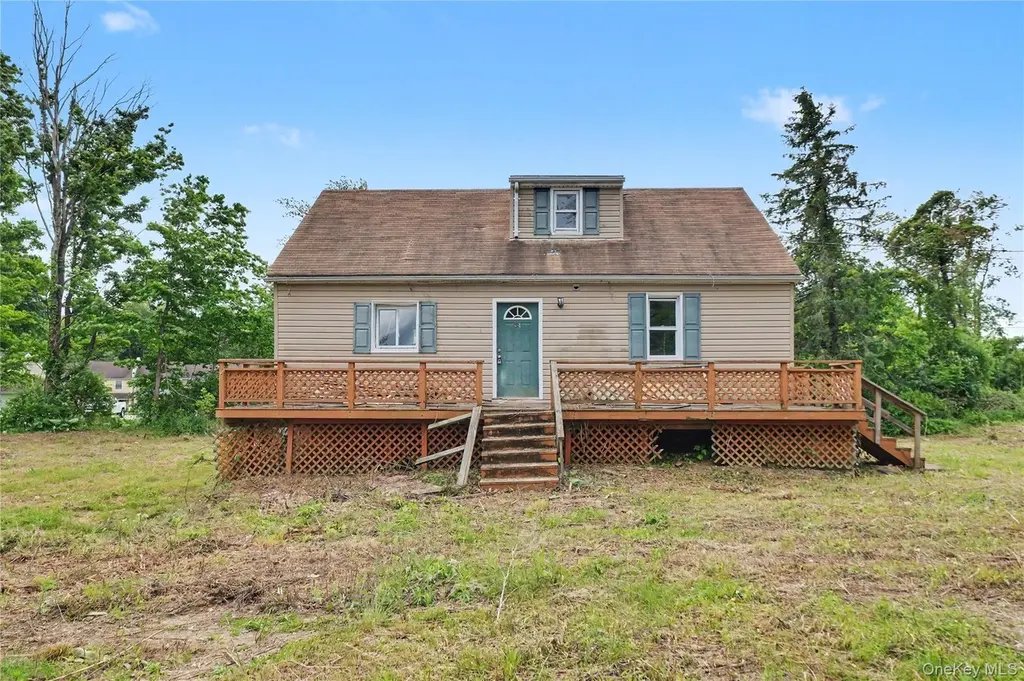
687 Whitley Ln · Clintondale, NY
Flood risk 1/10 · Minimal
- FEMA flood zone
- X (unshaded)
- Chance of flooding over 30 yrs
- 0.0%
- Est. flood insurance / yr
- $473 – $860
Fire risk 3/10 · Minor
- Est. fire insurance / yr
- $691 – $1,283
Heat risk 4/10 · Minor
- Hot days now (above 98°F)
- 7 days/yr
- Hot days in 30 yrs
- 16 days/yr
Wind risk 4/10 · Minor
- Chance of severe wind over 30 yrs
- 10.0%
Air-quality risk 2/10 · Minimal
- Unhealthy air days now
- 1 days/yr
- Unhealthy air days in 30 yrs
- 2 days/yr
Risk factors via First Street. Map © Google.
Why this score? — see what drove the C+ grade
The composite is a weighted blend of 9 inputs, each scored 0–100. Each bar is that input's sub-score; the figure is the points it added to the 100-point composite (weight × sub-score).
- Cash flow +26.5/30.0
- DSCR +9.0/10.0
- ARV discount +7.5/15.0
- 1% rule +7.1/10.0
- Schools +5.2/10.0
- Livability +3.2/5.0
- Rent growth +2.5/5.0
- Condition / age +2.5/5.0
- Appreciation +0.0/10.0
$179,000
🖨 Deal sheet 📄 Offer letter ✓ Due diligence
Listing remarks
Investor opportunity in the Town of Lloyd! Situated on 1.4 private acres, this 4-bedroom home offers tremendous potential for renovation, customization, or resale. The property is in need of significant rehabilitation and is ready for its next owner to bring it back to life. Features include a full basement, attached garage, and a desirable location just minutes from New Paltz, the Mid-Hudson Bridge, shopping, dining, and major commuter routes. Whether you’re an investor, contractor, or buyer looking to create your dream home, this property presents a rare chance to add value and build equity. Sold as-is.
Key facts
- Private acres
- Attached garage
- Full basement
Tags
Property features AI
Finance
- Other: Tax year reported (tax amount available in listing but excluded per instructions)
Exterior
- Parking: Driveway; 1-car garage (has garage)
- Security: No security features listed
- Utilities: Sewer: Other; Utilities: See remarks
- Home design: Single-family residence; Living area reported from public records
- Construction: Block and vinyl siding construction; Unfinished basement; Walkup attic
- Exterior features: Not waterfront; Construction includes block and vinyl siding
Interior
- Kitchen: No appliances listed
- Bedrooms: 6 total rooms (bedroom count not specified)
- Flooring: No flooring information provided
- Bathrooms: 1 full bathroom; 1 half bathroom
- Heating & cooling: No heating system specified (listed as None/Other); No cooling system
- Interior features: Unspecified additional interior features
- Laundry & utility: No laundry appliances listed
Neighborhood map
What this means for you Summary
Snapshot
- This is a 2-bed/1.0-bath single-family listed at $179k.
Deal economics
- At list price, monthly cash flow is $473 ($6k/yr) — positive.
- The deal already cash-flows at list — no discount required.
- Meets the 1% rule at list price ($2k rent vs $179k).
- Recommended offer: $176k (1.5% below list) — sets the bar for market timing.
- Cap rate 9.5% vs local median 2.9% in Clintondale — top-decile yield for the area; either an underpriced asset or a hidden risk that comps aren't pricing in. Stress-test before assuming the spread holds.
Location & tenants
- Location reads 64/100 on livability (#732 in NY) — a middle-class / working-renter tenant base. Strengths: crime A+, employment B+, housing B; Watch: cost of living D, amenities F, commute F.
- Highland Central School District (suburban): math 50% / reading 69% proficiency, ranked #227 of 590 in NY (top 38%) — acceptable for families but not a draw, mixed tenant base, ~2y average lease.
- Zoned schools: Highland Elementary School (math 46% / reading 67%, grade C+, #899 of 2,108 statewide, top 43%, 638 students, 38% FRL); Highland Middle School (math 27% / reading 57%, grade D-, #379 of 729 statewide, top 54%, 376 students, 42% FRL); Highland High School (math 87% / reading 92%, grade A+, #265 of 1,100 statewide, top 26%, 512 students, 41% FRL).
- Market conditions: 107 active listings in the ZIP; 464 units permitted in Ulster County in 2024 (170 in 5+ unit buildings).
Forward outlook
- Local home prices are declining (-3.0%/yr); year-one equity from $1k of loan paydown is wiped out by about $5k of value loss. Plan a longer hold.
- Ulster County population projected at -14% by 2050 — secular population decline; favor cash flow + early exit over multi-decade hold.
- At projected returns (-3.0% appreciation + 3.0% rent growth), your $50k cash investment doubles in ~10 years — after that, you're playing with house money.
Negotiation context
- It's been on market 17 days — a 2% lower offer ($176k) is reasonable based on typical stale-listing flexibility.
- 5 sale attempts since 8y ago with the ask held roughly flat each time — persistent listings suggest the price (not the market) is what's stuck; bring a comps-based counter.
- Current owner paid $118k; list at $179k implies a 52% gain — meaningful room to come down on a strong offer.
Questions for the listing agent
- Built in 1960 — when were the roof, HVAC, electrical panel, plumbing, and water heater last replaced?
- Is there a deadline driving the sale (1031 exchange, divorce, estate, relocation)? That informs how much negotiation room exists.
- Schools are D-rated, which usually means shorter tenancies and higher turnover. Who's the typical renter profile here, and what's been the actual vacancy rate?
- What's the average days-on-market for RENTAL listings here right now (not sales)? A rising rental-DOM trend means longer vacancies and softer asking-rent achievability than the comps imply.
- What's the recent tenant-quality profile in this submarket — average credit score on applications, eviction rate, late-payment / NSF rate, and stable-employment percentage? A property-management company in the area should have these aggregated.
- How much new for-sale + rental construction is in the pipeline within 1–3 miles? Heavy new supply typically softens prices + rents 12–24 months out; constrained supply supports both.
Investment metrics
- 1% rule
- 1.21% ✓
- Cap rate
- 9.46%
- Cash-on-cash
- 11.31%
- DSCR
- 1.50
- GRM
- 6.9
CMA / ARV
- ARV (on-the-fly)
- $379,080
- Comps found
- 3
Show comp detail 3 sales within ~0.75 mi
| Address | Dist | Beds/Ba | Sqft | Sold | Price | $/sf | Match |
|---|---|---|---|---|---|---|---|
| 6 Orchard Ln | 0.38mi | 3/1.0 (+1) | 1,394 (-1%) | 16mo | $332,000 | $238 | 62 |
| 616 N Elting Corners Rd | 0.51mi | 3/1.0 (+1) | 1,556 (+11%) | 1mo | $420,000 | $270 | 53 |
| 7 Dirks Ter | 0.27mi | 3/2.5 (+1) | 1,608 (+14%) | 12mo | $435,000 | $271 | 42 |
Match score weights: distance 35% · size 25% · config 20% · recency 20%. Top-matched comps best support the ARV.
Projected returns pro-forma
-3.0% appreciation · 3.0% rent growth · sell at horizon
- IRR
- 0.6%
- Equity multiple
- 1.02×
- Total profit
- $1,125
- Equity at exit
- $26,689
- IRR
- 10.2%
- Equity multiple
- 1.80×
- Total profit
- $39,868
- Equity at exit
- $15,477
Cash invested: $50,120 (down + closing). Projections, not guarantees.
Landlord ↔ Tenant lean methodology
- Overall (STATE)
- 15 Strongly Tenant-Friendly
- State New York
- 15 Strongly Tenant-Friendly · D+10
- County
- — inherits STATE
- City
- — inherits STATE
ZIP-level market 12528
- Home prices YoY
- -20.5%
- Active inventory
- 107
- Price-to-rent
- 6.9×
Monthly cashflow live
- Estimated rent
- $2,164 medium interval (Pro) →
- Mortgage (P&I)
- −$939
- Tax est. 1.5%
- −$224 /mo · $2,685/yr
- Insurance
- −$75
- HOA
- −$0
- Vacancy / Maint / Mgmt
- −$454
- Net cashflow
- $473
Break-even live
UW: 25.0% down · 7.5% · 30yr · 1.5% tax · 5.0% vac · 8.0% maint · 8.0% mgmt
Financing live
Cash to close
- Down payment
- $44,750
- Closing costs
- $5,370
- Reserves months
- —
- Total cash needed
- —
Loan-product check · same deal, 3 products live
Conventional
25% down · 7.5% · 30yr
- Down + closing
- —
- Monthly P&I
- —
- Monthly cashflow
- —
- DSCR
- —
- Eligible?
- —
Personal DTI + credit; lowest rate.
DSCR
20% down · 8.5% · 30yr
- Down + closing
- —
- Monthly P&I
- —
- Monthly cashflow
- —
- DSCR
- —
- Eligible?
- —
No personal income docs; deal must DSCR.
Hard money
10% down · 12.0% · 12mo
- Down + closing
- —
- Monthly P&I
- —
- Monthly cashflow
- —
- DSCR
- —
- Eligible?
- —
Short-term bridge; refi at stabilization.
Listing history 13 events
-
2026-06-18days on market $179,000 Active 17 DOM
-
2026-06-17days on market $179,000 Active 16 DOM
-
2026-06-16days on market $179,000 Active 15 DOM
-
2026-06-15days on market $179,000 Active 14 DOM
-
2026-06-13days on market $179,000 Active 12 DOM
-
2026-06-12days on market $179,000 Active 11 DOM
-
2026-06-09days on market $179,000 Active 8 DOM
-
2026-06-08days on market $179,000 Active 7 DOM
-
2026-06-07days on market $179,000 Active 6 DOM
-
2026-06-05days on market $179,000 Active 4 DOM
-
2026-06-04days on market $179,000 Active 2 DOM
-
2026-06-01remarks 612-char remark
-
2026-06-01$179,000 Active 1 DOM
ⓘ Source: listings_history table (triggers on properties + properties_extension) + one-shot
backfill from property_details.listing_events for pre-trigger history.
Climate risk First Street
- Flood 1/10 Low FEMA zone X (unshaded) · 0% chance over 30 yrs
- Wildfire 3/10 Moderate
- Heat 4/10 Moderate 7 d/yr ≥98°F today · 16 d/yr by 30 yrs out
- Wind 4/10 Moderate 10% chance of damaging wind over 30 yrs
- Air quality 2/10 Low 1 unhealthy d/yr today · 2 by 30 yrs out
Nearby sold comps map
Loading sold comps map…
Walkable amenities ~0.75 mi
Loading nearby amenities…
Taxation est. · year 1
- Rental income
- $25,968
- − Mortgage interest
- −$10,027
- − Property taxes
- −$2,685
- − Insurance
- −$895
- − Repairs & maintenance
- −$2,077
- − Management
- −$2,077
- − Depreciation
- −$5,207
- Taxable income
- $2,999
- Est. tax owed @ 24.0%
- −$720
- After-tax cash flow
- $4,951/yr
For passive investors: Depreciation is non-cash, so a rental often shows a tax loss while cash-flowing — sheltering income. Rental losses are passive: they offset passive income freely, and up to $25,000/yr can offset ordinary (W-2) income if you actively participate and your MAGI is under $100k (phasing out to $0 by $150k); unused losses carry forward. On sale, claimed depreciation is recaptured at up to 25%, and gains may owe capital-gains tax (a 1031 exchange can defer both). Figures are a year-1 estimate at your 24.0% rate — not tax advice; consult a CPA.
Schools (NCES district)
- District
- Highland Central School District
- NCES district ID
- 3614400
- Math proficiency
- 50% ▼ -3.00%
- Reading proficiency
- 69% ▲ 14.00%
- Median HH income
- $63,600
- Composite
- 51.89/100
- National rank
- #1652
- State rank
- #227 of 590 in NY
Livability — Clintondale
- Score
- 64/100
- State rank
- #732
- US rank
- #13975
Category grades
Schools grade is shown separately in the Schools card above.
Census & demographics
- Population (ZIP)
- 13,818
Population outlook (Ulster County) Hauer SSP2
- Today (2025)
- 175,887 people
- By 2030
- 171,876 · -2.3%
- By 2040
- 161,771 · -8.0%
- By 2050
- 151,470 · -13.9%
- By 2075
- 133,023 · -24.4%
- By 2100
- 113,504 · -35.5%
Race, ethnicity, and origin ACS 2023
- Neighborhood character
- Predominantly White (72%)
- Race & ethnicity
- White 72% Hispanic / Latino 10% Two or more races 9% Asian 7% Black 3%
- Hispanic origin (detail)
- Mexican 4% Puerto Rican 2% Cuban 1% Dominican 1%
- Common ancestry
- Romanian 4% Scotch-Irish 2% Slovak 2%
- Foreign-born
- 11% · Canada, Vietnam, China
- Languages at home
- 81% English-only · Spanish 9% Vietnamese 6% Other Indo-European 2%
Political lean MEDSL · Ulster
- 2024 margin
- D (+18.7) · D 59.3% · R 40.7%
- 2008→2024 swing
- -4.9pp toward R · 2008: 23.6pp · 2024: 18.7pp
- All cycles
- 2024: D+18.7 2020: D+20.9 2016: D+9.1 2012: D+21.9 2008: D+23.6
Not yet ingested
- Civics
- —
Market trends
- HPI YoY
- ▼ -84.26%
- Current HPI
- 327.3196
- Rent YoY
- —
- Metro
- —
- State GDP YoY
- ▲ 2.60%
- F500 in state
- 92
Industry mix (Fortune 500 HQ in NY)
| Industry | F500 HQs | Revenue |
|---|---|---|
| Financial Services | 10 | $950B |
|
||
| Consumer Goods | 9 | $162B |
|
||
| Insurance | 4 | $225B |
|
||
| Telecommunications | 2 | $144B |
|
||
| Pharmaceuticals | 2 | $112B |
|
||
| Media / Entertainment | 2 | $69B |
|
||
Price history
+27.9% since first listed8 events — show timeline
- 2026-05-26 Listed $179,000 OneKey® MLS as Distributed by MLS Grid
- 2019-04-17 Listing Removed — OneKey® MLS as Distributed by MLS Grid
- 2018-12-06 Sold (Public Records) $118,000 Public Records
- 2018-11-28 Sold (MLS) $118,000 OneKey® MLS as Distributed by MLS Grid
- 2018-08-23 Listed $139,000 OneKey® MLS as Distributed by MLS Grid
- 2018-08-23 Listed $139,000 OneKey® MLS as Distributed by MLS Grid
- 2018-08-23 Listed $139,000 HVCRMLS
- 2018-04-28 Listed $140,000 OneKey® MLS as Distributed by MLS Grid
Property tax history
+1.4%/yrLatest (2025): $9,071 · +3.8% YoY. Source: county tax records.
Cash-flow waterfall
monthlySold comps — $/sqft
last 12 mo · ≤1 miLoading sold comps…