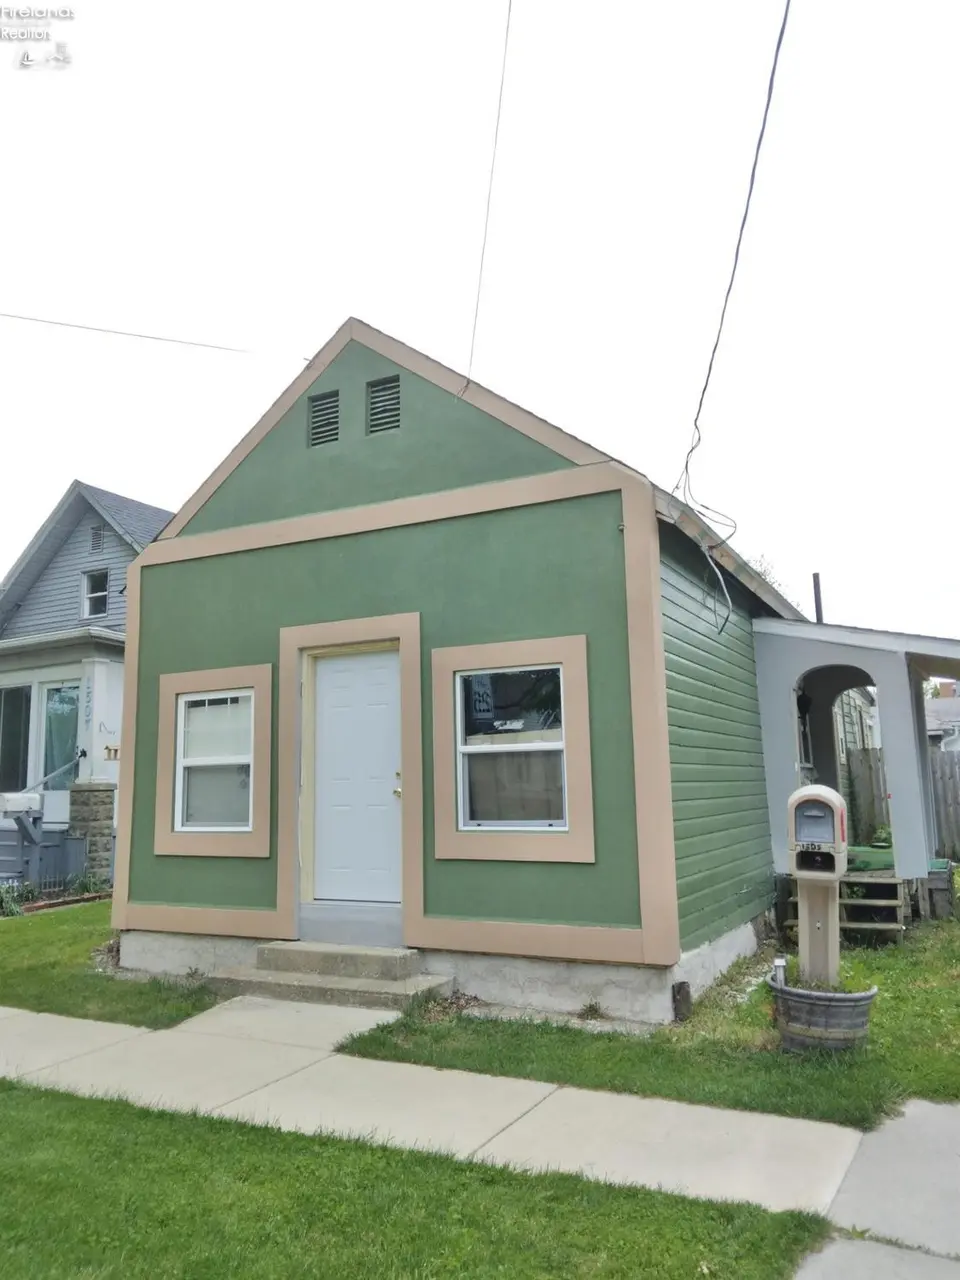
1505 Campbell St · Sandusky, OH
Flood risk No data
- FEMA flood zone
- —
- Chance of flooding over 30 yrs
- —
- Est. flood insurance / yr
- —
Fire risk No data
- Est. fire insurance / yr
- —
Heat risk No data
- Hot days now (above threshold)
- —
- Hot days in 30 yrs
- —
Wind risk No data
- Chance of severe wind over 30 yrs
- —
Air-quality risk No data
- Unhealthy air days now
- —
- Unhealthy air days in 30 yrs
- —
Risk factors via First Street. Map © Google.
Why this score? — see what drove the B+ grade
The composite is a weighted blend of 9 inputs, each scored 0–100. Each bar is that input's sub-score; the figure is the points it added to the 100-point composite (weight × sub-score).
- Cash flow +30.0/30.0
- ARV discount +15.0/15.0
- 1% rule +10.0/10.0
- DSCR +10.0/10.0
- Livability +4.2/5.0
- Rent growth +2.5/5.0
- Schools +2.5/10.0
- Condition / age +2.0/5.0
- Appreciation +0.0/10.0
$49,900
🖨 Deal sheet 📄 Offer letter ✓ Due diligence
Listing remarks
Originally a historic retail store, this home has been cleared inside to the studs and is being sold as-is. Exterior was refinished and painted in 2024 and roof was also installed in 2024. Attached layout was intended for the property, but is only included as a reference idea, studs have not been changed to this layout. Utilities are currently off, but all area available at this location - water, sewer, cable, electric, gas. Owner is clearing out a few materials and expects to be able to be active and showing by June 2nd. House outer dimensions are roughly 17' by 52'. It is a blank slate inside and ready for your vision and skills!
Key facts
- 2,148 sq ft lot
- Listed 17 days
Property features AI
Exterior
- Parking: Off-street parking (plus street parking available)
- Utilities: Public water; Public sewer; Electric with circuit breakers
- Home design: Single-family residential home; Residential property
- Construction: Wood siding construction
- Exterior features: Asphalt roof
Interior
- Bathrooms: 2 full bathrooms
- Interior features: Crawl space basement; 5 total rooms
Neighborhood map
What this means for you Summary
Snapshot
- This is a 2-bed/2.0-bath single-family listed at $50k. Condition is rated fair.
Deal economics
- At list price, monthly cash flow is $813 ($10k/yr) — positive.
- The deal already cash-flows at list — no discount required.
- Meets the 1% rule at list price ($1k rent vs $50k).
- Recommended offer: $49k (1.5% below list) — sets the bar for market timing.
- Cap rate 25.8% vs local median 5.4% in Sandusky — top-decile yield for the area; either an underpriced asset or a hidden risk that comps aren't pricing in. Stress-test before assuming the spread holds.
Location & tenants
- Location reads 83/100 on livability (#63 in OH, #929 nationally) — a professional / high-income tenant draw. Strengths: commute A+, cost of living A+, housing A+; Watch: crime D-, employment F.
- Sandusky City (town): math 24% / reading 37% proficiency, ranked #583 of 656 in OH (top 89%) — families likely to look elsewhere, expect single-tenant / working-renter base with shorter leases; 71% free/reduced lunch — lower-income household profile, screen leases tightly.
- Market conditions: 209 active listings in the ZIP; 4 comparable units currently listed for rent nearby; rentals lingering (median 44d on market — plan ~5-8 weeks vacancy on turnover, expect pricing pressure); 100% of comp listings sitting > 30 days — soft ceiling on asking rent; 128 units permitted in Erie County in 2024 (5 in 5+ unit buildings).
Forward outlook
- Local home prices are declining (-3.0%/yr); year-one equity from $345 of loan paydown is wiped out by about $1k of value loss. Plan a longer hold.
- Erie County population projected at -15% by 2050 — secular population decline; favor cash flow + early exit over multi-decade hold.
- At projected returns (-3.0% appreciation + 3.0% rent growth), your $14k cash investment doubles in ~2 years — after that, you're playing with house money.
Negotiation context
- It's been on market 18 days — a 2% lower offer ($49k) is reasonable based on typical stale-listing flexibility.
Questions for the listing agent
- Have any recent inspections been done? Can we get a copy of the seller's disclosures and any deferred-maintenance estimates?
- Is there a deadline driving the sale (1031 exchange, divorce, estate, relocation)? That informs how much negotiation room exists.
- Crime grade is D in this area — have there been break-ins, vandalism, or insurance claims at this property in the last 3 years? What carrier currently insures it and at what premium?
- What's the average days-on-market for RENTAL listings here right now (not sales)? A rising rental-DOM trend means longer vacancies and softer asking-rent achievability than the comps imply.
- What's the recent tenant-quality profile in this submarket — average credit score on applications, eviction rate, late-payment / NSF rate, and stable-employment percentage? A property-management company in the area should have these aggregated.
- How much new for-sale + rental construction is in the pipeline within 1–3 miles? Heavy new supply typically softens prices + rents 12–24 months out; constrained supply supports both.
Investment metrics
- 1% rule
- 2.94% ✓
- Cap rate
- 25.85%
- Cash-on-cash
- 69.83%
- DSCR
- 4.11
- GRM
- 2.8
CMA / ARV
- ARV (on-the-fly)
- $99,008
- Comps found
- 12
Show comp detail 12 sales within ~0.75 mi
| Address | Dist | Beds/Ba | Sqft | Sold | Price | $/sf | Match |
|---|---|---|---|---|---|---|---|
| 1524 Brown St | 0.18mi | 3/1.0 (+1) | 927 (+5%) | 10mo | $25,000 | $27 | 66 |
| 1308 Vine St | 0.50mi | 2/1.0 | 847 (-4%) | 2mo | $109,900 | $130 | 64 |
| 302 Hendry St | 0.12mi | 2/1.0 | 780 (-12%) | 13mo | $28,000 | $36 | 60 |
| 906 Maple St | 0.50mi | 2/1.0 | 840 (-5%) | 11mo | $122,000 | $145 | 55 |
| 816 Perry St | 0.73mi | 2/1.0 | 884 (0%) | 10mo | $88,100 | $100 | 53 |
| 404 Reese St | 0.62mi | 3/1.0 (+1) | 900 (+2%) | 7mo | $101,000 | $112 | 53 |
| 1535 Camp St | 0.74mi | 2/1.0 | 924 (+4%) | 1mo | $71,000 | $77 | 53 |
| 1214 W Osborne St | 0.61mi | 3/1.0 (+1) | 966 (+9%) | 0mo | $139,000 | $144 | 47 |
| 510 Reese St | 0.69mi | 2/1.0 | 952 (+8%) | 7mo | $124,900 | $131 | 45 |
| 1309 Stone St | 0.58mi | 2/1.0 | 989 (+12%) | 5mo | $108,000 | $109 | 45 |
| 421 Scott St | 0.55mi | 3/1.0 (+1) | 1,012 (+14%) | 2mo | $119,900 | $118 | 39 |
| 1119 E Parish St | 0.72mi | 3/1.0 (+1) | 1,000 (+13%) | 6mo | $62,000 | $62 | 31 |
Match score weights: distance 35% · size 25% · config 20% · recency 20%. Top-matched comps best support the ARV.
Projected returns pro-forma
-3.0% appreciation · 3.0% rent growth · sell at horizon
- IRR
- 69.4%
- Equity multiple
- 4.13×
- Total profit
- $43,721
- Equity at exit
- $7,440
- IRR
- 73.4%
- Equity multiple
- 8.50×
- Total profit
- $104,843
- Equity at exit
- $4,314
Cash invested: $13,972 (down + closing). Projections, not guarantees.
Landlord ↔ Tenant lean methodology
- Overall (STATE)
- 73 Landlord-Friendly
- State Ohio
- 73 Landlord-Friendly · R+6
- County
- — inherits STATE
- City
- — inherits STATE
ZIP-level market 44870
- Active inventory
- 209
- Price-to-rent
- 2.8×
Monthly cashflow live
- Estimated rent
- $1,466 medium interval (Pro) →
- Mortgage (P&I)
- −$262
- Tax est. 1.5%
- −$62 /mo · $748/yr
- Insurance
- −$21
- HOA
- −$0
- Vacancy / Maint / Mgmt
- −$308
- Net cashflow
- $813
Break-even live
UW: 25.0% down · 7.5% · 30yr · 1.5% tax · 5.0% vac · 8.0% maint · 8.0% mgmt
Financing live
Cash to close
- Down payment
- $12,475
- Closing costs
- $1,497
- Reserves months
- —
- Total cash needed
- —
Loan-product check · same deal, 3 products live
Conventional
25% down · 7.5% · 30yr
- Down + closing
- —
- Monthly P&I
- —
- Monthly cashflow
- —
- DSCR
- —
- Eligible?
- —
Personal DTI + credit; lowest rate.
DSCR
20% down · 8.5% · 30yr
- Down + closing
- —
- Monthly P&I
- —
- Monthly cashflow
- —
- DSCR
- —
- Eligible?
- —
No personal income docs; deal must DSCR.
Hard money
10% down · 12.0% · 12mo
- Down + closing
- —
- Monthly P&I
- —
- Monthly cashflow
- —
- DSCR
- —
- Eligible?
- —
Short-term bridge; refi at stabilization.
Rent comps 4 comps
| Address | Beds | Baths | Sqft | Rent | $/sqft | DOM | Units | Dist |
|---|---|---|---|---|---|---|---|---|
| 1227 Avondale St Sandusky, OH | 1.0 | 1.0 | 670 | $1,045 | $1.56 | 43d | 1 | 0.76mi |
| 1515 W Perkins Ave Sandusky, OH | 2.0 | 1.0 | 925 | $925 | $1.00 | 43d | 1 | 1.00mi |
| 156 E Market St Sandusky, OH | 1.0–2.0 | 1.0–2.5 | 1266 | $3,539 | $2.79 | 43d | 5 | 1.02mi |
| 305 Perry St Sandusky, OH | 1.0 | 1.0 | 750 | $995 | $1.33 | 43d | 1 | 1.06mi |
Listing history 16 events
-
2026-06-19days on market $49,900 Active 18 DOM
-
2026-06-18days on market $49,900 Active 17 DOM
-
2026-06-17days on market $49,900 Active 16 DOM
-
2026-06-16days on market $49,900 Active 15 DOM
-
2026-06-15days on market $49,900 Active 14 DOM
-
2026-06-14days on market $49,900 Active 12 DOM
-
2026-06-12days on market $49,900 Active 11 DOM
-
2026-06-09days on market $49,900 Active 8 DOM
-
2026-06-08days on market $49,900 Active 7 DOM
-
2026-06-07days on market $49,900 Active 6 DOM
-
2026-06-03days on market $49,900 Active 2 DOM
-
2026-06-02statusdays on market $49,900 Active 1 DOM
-
2026-06-01days on market $49,900 Coming Soon 11 DOM
-
2026-05-31days on market $49,900 Coming Soon 10 DOM
-
2026-05-30days on market $49,900 Coming Soon 9 DOM
-
2026-05-21historical $49,900
ⓘ Source: listings_history table (triggers on properties + properties_extension) + one-shot
backfill from property_details.listing_events for pre-trigger history.
Nearby sold comps map
Loading sold comps map…
Walkable amenities ~0.75 mi
Loading nearby amenities…
Taxation est. · year 1
- Rental income
- $17,589
- − Mortgage interest
- −$2,795
- − Property taxes
- −$748
- − Insurance
- −$250
- − Repairs & maintenance
- −$1,407
- − Management
- −$1,407
- − Depreciation
- −$1,452
- Taxable income
- $9,530
- Est. tax owed @ 24.0%
- −$2,287
- After-tax cash flow
- $7,470/yr
For passive investors: Depreciation is non-cash, so a rental often shows a tax loss while cash-flowing — sheltering income. Rental losses are passive: they offset passive income freely, and up to $25,000/yr can offset ordinary (W-2) income if you actively participate and your MAGI is under $100k (phasing out to $0 by $150k); unused losses carry forward. On sale, claimed depreciation is recaptured at up to 25%, and gains may owe capital-gains tax (a 1031 exchange can defer both). Figures are a year-1 estimate at your 24.0% rate — not tax advice; consult a CPA.
Condition & rehab AI · 8 photos
This property requires extensive repairs and updates to be considered habitable. The exterior siding and interior structural repairs are critical to restoring the home's functionality and increasing its value.
Repairs flagged
- Major Exterior siding — Severe damage and peeling paint indicate significant structural issues.
- Major Interior walls — Exposed framing and debris suggest extensive structural damage.
- Major Bathroom fixtures — Exposed plumbing and no fixtures indicate a complete lack of functionality.
- Major Flooring — Exposed subfloor and debris indicate significant damage and need for replacement.
- Major All systems — Given the state of the interior, all systems are likely in need of repair or replacement.
Value-add opportunities
- Both Exterior siding repair and repainting — Aesthetic improvement and increased curb appeal.
- Both Interior structural repairs and drywall installation — Restores functionality and prepares the home for move-in.
- Both Bathroom fixtures and plumbing repair — Restores functionality and prepares the home for move-in.
- Both Flooring replacement — Restores functionality and prepares the home for move-in.
- Both All systems repair or replacement — Restores functionality and prepares the home for move-in.
Renovation cost estimate screening
| Repair item | Severity | Est. cost |
|---|---|---|
| Exterior siding · Severe damage and peeling paint indicate significant structural issues. | Major | $15,000–50,000 |
| Interior walls · Exposed framing and debris suggest extensive structural damage. | Major | $15,000–50,000 |
| Bathroom fixtures · Exposed plumbing and no fixtures indicate a complete lack of functionality. | Major | $15,000–50,000 |
| Flooring · Exposed subfloor and debris indicate significant damage and need for replacement. | Major | $15,000–50,000 |
| All systems · Given the state of the interior, all systems are likely in need of repair or replacement. | Major | $15,000–50,000 |
| Total estimated repair cost · 5 items | $75,000–250,000 |
Value-add ROI direction
- Both Exterior siding repair and repainting — Aesthetic improvement and increased curb appeal. ↑
- Both Interior structural repairs and drywall installation — Restores functionality and prepares the home for move-in. ↑
- Both Bathroom fixtures and plumbing repair — Restores functionality and prepares the home for move-in. ↑
- Both Flooring replacement — Restores functionality and prepares the home for move-in. ↑
- Both All systems repair or replacement — Restores functionality and prepares the home for move-in. ↑
ⓘ Cost ranges are severity-bucket heuristics (US national rule-of-thumb). Get contractor quotes + a written scope before underwriting a rehab budget.
Schools (NCES district)
- District
- Sandusky City
- NCES district ID
- 3904474
- Math proficiency
- 24% ▼ -17.00%
- Reading proficiency
- 37% ▼ -9.00%
- Median HH income
- $34,583
- Composite
- 25.1/100
- National rank
- #7532
- State rank
- #583 of 656 in OH
Livability — Sandusky
- Score
- 83/100
- State rank
- #63
- US rank
- #929
Category grades
Schools grade is shown separately in the Schools card above.
Census & demographics
- Census place
- Sandusky, OH
- County
- Erie County · 39,883 people
- City population
- 39,883
- Metro
- Sandusky, OH
- Population (ZIP)
- 39,883
- Household income
- $62,082
- Rent vs Own
- Severe rent burden
- 1602.0
Population outlook (Erie County) Hauer SSP2
- Today (2025)
- 73,204 people
- By 2030
- 71,341 · -2.5%
- By 2040
- 66,771 · -8.8%
- By 2050
- 62,512 · -14.6%
- By 2075
- 56,154 · -23.3%
- By 2100
- 49,045 · -33.0%
Race, ethnicity, and origin ACS 2023
- Neighborhood character
- Predominantly White (72%)
- Race & ethnicity
- White 72% Black 15% Two or more races 8% Hispanic / Latino 5%
- Common ancestry
- Romanian 3% Slovak 2% Subsaharan African 1%
- Foreign-born
- 1% · Canada
- Languages at home
- 96% English-only · Spanish 2%
Political lean MEDSL · Erie
- 2024 margin
- R (+14.1) · D 42.5% · R 56.6%
- 2008→2024 swing
- -28.0pp toward R · 2008: 13.9pp · 2024: -14.1pp
- All cycles
- 2024: R+14.1 2020: R+11.6 2016: R+9.8 2012: D+11.3 2008: D+13.9
Not yet ingested
- Civics
- —
Market trends
- HPI YoY
- ▼ -151.99%
- Current HPI
- 209.6383
- Rent YoY
- —
- Metro
- Sandusky, OH
- State GDP YoY
- ▲ 1.98%
- F500 in state
- 48
Industry mix (Fortune 500 HQ in OH)
| Industry | F500 HQs | Revenue |
|---|---|---|
| Insurance | 3 | $145B |
|
||
| Industrial Machinery | 3 | $49B |
|
||
| Financial Services | 3 | $24B |
|
||
| Consumer Goods | 2 | $93B |
|
||
| Aerospace / Defense | 2 | $47B |
|
||
| Utilities | 2 | $33B |
|
||
Price history
1 event — show timeline
- 2026-05-21 Coming Soon $49,900 FAOR
Cash-flow waterfall
monthlySold comps — $/sqft
last 12 mo · ≤1 miLoading sold comps…