23810 Marbella Bay Rd #103 · Estero, FL
Flood risk 1/10 · Minimal
- FEMA flood zone
- X (unshaded)
- Chance of flooding over 30 yrs
- 0.0%
- Est. flood insurance / yr
- $507 – $1,088
Fire risk 4/10 · Minor
- Est. fire insurance / yr
- $947 – $1,759
Heat risk 10/10 · Severe
- Hot days now (above 107°F)
- 7 days/yr
- Hot days in 30 yrs
- 32 days/yr
Wind risk 10/10 · Severe
- Chance of severe wind over 30 yrs
- 99.0%
Air-quality risk 3/10 · Minor
- Unhealthy air days now
- 2 days/yr
- Unhealthy air days in 30 yrs
- 2 days/yr
Risk factors via First Street. Map © Google.
Why this score? — see what drove the B- grade
The composite is a weighted blend of 9 inputs, each scored 0–100. Each bar is that input's sub-score; the figure is the points it added to the 100-point composite (weight × sub-score).
- Cash flow +26.2/30.0
- 1% rule +10.0/10.0
- DSCR +8.9/10.0
- ARV discount +7.5/15.0
- Schools +4.1/10.0
- Livability +4.0/5.0
- Condition / age +2.5/5.0
- Rent growth +2.3/5.0
- Appreciation +0.0/10.0
$299,000
🖨 Deal sheet (PDF) 📄 Offer letter ✓ Due diligence
Listing remarks
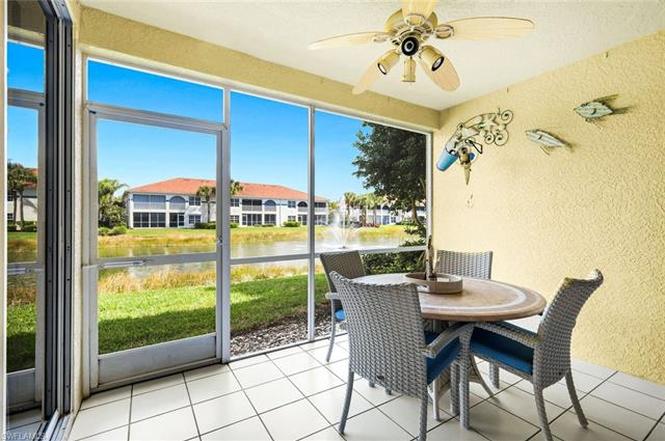
Welcome to this light and airy 1st-floor condominium featuring 2 bedrooms, 2 bathrooms, and a versatile open den/flex space ideal for a home office, reading nook, or extra guest area! Designed for comfort and easy living, it showcases soothing pastel tones, abundant natural light, and serene eastern views of the calming lake. Start your mornings on the private screened-in lanai, enjoying peaceful sunrises and tranquil water views with your coffee in hand. The open-concept layout creates a seamless flow between living, dining, and kitchen areas, making the home feel spacious and inviting. Tile flooring runs throughout the main living areas for effortless maintenance, while luxury vinyl wood-
Key facts
- Gated community
- Lake views
- Open den flex space
Tags
Property features AI
Finance
- Financial info: Condo fee reported as $2,450 (quarterly)
- HOA & community: Mandatory HOA with professional management; Quarterly condo fee; HOA maintenance covers cable, insurance, internet/WiFi, irrigation water, lawn/land maintenance, legal/accounting, manager, master association fee, pest control (exterior), repairs, reserves, security, sewer, street lights, street maintenance, trash removal and water; Community amenities include community pool and spa, exercise room, tennis and pickleball courts, basketball, beach club access, lakefront beach, fishing pier, BBQ/picnic area, library, sauna, community room, sidewalks and streetlights, bike and jog path, underground utilities; Total annual recurring HOA fees listed as $9,800 and total one-time fees listed as $150
Exterior
- Parking: 1 assigned parking space; Detached 1-car carport
- Security: Gated community; Community security included in maintenance
- Utilities: Central water; Central sewer; Cable available
- Home design: Residential carriage/coach unit in a low-rise (1-3) building; Built in 2003; Rear exposure to the east; Located in Lighthouse Bay at The Brooks
- Construction: Concrete block construction
- Exterior features: Stucco exterior; Metal roof; Single hung and sliding windows; Gated community; Lakefront view; Irrigation with reclaimed water
Interior
- Kitchen: Pantry; Dishwasher; Disposal; Microwave; Range; Refrigerator/Freezer; Self-cleaning oven
- Bedrooms: 2 bedrooms plus a den (study)
- Flooring: Tile; Vinyl
- Bathrooms: 2 full bathrooms; Master bath with dual sinks and shower (no tub)
- Heating & cooling: Central electric heat; Central electric cooling; Ceiling fans
- Interior features: Cable prewire and high-speed internet available; Pantry; Smoke detectors; Walk-in closet; Turnkey furnished; Split bedroom floor plan; Breakfast bar; Screened lanai/porch
- Laundry & utility: Washer and dryer in residence; Laundry in residence
Neighborhood map
What this means for you Summary
Snapshot
- This is a 2-bed/2.0-bath condo listed at $299k.
Deal economics
- At list price, monthly cash flow is $763 ($9k/yr) — positive.
- The deal already cash-flows at list — no discount required.
- Meets the 1% rule at list price ($5k rent vs $299k).
- Recommended offer: $272k (9.0% below list) — sets the bar for market timing.
- Cap rate 9.4% vs local median 3.4% in Estero — top-decile yield for the area; either an underpriced asset or a hidden risk that comps aren't pricing in. Stress-test before assuming the spread holds.
Location & tenants
- Location reads 79/100 on livability (#149 in FL, #2,242 nationally) — a middle-class / working-renter tenant base. Strengths: crime A+, employment A+, housing A+; Watch: amenities F, commute F, cost of living D-.
- Lee (suburban): math 47% / reading 50% proficiency, ranked #42 of 73 in FL (top 58%) — families likely to look elsewhere, expect single-tenant / working-renter base with shorter leases.
- Market conditions: Rents soft (-0.6%/yr); 835 active listings in the ZIP; 16 comparable units currently listed for rent nearby; rentals at typical pace (median 25d on market — plan ~3-4 weeks tenant-placement turnaround); solid renter incomes; 15,411 units permitted in Lee County in 2024 (4,686 in 5+ unit buildings).
- At $4,514/mo this rent would consume 59% of the median local household income ($91k/yr) (locally 976% of renters already pay >50% of income on rent) — very limited rent-growth headroom before tenants either downsize or default.
Forward outlook
- Local home prices are declining (-3.0%/yr); year-one equity from $2k of loan paydown is wiped out by about $9k of value loss. Plan a longer hold.
- Lee County population projected at +44% by 2050 — long-run rental-demand tailwind backs the buy-and-hold thesis.
Negotiation context
- It's been on market 108 days — a 9% lower offer ($272k) is reasonable based on typical stale-listing flexibility.
- 3 sale attempts; this cycle's ask is 13491% above the opening price — seller raised mid-cycle; expect resistance to lowballs.
- Current owner paid $170k; list at $299k implies a 76% gain — meaningful room to come down on a strong offer.
Risks & watch-outs
- Climate carrying-cost: severe wind risk, 99% chance of damaging wind over 30y; extreme-heat days projected 7→32/yr by 2055 (HVAC capex compounding) — expect insurance premiums to compound above CPI over the hold.
Questions for the listing agent
- It's been on market 108 days. Have you received any prior offers? Is the seller open to a 9% concession, seller financing, or rate buy-down credit?
- What does the HOA fee cover, when was the last increase, and are there any pending special assessments or reserve-fund shortfalls?
- Any open or pending special assessments — roof, HVAC, plumbing, elevator, façade? What's the per-unit balance and payoff schedule, and is the seller paying it off at close or rolling it to the buyer?
- Why hasn't it sold? Are there any deal-killer items the seller is aware of (foundation, flood, title, zoning, code violations)?
- Is there a deadline driving the sale (1031 exchange, divorce, estate, relocation)? That informs how much negotiation room exists.
- Schools are A-rated — typically a magnet for longer-tenancy family renters. What's the average tenant stay here, and is there a school-zone premium baked into asking?
- What's the average days-on-market for RENTAL listings here right now (not sales)? A rising rental-DOM trend means longer vacancies and softer asking-rent achievability than the comps imply.
- What's the recent tenant-quality profile in this submarket — average credit score on applications, eviction rate, late-payment / NSF rate, and stable-employment percentage? A property-management company in the area should have these aggregated.
- How much new apartment / multifamily construction is in the pipeline within 1–3 miles? Heavy new supply (>2% of stock underway) typically softens rents 12–24 months out; light construction supports rent growth.
Investment metrics
- 1% rule
- 1.51% ✓
- Cap rate
- 9.36%
- Cash-on-cash
- 10.94%
- DSCR
- 1.49
- GRM
- 5.5
CMA / ARV
No comps found within radius.
Projected returns pro-forma
-3.0% appreciation · 0.0% rent growth · sell at horizon
- IRR
- -4.2%
- Equity multiple
- 0.85×
- Total profit
- $-12,565
- Equity at exit
- $44,582
- IRR
- 0.5%
- Equity multiple
- 1.03×
- Total profit
- $2,621
- Equity at exit
- $25,852
Cash invested: $83,720 (down + closing). Projections, not guarantees.
Landlord ↔ Tenant lean methodology
- Overall (STATE)
- 87 Strongly Landlord-Friendly
- State Florida
- 87 Strongly Landlord-Friendly · R+3
- County
- — inherits STATE
- City
- — inherits STATE
ZIP-level market 34135
- Rents YoY
- -0.6%
- Active inventory
- 835
- Price-to-rent
- 5.5×
Monthly cashflow live
- Estimated rent
- $4,514 high interval (Pro) →
- Mortgage (P&I)
- −$1,568
- Tax from tax record
- −$294 /mo · $3,524/yr
- Insurance
- −$125
- HOA
- −$817
- Vacancy / Maint / Mgmt
- −$948
- Net cashflow
- $763
Break-even live
Sensitivity live
| Price | -10% $932 | -5% $848 | +0% $763 | +5% $678 | +10% $594 |
|---|---|---|---|---|---|
| Rent | -10% $406 | -5% $585 | +0% $763 | +5% $941 | +10% $1,120 |
| Rate | -1.0pp $914 | -0.5pp $839 | base $763 | +0.5pp $685 | +1.0pp $607 |
UW: 25.0% down · 7.5% · 30yr · 1.5% tax · 5.0% vac · 8.0% maint · 8.0% mgmt
Financing live
Cash to close
- Down payment
- $74,750
- Closing costs
- $8,970
- Reserves months
- —
- Total cash needed
- —
Loan-product check · same deal, 3 products live
Conventional
25% down · 7.5% · 30yr
- Down + closing
- —
- Monthly P&I
- —
- Monthly cashflow
- —
- DSCR
- —
- Eligible?
- —
Personal DTI + credit; lowest rate.
DSCR
20% down · 8.5% · 30yr
- Down + closing
- —
- Monthly P&I
- —
- Monthly cashflow
- —
- DSCR
- —
- Eligible?
- —
No personal income docs; deal must DSCR.
Hard money
10% down · 12.0% · 12mo
- Down + closing
- —
- Monthly P&I
- —
- Monthly cashflow
- —
- DSCR
- —
- Eligible?
- —
Short-term bridge; refi at stabilization.
Rent comps 16 comps
| Address | Beds | Baths | Sqft | Rent | $/sqft | DOM | Units | Dist |
|---|---|---|---|---|---|---|---|---|
| 23810 Marbella Bay Rd #102 Estero, FL | 2.0 | 2.0 | 1103 | $5,000 | $4.53 | 24d | 1 | 0.02mi |
| 23821 Marbella Bay Rd Ofc Season Bonita Springs, FL | 2.0 | 2.0 | 1279 | $2,500 | $1.95 | 24d | 1 | 0.04mi |
| 23821 Marbella Bay Rd #102 Estero, FL | 2.0 | 2.0 | 1279 | $5,750 | $4.50 | 24d | 1 | 0.04mi |
| 23810 Costa del Sol Rd #203 Estero, FL | 2.0 | 2.0 | 1276 | $2,400 | $1.88 | 17d | 1 | 0.14mi |
| 10911 Santa Margherita Rd #102 Estero, FL | 2.0 | 2.0 | 1279 | $2,800 | $2.19 | 24d | 1 | 0.21mi |
| 10910 Santa Margherita Rd #102 Estero, FL | 3.0 | 2.0 | 1279 | $2,200 | $1.72 | 24d | 1 | 0.23mi |
| 9030 Spring Run Blvd #508 Estero, FL | 2.0 | 2.0 | 1333 | $6,500 | $4.88 | 24d | 1 | 1.01mi |
| 10041 Maddox Ln #203 Bonita Springs, FL | 3.0 | 2.0 | 1083 | $5,000 | $4.62 | 24d | 1 | 1.24mi |
| 10041 Maddox Ln Bonita Springs, FL | 2.0 | 2.0 | 1213 | $5,000 | $4.12 | 24d | 1 | 1.24mi |
| 10030 Maddox Ln #206 Bonita Springs, FL | 3.0 | 2.0 | 1327 | $2,150 | $1.62 | 22d | 1 | 1.26mi |
| 23591 Sandycreek Ter #1006 Estero, FL | 2.0 | 2.0 | 1209 | $6,000 | $4.96 | 24d | 1 | 1.26mi |
| 23601 Sandycreek Ter #903 Estero, FL | 2.0 | 2.0 | 1246 | $6,000 | $4.82 | 24d | 1 | 1.26mi |
| 23526 Sandycreek Ter #304 Estero, FL | 2.0 | 2.0 | 1368 | $6,500 | $4.75 | 24d | 1 | 1.28mi |
| 10020 Maddox Ln #213 Bonita Springs, FL | 2.0 | 2.0 | 1224 | $2,350 | $1.92 | 22d | 1 | 1.28mi |
| 10010 Maddox Ln #318 Bonita Springs, FL | 2.0 | 2.0 | 1224 | $1,550 | $1.27 | 24d | 1 | 1.31mi |
| 10000 Maddox Ln #125 Bonita Springs, FL | 2.0 | 2.0 | 1129 | $4,000 | $3.54 | 24d | 1 | 1.33mi |
HOA detail condo
- Monthly dues
- $817 · $9,804/yr
- Likely covers
- water
- Assessments
- None detected in remarks — confirm with the listing agent.
Listing history 15 events
-
2026-06-17days on market $299,000 Active 108 DOM
-
2026-06-16days on market $299,000 Active 107 DOM
-
2026-06-15days on market $299,000 Active 106 DOM
-
2026-06-13days on market $299,000 Active 104 DOM
-
2026-06-10days on market $299,000 Active 101 DOM
-
2026-06-09days on market $299,000 Active 100 DOM
-
2026-06-07days on market $299,000 Active 98 DOM
-
2026-06-02days on market $299,000 Active 93 DOM
-
2026-06-01days on market $299,000 Active 92 DOM
-
2026-06-01days on market $299,000 Active 91 DOM
-
2026-05-07$2,200
-
2026-05-07historical $2,200
-
2026-05-05$2,200
-
2026-03-01$299,000 Active
-
2008-12-24soldstatus $170,000
ⓘ Source: listings_history table (triggers on properties + properties_extension) + one-shot
backfill from property_details.listing_events for pre-trigger history.
Tax reassessment forecast FL · Resets to sale price
- Current annual tax
- $3,524 · $294/mo
- Projected year-2 tax
- $3,524 · $294/mo
- Expected delta
- $0/yr ($0/mo · 0.0%)
ⓘ Screening estimate from a state-policy table — verify with the county assessor before closing.
Climate risk First Street
- Flood 1/10 Low FEMA zone X (unshaded) · 0% chance over 30 yrs
- Wildfire 4/10 Moderate
- Heat 10/10 Extreme 7 d/yr ≥107°F today · 32 d/yr by 30 yrs out
- Wind 10/10 Extreme 99% chance of damaging wind over 30 yrs
- Air quality 3/10 Moderate 2 unhealthy d/yr today · 2 by 30 yrs out
Nearby sold comps map
Loading sold comps map…
Walkable amenities ~0.75 mi
Loading nearby amenities…
Taxation est. · year 1
- Rental income
- $54,171
- − Mortgage interest
- −$16,749
- − Property taxes
- −$3,524
- − Insurance
- −$1,495
- − Repairs & maintenance
- −$4,334
- − Management
- −$4,334
- − HOA
- −$9,804
- − Depreciation
- −$8,698
- Taxable income
- $5,233
- Est. tax owed @ 24.0%
- −$1,256
- After-tax cash flow
- $7,900/yr
For passive investors: Depreciation is non-cash, so a rental often shows a tax loss while cash-flowing — sheltering income. Rental losses are passive: they offset passive income freely, and up to $25,000/yr can offset ordinary (W-2) income if you actively participate and your MAGI is under $100k (phasing out to $0 by $150k); unused losses carry forward. On sale, claimed depreciation is recaptured at up to 25%, and gains may owe capital-gains tax (a 1031 exchange can defer both). Figures are a year-1 estimate at your 24.0% rate — not tax advice; consult a CPA.
Schools (NCES district)
- District
- Lee
- NCES district ID
- 1201080
- Math proficiency
- 47% ▼ -11.00%
- Reading proficiency
- 50% ▼ -4.00%
- Median HH income
- $49,518
- Composite
- 41.49/100
- National rank
- #3458
- State rank
- #42 of 73 in FL
Livability — Estero
- Score
- 79/100
- State rank
- #149
- US rank
- #2242
Category grades
Schools grade is shown separately in the Schools card above.
Census & demographics
- Census place
- Estero, FL
- County
- Lee County · 788,662 people
- City population
- 31,926
- Metro
- Cape Coral-Fort Myers, FL
- Population (ZIP)
- 48,252
- Household income
- $91,380
- Rent vs Own
- Severe rent burden
- 976.0
Population outlook (Lee County) Hauer SSP2
- Today (2025)
- 871,946 people
- By 2030
- 955,468 · +9.6%
- By 2040
- 1,113,587 · +27.7%
- By 2050
- 1,256,891 · +44.1%
- By 2075
- 1,560,270 · +78.9%
- By 2100
- 1,726,848 · +98.0%
Race, ethnicity, and origin ACS 2023
- Neighborhood character
- Predominantly White (69%)
- Race & ethnicity
- White 69% Hispanic / Latino 26% Two or more races 13% Native American 3% Black 2%
- Hispanic origin (detail)
- Mexican 8% Puerto Rican 4% Cuban 3%
- Common ancestry
- Romanian 5% Lithuanian 2% Slovak 2%
- Foreign-born
- 22% · Canada, Jamaica
- Languages at home
- 74% English-only · Spanish 21% French/Haitian/Cajun 1% Russian/Polish/Slavic 1%
Political lean MEDSL · Lee
- 2024 margin
- Strong R (+28.4) · D 35.5% · R 63.9%
- 2008→2024 swing
- -18.0pp toward R · 2008: -10.4pp · 2024: -28.4pp
- All cycles
- 2024: R+28.4 2020: R+19.2 2016: R+20.4 2012: R+16.6 2008: R+10.4
Not yet ingested
- Civics
- —
Market trends
- HPI YoY
- ▼ -188.86%
- Current HPI
- 243.4153
- Rent YoY
- ▼ -0.61%
- Metro
- Cape Coral-Fort Myers, FL
- State GDP YoY
- ▲ 3.28%
- F500 in state
- 36
Industry mix (Fortune 500 HQ in FL)
| Industry | F500 HQs | Revenue |
|---|---|---|
| Industrial Technology | 2 | $29B |
|
||
| Insurance | 2 | $17B |
|
||
| Retail | 1 | $60B |
|
||
| Technology Distribution | 1 | $58B |
|
||
| Homebuilding | 1 | $35B |
|
||
| Technology Manufacturing | 1 | $35B |
|
||
Price history
-98.7% since first listed5 events — show timeline
- 2026-05-07 Listed for Rent $2,200 FGCMLS
- 2026-05-07 Rental Removed $2,200 NAPLESMLS
- 2026-05-05 Listed for Rent $2,200 NAPLESMLS
- 2026-03-01 Listed $299,000 NAPLESMLS
- 2008-12-24 Sold (Public Records) $170,000 Public Records
Property tax history
+3.1%/yrLatest (2025): $3,524 · -11.9% YoY. Source: county tax records.
Cash-flow waterfall
monthlySold comps — $/sqft
last 12 mo · ≤1 miLoading sold comps…