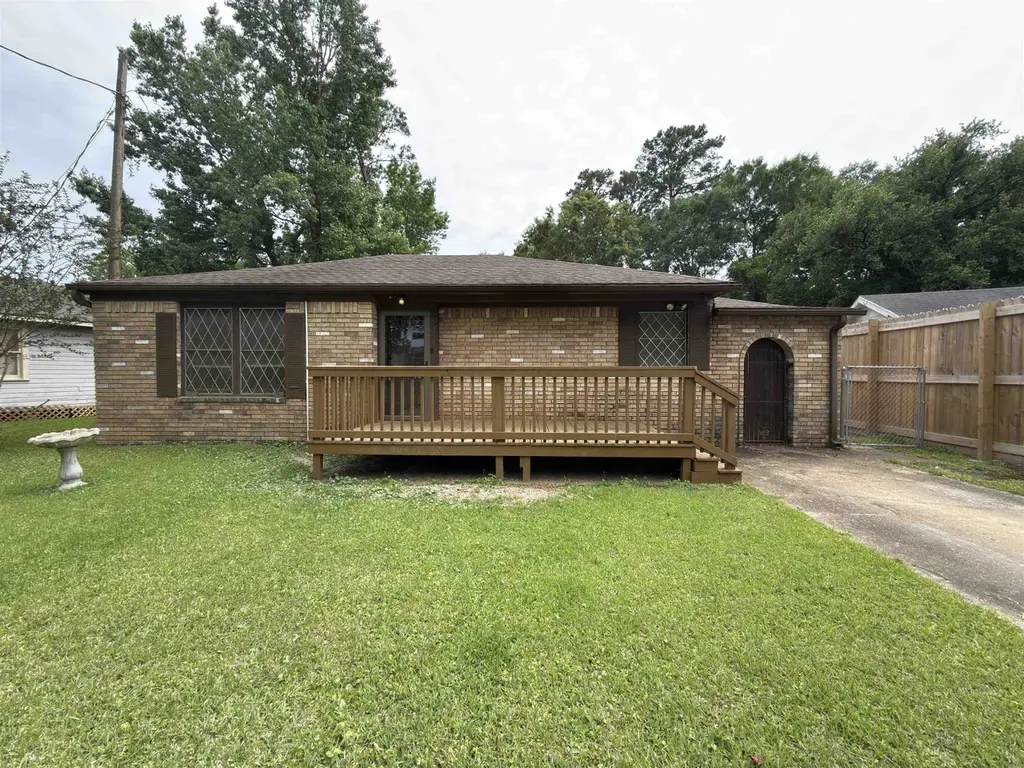
563 W Bolivar St · Vidor, TX
Flood risk 1/10 · Minimal
- FEMA flood zone
- X (unshaded)
- Chance of flooding over 30 yrs
- 0.0%
- Est. flood insurance / yr
- $507 – $1,088
Fire risk 6/10 · Moderate
- Est. fire insurance / yr
- $1,222 – $2,270
Heat risk 9/10 · Severe
- Hot days now (above 110°F)
- 7 days/yr
- Hot days in 30 yrs
- 24 days/yr
Wind risk 9/10 · Severe
- Chance of severe wind over 30 yrs
- 99.0%
Air-quality risk 2/10 · Minimal
- Unhealthy air days now
- 1 days/yr
- Unhealthy air days in 30 yrs
- 1 days/yr
Risk factors via First Street. Map © Google.
Why this score? — see what drove the B grade
The composite is a weighted blend of 9 inputs, each scored 0–100. Each bar is that input's sub-score; the figure is the points it added to the 100-point composite (weight × sub-score).
- Cash flow +28.2/30.0
- ARV discount +15.0/15.0
- DSCR +10.0/10.0
- 1% rule +8.1/10.0
- Schools +3.4/10.0
- Livability +3.4/5.0
- Rent growth +2.5/5.0
- Condition / age +2.5/5.0
- Appreciation +0.0/10.0
$100,000
🖨 Deal sheet 📄 Offer letter ✓ Due diligence
Listing remarks
This charming Vidor home is ready for a fresh start and new memories! From the moment you arrive, the inviting front porch creates the perfect spot to enjoy your morning coffee or unwind after a long day. Inside, you’ll find a home full of potential with space to add your own style and personal touches. Whether you are looking for your first home, downsizing, or searching for an investment opportunity, this property offers the chance to create something truly special. Conveniently located near local shopping, dining, and schools with easy access to everyday essentials. Come imagine the possibilities and see how easily this house could feel like home!
Key facts
- 0.24 acre lot
- Listed 42 days
Property features AI
Exterior
- Utilities: Public water; Public sewer
- Home design: Single-family residence; Residential property; Located in T H Breece subdivision
- Construction: Brick veneer construction
- Exterior features: Chain link fencing
Interior
- Kitchen: Range
- Flooring: Carpet; Vinyl
- Bathrooms: 1 full bathroom
- Interior features: Ceiling fans; Central air conditioning; Central electric heating
Neighborhood map
What this means for you Summary
Snapshot
- This is a 2-bed/1.0-bath single-family listed at $100k.
Deal economics
- At list price, monthly cash flow is $318 ($4k/yr) — positive.
- The deal already cash-flows at list — no discount required.
- Meets the 1% rule at list price ($1k rent vs $100k).
- Recommended offer: $97k (3.0% below list) — sets the bar for market timing.
- Cap rate 10.1% vs local median 4.6% in Vidor — top-decile yield for the area; either an underpriced asset or a hidden risk that comps aren't pricing in. Stress-test before assuming the spread holds.
Location & tenants
- Location reads 67/100 on livability (#576 in TX) — a middle-class / working-renter tenant base. Strengths: cost of living A+, housing A+, crime B; Watch: schools D-, amenities F, commute F.
- Vidor ISD (suburban): math 41% / reading 39% proficiency, ranked #422 of 826 in TX (top 51%) — families likely to look elsewhere, expect single-tenant / working-renter base with shorter leases.
- Market conditions: 241 active listings in the ZIP; 6 comparable units currently listed for rent nearby; rentals at typical pace (median 14d on market — plan ~3-4 weeks tenant-placement turnaround); 235 units permitted in Orange County in 2024 (50 in 5+ unit buildings).
Forward outlook
- Local home prices are declining (-3.0%/yr); year-one equity from $691 of loan paydown is wiped out by about $3k of value loss. Plan a longer hold.
- Orange County population projected at +6% by 2050 — modest demand growth; plan on rents tracking national, not racing it.
- At projected returns (-3.0% appreciation + 3.0% rent growth), your $28k cash investment doubles in ~9 years — after that, you're playing with house money.
Negotiation context
- It's been on market 42 days — a 3% lower offer ($97k) is reasonable based on typical stale-listing flexibility.
Risks & watch-outs
- Watch-outs: built in 1956 — expect roof / HVAC / electrical / plumbing capex.
- Climate carrying-cost: severe wind risk, 99% chance of damaging wind over 30y; major wildfire risk; extreme-heat days projected 7→24/yr by 2055 (HVAC capex compounding) — expect insurance premiums to compound above CPI over the hold.
Questions for the listing agent
- It's been on market 42 days. Have you received any prior offers? Is the seller open to a 3% concession, seller financing, or rate buy-down credit?
- Built in 1956 — when were the roof, HVAC, electrical panel, plumbing, and water heater last replaced?
- Is there a deadline driving the sale (1031 exchange, divorce, estate, relocation)? That informs how much negotiation room exists.
- Schools are D-rated, which usually means shorter tenancies and higher turnover. Who's the typical renter profile here, and what's been the actual vacancy rate?
- What's the average days-on-market for RENTAL listings here right now (not sales)? A rising rental-DOM trend means longer vacancies and softer asking-rent achievability than the comps imply.
- What's the recent tenant-quality profile in this submarket — average credit score on applications, eviction rate, late-payment / NSF rate, and stable-employment percentage? A property-management company in the area should have these aggregated.
- How much new for-sale + rental construction is in the pipeline within 1–3 miles? Heavy new supply typically softens prices + rents 12–24 months out; constrained supply supports both.
Investment metrics
- 1% rule
- 1.31% ✓
- Cap rate
- 10.10%
- Cash-on-cash
- 13.61%
- DSCR
- 1.61
- GRM
- 6.4
CMA / ARV
- ARV (median comp)
- $132,471
- List price
- $100,000
- Delta
- -24.51%
- Verdict
- UNDERPRICED
- Comps
- 19 within 1.0 mi
Show comp detail 2 sales within ~0.75 mi
| Address | Dist | Beds/Ba | Sqft | Sold | Price | $/sf | Match |
|---|---|---|---|---|---|---|---|
| 405 W Bolivar St | 0.19mi | 3/2.0 (+1) | 1,216 (-0%) | 12mo | $120,000 | $99 | 72 |
| 265 Beach St | 0.65mi | 3/1.5 (+1) | 1,300 (+7%) | 7mo | $132,900 | $102 | 45 |
Match score weights: distance 35% · size 25% · config 20% · recency 20%. Top-matched comps best support the ARV.
Projected returns pro-forma
-3.0% appreciation · 3.0% rent growth · sell at horizon
- IRR
- 3.8%
- Equity multiple
- 1.14×
- Total profit
- $4,058
- Equity at exit
- $14,910
- IRR
- 13.3%
- Equity multiple
- 2.06×
- Total profit
- $29,718
- Equity at exit
- $8,646
Cash invested: $28,000 (down + closing). Projections, not guarantees.
Landlord ↔ Tenant lean methodology
- Overall (STATE)
- 87 Strongly Landlord-Friendly
- State Texas
- 87 Strongly Landlord-Friendly · R+5
- County
- — inherits STATE
- City
- — inherits STATE
ZIP-level market 77662
- Active inventory
- 241
- Price-to-rent
- 6.4×
Monthly cashflow live
- Estimated rent
- $1,306 high interval (Pro) →
- Mortgage (P&I)
- −$524
- Tax from tax record
- −$148 /mo · $1,775/yr
- Insurance
- −$42
- HOA
- −$0
- Vacancy / Maint / Mgmt
- −$274
- Net cashflow
- $318
Break-even live
Sensitivity live
| Price | -10% $374 | -5% $346 | +0% $318 | +5% $289 | +10% $261 |
|---|---|---|---|---|---|
| Rent | -10% $214 | -5% $266 | +0% $318 | +5% $369 | +10% $421 |
| Rate | -1.0pp $368 | -0.5pp $343 | base $318 | +0.5pp $292 | +1.0pp $265 |
UW: 25.0% down · 7.5% · 30yr · 1.5% tax · 5.0% vac · 8.0% maint · 8.0% mgmt
Financing live
Cash to close
- Down payment
- $25,000
- Closing costs
- $3,000
- Reserves months
- —
- Total cash needed
- —
Loan-product check · same deal, 3 products live
Conventional
25% down · 7.5% · 30yr
- Down + closing
- —
- Monthly P&I
- —
- Monthly cashflow
- —
- DSCR
- —
- Eligible?
- —
Personal DTI + credit; lowest rate.
DSCR
20% down · 8.5% · 30yr
- Down + closing
- —
- Monthly P&I
- —
- Monthly cashflow
- —
- DSCR
- —
- Eligible?
- —
No personal income docs; deal must DSCR.
Hard money
10% down · 12.0% · 12mo
- Down + closing
- —
- Monthly P&I
- —
- Monthly cashflow
- —
- DSCR
- —
- Eligible?
- —
Short-term bridge; refi at stabilization.
Rent comps 6 comps
| Address | Beds | Baths | Sqft | Rent | $/sqft | DOM | Units | Dist |
|---|---|---|---|---|---|---|---|---|
| 240 Mill St Unit B Vidor, TX | 1.0 | 1.0 | 880 | $995 | $1.13 | 14d | 1 | 0.24mi |
| 290 Beach St Vidor, TX | 3.0 | 1.5 | 1000 | $1,550 | $1.55 | 14d | 1 | 0.62mi |
| 575 Moreland St Vidor, TX | 3.0 | 1.5 | 1418 | $1,395 | $0.98 | 14d | 1 | 0.66mi |
| 315 N Dwayne Cir Vidor, TX | 3.0 | 1.5 | 1040 | $1,600 | $1.54 | 21d | 1 | 0.77mi |
| 475 S Denver St Vidor, TX | 2.0–3.0 | 1.0 | 910 | $850 | $0.93 | 44d | 2 | 0.95mi |
| 475 S Denver St Unit St216 Vidor, TX | 2.0 | 1.0 | 880 | $850 | $0.97 | 14d | 1 | 0.95mi |
Listing history 15 events
-
2026-06-18days on market $100,000 Active 42 DOM
-
2026-06-17days on market $100,000 Active 41 DOM
-
2026-06-16days on market $100,000 Active 40 DOM
-
2026-06-15days on market $100,000 Active 39 DOM
-
2026-06-14days on market $100,000 Active 37 DOM
-
2026-06-10days on market $100,000 Active 34 DOM
-
2026-06-09days on market $100,000 Active 33 DOM
-
2026-06-08days on market $100,000 Active 32 DOM
-
2026-06-07days on market $100,000 Active 31 DOM
-
2026-06-03days on market $100,000 Active 27 DOM
-
2026-06-02days on market $100,000 Active 26 DOM
-
2026-06-01days on market $100,000 Active 25 DOM
-
2026-05-31days on market $100,000 Active 24 DOM
-
2026-05-30days on market $100,000 Active 23 DOM
-
2026-05-08$100,000 Active 664-char remark
ⓘ Source: listings_history table (triggers on properties + properties_extension) + one-shot
backfill from property_details.listing_events for pre-trigger history.
Tax reassessment forecast TX · Resets to sale price
- Current annual tax
- $1,775 · $148/mo
- Projected year-2 tax
- $1,830 · $152/mo
- Expected delta
- +$55/yr (+$5/mo · 3.1%)
ⓘ Screening estimate from a state-policy table — verify with the county assessor before closing.
Climate risk First Street
- Flood 1/10 Low FEMA zone X (unshaded) · 0% chance over 30 yrs
- Wildfire 6/10 Major
- Heat 9/10 Extreme 7 d/yr ≥110°F today · 24 d/yr by 30 yrs out
- Wind 9/10 Extreme 99% chance of damaging wind over 30 yrs
- Air quality 2/10 Low 1 unhealthy d/yr today · 1 by 30 yrs out
Nearby sold comps map
Loading sold comps map…
Walkable amenities ~0.75 mi
Loading nearby amenities…
Taxation est. · year 1
- Rental income
- $15,670
- − Mortgage interest
- −$5,602
- − Property taxes
- −$1,775
- − Insurance
- −$500
- − Repairs & maintenance
- −$1,254
- − Management
- −$1,254
- − Depreciation
- −$2,909
- Taxable income
- $2,377
- Est. tax owed @ 24.0%
- −$570
- After-tax cash flow
- $3,241/yr
For passive investors: Depreciation is non-cash, so a rental often shows a tax loss while cash-flowing — sheltering income. Rental losses are passive: they offset passive income freely, and up to $25,000/yr can offset ordinary (W-2) income if you actively participate and your MAGI is under $100k (phasing out to $0 by $150k); unused losses carry forward. On sale, claimed depreciation is recaptured at up to 25%, and gains may owe capital-gains tax (a 1031 exchange can defer both). Figures are a year-1 estimate at your 24.0% rate — not tax advice; consult a CPA.
Schools (NCES district)
- District
- Vidor ISD
- NCES district ID
- 4844160
- Math proficiency
- 41% ▼ -6.00%
- Reading proficiency
- 39% ▲ 1.00%
- Median HH income
- $44,169
- Composite
- 33.95/100
- National rank
- #5331
- State rank
- #422 of 826 in TX
Livability — Vidor
- Score
- 67/100
- State rank
- #576
- US rank
- #11001
Category grades
Schools grade is shown separately in the Schools card above.
Census & demographics
- Census place
- Vidor, TX
- County
- Orange County · 87,112 people
- City population
- 25,041
- Metro
- Beaumont-Port Arthur, TX
- Population (ZIP)
- 25,041
- Household income
- $72,243
- Rent vs Own
- Severe rent burden
- 401.0
Population outlook (Orange County) Hauer SSP2
- Today (2025)
- 88,065 people
- By 2030
- 89,591 · +1.7%
- By 2040
- 91,982 · +4.4%
- By 2050
- 93,023 · +5.6%
- By 2075
- 94,871 · +7.7%
- By 2100
- 88,155 · +0.1%
Race, ethnicity, and origin ACS 2023
- Neighborhood character
- Predominantly White (88%)
- Race & ethnicity
- White 88% Hispanic / Latino 6% Two or more races 6%
- Hispanic origin (detail)
- Mexican 5%
- Common ancestry
- Lithuanian 15% Slovak 1% Italian 1%
- Foreign-born
- 3% · Canada
- Languages at home
- 93% English-only · Spanish 4% Other Indo-European 1% Other Asian/Pacific 1%
Political lean MEDSL · Orange
- 2024 margin
- Solid R (+66.8) · D 16.4% · R 83.1%
- 2008→2024 swing
- -19.6pp toward R · 2008: -47.1pp · 2024: -66.8pp
- All cycles
- 2024: R+66.8 2020: R+63.4 2016: R+61.9 2012: R+54.3 2008: R+47.1
Not yet ingested
- Civics
- —
Market trends
- HPI YoY
- ▼ -116.46%
- Current HPI
- 141.0844
- Rent YoY
- —
- Metro
- Beaumont-Port Arthur, TX
- State GDP YoY
- ▲ 3.95%
- F500 in state
- 110
Industry mix (Fortune 500 HQ in TX)
| Industry | F500 HQs | Revenue |
|---|---|---|
| Energy | 16 | $1,198B |
|
||
| Technology | 5 | $198B |
|
||
| Engineering / Construction | 4 | $72B |
|
||
| Energy Services | 3 | $60B |
|
||
| Utilities | 3 | $41B |
|
||
| Healthcare | 2 | $330B |
|
||
Price history
1 event — show timeline
- 2026-05-08 Listed $100,000 BBOR
Property tax history
+5.6%/yrLatest (2025): $1,775 · +11.9% YoY. Source: county tax records.
Cash-flow waterfall
monthlySold comps — $/sqft
last 12 mo · ≤1 miLoading sold comps…