3715 Rawley St · Houston, TX
Flood risk 6/10 · Moderate
- FEMA flood zone
- X (unshaded)
- Chance of flooding over 30 yrs
- 0.68%
- Est. flood insurance / yr
- $507 – $1,088
Fire risk 1/10 · Minimal
- Est. fire insurance / yr
- $1,222 – $2,270
Heat risk 9/10 · Severe
- Hot days now (above 109°F)
- 7 days/yr
- Hot days in 30 yrs
- 24 days/yr
Wind risk 9/10 · Severe
- Chance of severe wind over 30 yrs
- 99.0%
Air-quality risk 3/10 · Minor
- Unhealthy air days now
- 2 days/yr
- Unhealthy air days in 30 yrs
- 3 days/yr
Risk factors via First Street. Map © Google.
Why this score? — see what drove the D grade
The composite is a weighted blend of 9 inputs, each scored 0–100. Each bar is that input's sub-score; the figure is the points it added to the 100-point composite (weight × sub-score).
- Appreciation +10.0/10.0
- Cash flow +7.7/30.0
- ARV discount +6.8/15.0
- Livability +3.7/5.0
- Rent growth +3.6/5.0
- 1% rule +2.8/10.0
- Schools +2.7/10.0
- Condition / age +2.5/5.0
- DSCR +1.8/10.0
$285,000
🖨 Deal sheet 📄 Offer letter ✓ Due diligence
Listing remarks MLS
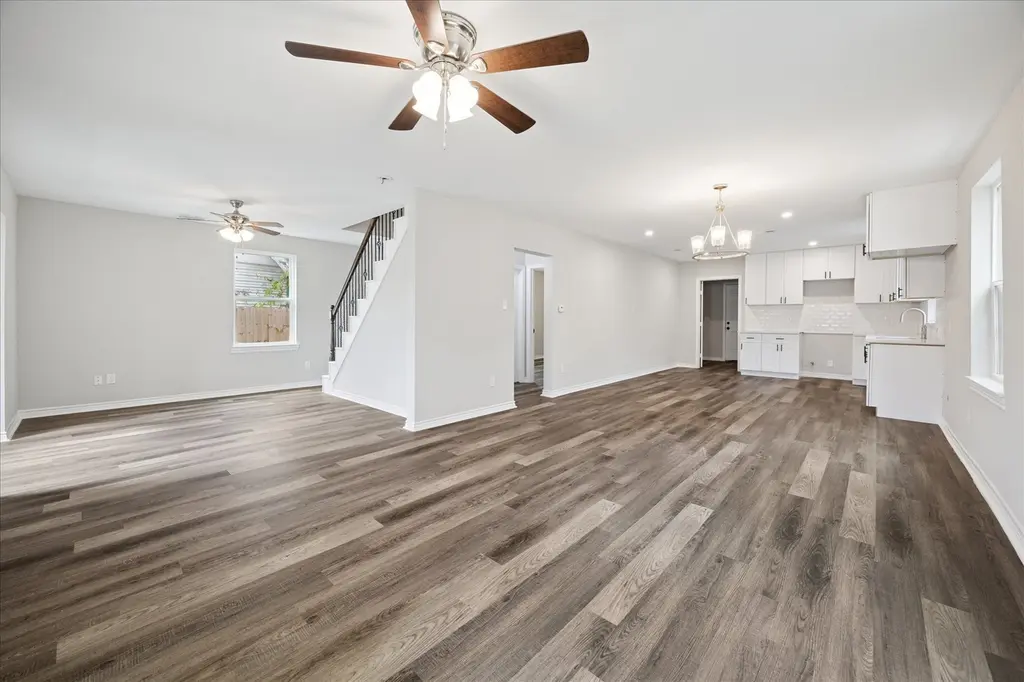
Rare opportunity to purchase a beautifully updated home on a prime interior lot for a great price. Updates include new roof(2020), soft close cabinets, Calcutta Quartz countertops in the kitchen and bathrooms, luxury vinyl plank floors on first floor, and fixtures throughout. Hurry, this area is rapidly appreciating with newer construction in the area. Hurry, priced to sell!
Key facts
- Prime interior lot
- Soft close cabinets
- Updated home
Tags
Neighborhood map
What this means for you Summary
Snapshot
- This is a 3-bed/1.5-bath single-family listed at $285k.
Deal economics
- At list price, monthly cash flow is $-323 ($-4k/yr) — negative.
- To cash-flow at today's rent, offer at most $228k (20.0% below list).
- To meet the 1% rule (rent ≥ 1% of price), the offer needs to be $223k (21.8% below list).
- Recommended offer: $223k (21.8% below list) — sets the bar for 1% rule.
- Cap rate 4.9% vs local median 3.2% in Houston — top-decile yield for the area; either an underpriced asset or a hidden risk that comps aren't pricing in. Stress-test before assuming the spread holds.
Location & tenants
- Location reads 74/100 on livability (#184 in TX, #4,771 nationally) — a middle-class / working-renter tenant base. Strengths: amenities A+, cost of living A+, housing A+; Watch: schools D, crime F.
- Houston ISD (urban): math 27% / reading 35% proficiency, ranked #593 of 826 in TX (top 72%) — families likely to look elsewhere, expect single-tenant / working-renter base with shorter leases; 71% free/reduced lunch — lower-income household profile, screen leases tightly.
- Market conditions: Rents rising fast (+4.3%/yr); 337 active listings in the ZIP; 32 comparable units currently listed for rent nearby; rentals lingering (median 44d on market — plan ~5-8 weeks vacancy on turnover, expect pricing pressure); 50% of comp listings sitting > 30 days — soft ceiling on asking rent; 29,883 units permitted in Harris County in 2024 (8,621 in 5+ unit buildings).
- At $2,230/mo this rent would consume 53% of the median local household income ($50k/yr) (locally 969% of renters already pay >50% of income on rent) — very limited rent-growth headroom before tenants either downsize or default.
Forward outlook
- In year one you build about $30k of equity ($2k loan paydown + $28k appreciation (10.0% local appreciation)).
- Harris County population projected at +47% by 2050 — long-run rental-demand tailwind backs the buy-and-hold thesis.
- By year 2, paydown + projected appreciation supports a ~$49k cash-out refi (75% LTV) — recoverable capital for the next deal without selling this one.
Negotiation context
- It's been on market 194 days — a 12% lower offer ($251k) is reasonable based on typical stale-listing flexibility.
Risks & watch-outs
- Watch-outs: built in 1931 — expect roof / HVAC / electrical / plumbing capex.
- Climate carrying-cost: major flood risk; severe wind risk, 99% chance of damaging wind over 30y; extreme-heat days projected 7→24/yr by 2055 (HVAC capex compounding) — expect insurance premiums to compound above CPI over the hold.
Questions for the listing agent
- What do current leases actually rent for vs. the listed asking? Can we see a recent rent roll and the last 12 months of T-12 income?
- It's been on market 194 days. Have you received any prior offers? Is the seller open to a 22% concession, seller financing, or rate buy-down credit?
- Built in 1931 — when were the roof, HVAC, electrical panel, plumbing, and water heater last replaced?
- Why hasn't it sold? Are there any deal-killer items the seller is aware of (foundation, flood, title, zoning, code violations)?
- Is there a deadline driving the sale (1031 exchange, divorce, estate, relocation)? That informs how much negotiation room exists.
- Schools are D-rated, which usually means shorter tenancies and higher turnover. Who's the typical renter profile here, and what's been the actual vacancy rate?
- Crime grade is F in this area — have there been break-ins, vandalism, or insurance claims at this property in the last 3 years? What carrier currently insures it and at what premium?
- The area grade is low — what's the realistic commute time and amenity access for the typical tenant pool here? Any planned neighborhood developments (good or bad) we should know about?
- What's the average days-on-market for RENTAL listings here right now (not sales)? A rising rental-DOM trend means longer vacancies and softer asking-rent achievability than the comps imply.
- What's the recent tenant-quality profile in this submarket — average credit score on applications, eviction rate, late-payment / NSF rate, and stable-employment percentage? A property-management company in the area should have these aggregated.
- How much new for-sale + rental construction is in the pipeline within 1–3 miles? Heavy new supply typically softens prices + rents 12–24 months out; constrained supply supports both.
Investment metrics
- 1% rule
- 0.78% ✗
- Cap rate
- 4.93%
- Cash-on-cash
- -4.86%
- DSCR
- 0.78
- GRM
- 10.7
CMA / ARV
- ARV (median comp)
- $280,342
- List price
- $285,000
- Delta
- 1.66%
- Verdict
- FAIR
- Comps
- 20 within 1.0 mi
Show comp detail 12 sales within ~0.75 mi
| Address | Dist | Beds/Ba | Sqft | Sold | Price | $/sf | Match |
|---|---|---|---|---|---|---|---|
| 1811 Pannell St Unit C | 0.05mi | 2/2.0 (-1) | 1,381 (-9%) | 7mo | $275,000 | $199 | 70 |
| 2004 Worms St | 0.11mi | 2/2.0 (-1) | 1,344 (-12%) | 1mo | $259,000 | $193 | 67 |
| 3616 Market St | 0.46mi | 3/3.0 | 1,607 (+6%) | 2mo | $325,000 | $202 | 61 |
| 2710 Jensen Creek Ln | 0.72mi | 3/2.5 | 1,508 (-1%) | 0mo | $299,900 | $199 | 61 |
| 3109 Stonewall St | 0.50mi | 3/2.5 | 1,645 (+8%) | 3mo | $349,900 | $213 | 56 |
| 2413 Brewster St | 0.47mi | 4/2.0 (+1) | 1,431 (-6%) | 10mo | $100,000 | $70 | 53 |
| 3109 Orange St | 0.46mi | 3/2.5 | 1,645 (+8%) | 9mo | $349,900 | $213 | 53 |
| 2214 Brackenridge St | 0.55mi | 3/2.0 | 1,387 (-9%) | 9mo | $205,000 | $148 | 50 |
| 3202 Quitman St | 0.42mi | 3/3.5 | 1,700 (+12%) | 3mo | $355,000 | $209 | 50 |
| 4809 Nichols St | 0.69mi | 3/2.5 | 1,581 (+4%) | 9mo | $285,000 | $180 | 49 |
| 2302 Wipprecht St | 0.67mi | 3/2.5 | 1,636 (+8%) | 6mo | $299,000 | $183 | 47 |
| 2207 Dan St | 0.47mi | 3/2.5 | 1,736 (+14%) | 5mo | $339,000 | $195 | 46 |
Match score weights: distance 35% · size 25% · config 20% · recency 20%. Top-matched comps best support the ARV.
Projected returns pro-forma
10.0% appreciation · 4.27% rent growth · sell at horizon
- IRR
- 21.2%
- Equity multiple
- 2.72×
- Total profit
- $137,612
- Equity at exit
- $256,751
- IRR
- 19.5%
- Equity multiple
- 6.36×
- Total profit
- $427,816
- Equity at exit
- $553,692
Cash invested: $79,800 (down + closing). Projections, not guarantees.
Landlord ↔ Tenant lean methodology
- Overall (STATE)
- 87 Strongly Landlord-Friendly
- State Texas
- 87 Strongly Landlord-Friendly · R+5
- County
- — inherits STATE
- City
- — inherits STATE
ZIP-level market 77020
- Home prices YoY
- 29.1%
- Rents YoY
- 4.3%
- Active inventory
- 337
- Price-to-rent
- 10.7×
Monthly cashflow live
- Estimated rent
- $2,230 high interval (Pro) →
- Mortgage (P&I)
- −$1,495
- Tax from tax record
- −$472 /mo · $5,660/yr
- Insurance
- −$119
- HOA
- −$0
- Vacancy / Maint / Mgmt
- −$468
- Net cashflow
- $-323
Break-even live
UW: 25.0% down · 7.5% · 30yr · 1.5% tax · 5.0% vac · 8.0% maint · 8.0% mgmt
Financing live
Cash to close
- Down payment
- $71,250
- Closing costs
- $8,550
- Reserves months
- —
- Total cash needed
- —
Loan-product check · same deal, 3 products live
Conventional
25% down · 7.5% · 30yr
- Down + closing
- —
- Monthly P&I
- —
- Monthly cashflow
- —
- DSCR
- —
- Eligible?
- —
Personal DTI + credit; lowest rate.
DSCR
20% down · 8.5% · 30yr
- Down + closing
- —
- Monthly P&I
- —
- Monthly cashflow
- —
- DSCR
- —
- Eligible?
- —
No personal income docs; deal must DSCR.
Hard money
10% down · 12.0% · 12mo
- Down + closing
- —
- Monthly P&I
- —
- Monthly cashflow
- —
- DSCR
- —
- Eligible?
- —
Short-term bridge; refi at stabilization.
Rent comps 32 comps
| Address | Beds | Baths | Sqft | Rent | $/sqft | DOM | Units | Dist |
|---|---|---|---|---|---|---|---|---|
| 3730 Lyons Ave Unit 216 Houston, TX | 3.0 | 2.0 | 1107 | $1,300 | $1.17 | 43d | 1 | 0.23mi |
| 1513 Cage St Houston, TX | 3.0 | 2.0 | 1467 | $1,550 | $1.06 | 43d | 1 | 0.32mi |
| 3300 Lyons Ave Unit 304 Houston, TX | 4.0 | 2.0 | 1393 | $1,460 | $1.05 | 43d | 1 | 0.34mi |
| 4300 Lyons Ave Unit 304 Houston, TX | 4.0 | 2.0 | 1393 | $1,460 | $1.05 | 43d | 1 | 0.42mi |
| 1307 Bayou St Unit B Houston, TX | 3.0 | 3.0 | 1814 | $2,400 | $1.32 | 7d | 1 | 0.52mi |
| 1303 Bayou St Unit C Houston, TX | 3.0 | 3.0 | 1869 | $3,200 | $1.71 | 43d | 1 | 0.52mi |
| 4712 Rawley St Unit a Houston, TX | 3.0 | 2.0 | 1501 | $2,070 | $1.38 | 20d | 1 | 0.65mi |
| 4712 Rawley St Unit B Houston, TX | 3.0 | 2.5 | 1501 | $2,045 | $1.36 | 20d | 1 | 0.65mi |
| 1222 Upton St Houston, TX | 3.0 | 4.0 | 2055 | $2,600 | $1.27 | 43d | 1 | 0.67mi |
| 4109 Hare St Unit A Houston, TX | 4.0 | 2.5 | 1913 | $6,950 | $3.63 | 43d | 1 | 0.68mi |
| 4109 Hare St Unit 1019559P Houston, TX | 4.0 | 2.5 | 1905 | $6,852 | $3.60 | 7d | 1 | 0.68mi |
| 4509 Courtney St Houston, TX | 4.0 | 1.0 | 1456 | $1,150 | $0.79 | 21d | 1 | 0.76mi |
| 3410 Baer St Houston, TX | 3.0 | 4.0 | 2040 | $3,500 | $1.72 | 43d | 1 | 0.78mi |
| 3419 Gillespie St Houston, TX | 3.0 | 3.5 | 2168 | $2,300 | $1.06 | 43d | 1 | 0.80mi |
| 1714 Mary St Houston, TX | 2.0 | 2.0 | 1100 | $2,400 | $2.18 | 43d | 1 | 0.82mi |
| 611 Sydnor St Houston, TX | 3.0 | 4.0 | 2157 | $2,400 | $1.11 | 43d | 1 | 0.85mi |
| 2905 Baer St Unit 1047953P Houston, TX | 3.0 | 2.5 | 1991 | $3,094 | $1.55 | 5d | 1 | 0.87mi |
| 5217 Noble St Houston, TX | 3.0 | 2.5 | 1897 | $2,750 | $1.45 | 43d | 1 | 0.92mi |
| 308 Grove St Houston, TX | 3.0 | 3.0 | 1701 | $2,350 | $1.38 | 7d | 1 | 0.93mi |
| 5605 Mulvey St Unit 1019610P Houston, TX | 3.0 | 2.5 | 1410 | $4,237 | $3.00 | 2d | 1 | 1.12mi |
| 2105 Sam Wilson St Houston, TX | 3.0 | 2.5 | 1416 | $6,750 | $4.77 | 43d | 1 | 1.12mi |
| 3503 Wyrick St Houston, TX | 3.0 | 2.5 | 1746 | $2,850 | $1.63 | 43d | 1 | 1.22mi |
| 1550 Leona St Houston, TX | 1.0–2.0 | 1.0–2.0 | 835 | $1,905 | $2.28 | 1d | 19 | 1.23mi |
| 1550 Leona St Unit 1587 Houston, TX | 2.0 | 2.0 | 1131 | $1,942 | $1.72 | 43d | 1 | 1.28mi |
| 800 Middle St Houston, TX | 1.0–4.0 | 1.0–2.0 | 1003 | $1,593 | $1.59 | 5d | 1 | 1.30mi |
| 91 Jensen Dr Houston, TX | 3.0 | 1.0–2.5 | 970 | $3,420 | $3.52 | 1d | 69 | 1.31mi |
| 91 Jensen Dr Houston, TX | 2.0 | 1.0–2.0 | 872 | $3,094 | $3.55 | 20d | 16 | 1.31mi |
| 1250 Leona St Houston, TX | 2.0 | 1.0–2.0 | 885 | $1,990 | $2.25 | 1d | 16 | 1.37mi |
| 650 McKee St Unit 3112 Houston, TX | 3.0 | 2.0 | 1136 | $2,082 | $1.83 | 2d | 1 | 1.41mi |
| 650 McKee St Unit 3174 Houston, TX | 3.0 | 2.0 | 1136 | $2,114 | $1.86 | 10d | 1 | 1.41mi |
| 650 McKee St Unit 683 Houston, TX | 3.0 | 2.0 | 1136 | $2,125 | $1.87 | 43d | 1 | 1.41mi |
| 2706 Cochran St Houston, TX | 3.0 | 3.5 | 1791 | $2,700 | $1.51 | 19d | 1 | 1.46mi |
Listing history 16 events
-
2026-06-18days on market $285,000 Active 194 DOM
-
2026-06-17days on market $285,000 Active 193 DOM
-
2026-06-16days on market $285,000 Active 192 DOM
-
2026-06-15days on market $285,000 Active 191 DOM
-
2026-06-13days on market $285,000 Active 189 DOM
-
2026-06-10days on market $285,000 Active 185 DOM
-
2026-06-08days on market $285,000 Active 184 DOM
-
2026-06-07days on market $285,000 Active 183 DOM
-
2026-06-04days on market $285,000 Active 180 DOM
-
2026-06-01days on market $285,000 Active 177 DOM
-
2026-05-31days on market $285,000 Active 176 DOM
-
2025-12-15price $285,000 377-char remark
Show marketing remark (377 chars)
Rare opportunity to purchase a beautifully updated home on a prime interior lot for a great price. Updates include new roof(2020), soft close cabinets, Calcutta Quartz countertops in the kitchen and bathrooms, luxury vinyl plank floors on first floor, and fixtures throughout. Hurry, this area is rapidly appreciating with newer construction in the area. Hurry, priced to sell!
-
2025-12-06$299,000 Active 377-char remark
Show marketing remark (377 chars)
Rare opportunity to purchase a beautifully updated home on a prime interior lot for a great price. Updates include new roof(2020), soft close cabinets, Calcutta Quartz countertops in the kitchen and bathrooms, luxury vinyl plank floors on first floor, and fixtures throughout. Hurry, this area is rapidly appreciating with newer construction in the area. Hurry, priced to sell!
-
2016-02-29soldstatus
-
2014-07-03soldstatus
-
1994-02-03soldstatus
ⓘ Source: listings_history table (triggers on properties + properties_extension) + one-shot
backfill from property_details.listing_events for pre-trigger history.
Tax reassessment forecast TX · Resets to sale price
- Current annual tax
- $5,660 · $472/mo
- Projected year-2 tax
- $5,660 · $472/mo
- Expected delta
- $0/yr ($0/mo · 0.0%)
ⓘ Screening estimate from a state-policy table — verify with the county assessor before closing.
Climate risk First Street
- Flood 6/10 Major FEMA zone X (unshaded) · 68% chance over 30 yrs
- Wildfire 1/10 Low
- Heat 9/10 Extreme 7 d/yr ≥109°F today · 24 d/yr by 30 yrs out
- Wind 9/10 Extreme 99% chance of damaging wind over 30 yrs
- Air quality 3/10 Moderate 2 unhealthy d/yr today · 3 by 30 yrs out
Nearby sold comps map
Loading sold comps map…
Walkable amenities ~0.75 mi
Loading nearby amenities…
Taxation est. · year 1
- Rental income
- $26,759
- − Mortgage interest
- −$15,964
- − Property taxes
- −$5,660
- − Insurance
- −$1,425
- − Repairs & maintenance
- −$2,141
- − Management
- −$2,141
- − Depreciation
- −$8,291
- Taxable loss
- −$8,863
- Est. tax savings @ 24.0%
- +$2,127
- After-tax cash flow
- $-1,753/yr
For passive investors: Depreciation is non-cash, so a rental often shows a tax loss while cash-flowing — sheltering income. Rental losses are passive: they offset passive income freely, and up to $25,000/yr can offset ordinary (W-2) income if you actively participate and your MAGI is under $100k (phasing out to $0 by $150k); unused losses carry forward. On sale, claimed depreciation is recaptured at up to 25%, and gains may owe capital-gains tax (a 1031 exchange can defer both). Figures are a year-1 estimate at your 24.0% rate — not tax advice; consult a CPA.
Schools (NCES district)
- District
- Houston ISD
- NCES district ID
- 4823640
- Math proficiency
- 27% ▼ -18.00%
- Reading proficiency
- 35% ▼ -6.00%
- Median HH income
- $46,054
- Composite
- 26.63/100
- National rank
- #7173
- State rank
- #593 of 826 in TX
Livability — Houston
- Score
- 74/100
- State rank
- #184
- US rank
- #4771
Category grades
Schools grade is shown separately in the Schools card above.
Census & demographics
- Census place
- Houston, TX
- County
- Harris County · 4,702,590 people
- City population
- 3,226,434
- Metro
- Houston-The Woodlands-Sugar Land, TX
- Population (ZIP)
- 23,686
- Household income
- $50,119
- Rent vs Own
- Severe rent burden
- 969.0
Population outlook (Harris County) Hauer SSP2
- Today (2025)
- 5,571,493 people
- By 2030
- 6,089,821 · +9.3%
- By 2040
- 7,142,806 · +28.2%
- By 2050
- 8,185,864 · +46.9%
- By 2075
- 10,574,329 · +89.8%
- By 2100
- 12,109,958 · +117.4%
Race, ethnicity, and origin ACS 2023
- Neighborhood character
- Predominantly Hispanic (69%)
- Race & ethnicity
- Hispanic / Latino 69% Black 24% Two or more races 22% White 5% Asian 1%
- Hispanic origin (detail)
- Mexican 60%
- Common ancestry
- Swiss 1%
- Foreign-born
- 23% · Canada
- Languages at home
- 39% English-only · Spanish 59% Other Indo-European 1%
Political lean MEDSL · Harris
- 2024 margin
- Lean D (+5.5) · D 52.0% · R 46.4% · Other 1.6%
- 2008→2024 swing
- +3.9pp toward D · 2008: 1.6pp · 2024: 5.5pp
- All cycles
- 2024: D+5.5 2020: D+13.3 2016: D+12.4 2012: D+0.1 2008: D+1.6
Not yet ingested
- Civics
- —
Market trends
- HPI YoY
- ▲ 55.64%
- Current HPI
- 246.5578
- Rent YoY
- ▲ 4.27%
- Metro
- Houston-The Woodlands-Sugar Land, TX
- State GDP YoY
- ▲ 3.95%
- F500 in state
- 110
Industry mix (Fortune 500 HQ in TX)
| Industry | F500 HQs | Revenue |
|---|---|---|
| Energy | 16 | $1,198B |
|
||
| Technology | 5 | $198B |
|
||
| Engineering / Construction | 4 | $72B |
|
||
| Energy Services | 3 | $60B |
|
||
| Utilities | 3 | $41B |
|
||
| Healthcare | 2 | $330B |
|
||
Price history
-4.7% since first listed5 events — show timeline
- 2025-12-15 Price Changed $285,000 HARMLS
- 2025-12-06 Listed $299,000 HARMLS
- 2016-02-29 Sold (Public Records) — Public Records
- 2014-07-03 Sold (Public Records) — Public Records
- 1994-02-03 Sold (Public Records) — Public Records
Property tax history
+16.9%/yrLatest (2025): $5,660 · +1.6% YoY. Source: county tax records.
Cash-flow waterfall
monthlySold comps — $/sqft
last 12 mo · ≤1 miLoading sold comps…