 🔨 Auction
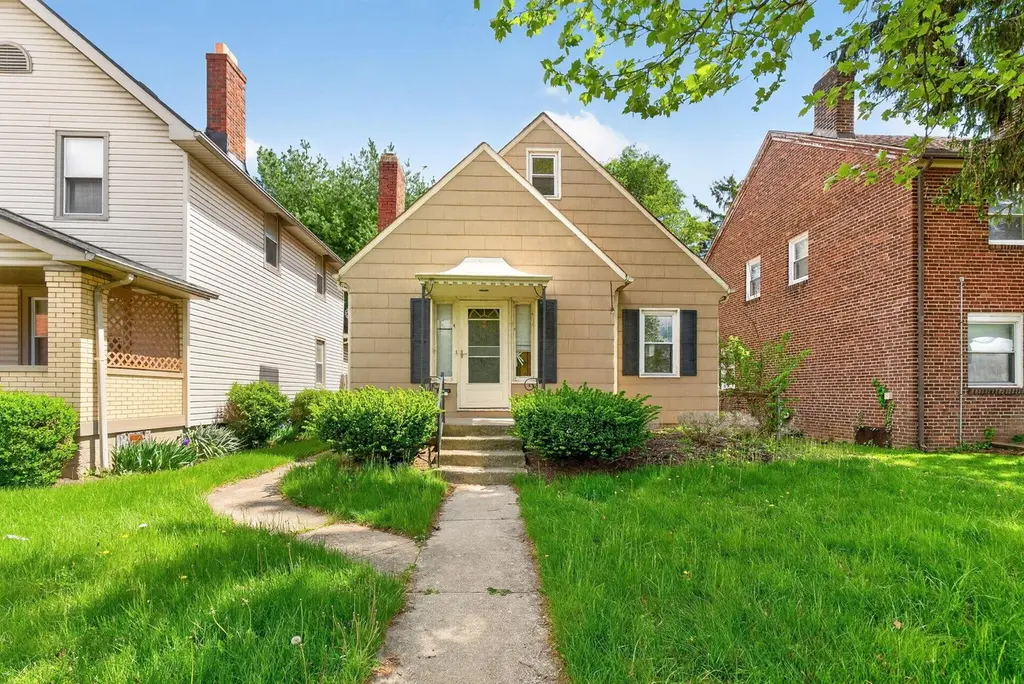
1352 S Ohio Ave · Columbus, OH
Flood risk 1/10 · Minimal
- FEMA flood zone
- X (unshaded)
- Chance of flooding over 30 yrs
- 0.0%
- Est. flood insurance / yr
- $473 – $860
Fire risk 1/10 · Minimal
- Est. fire insurance / yr
- $713 – $1,323
Heat risk 4/10 · Minor
- Hot days now (above 100°F)
- 7 days/yr
- Hot days in 30 yrs
- 18 days/yr
Wind risk 2/10 · Minimal
- Chance of severe wind over 30 yrs
- 1.0%
Air-quality risk 3/10 · Minor
- Unhealthy air days now
- 2 days/yr
- Unhealthy air days in 30 yrs
- 3 days/yr
Risk factors via First Street. Map © Google.
Why this score? — see what drove the F grade
The composite is a weighted blend of 9 inputs, each scored 0–100. Each bar is that input's sub-score; the figure is the points it added to the 100-point composite (weight × sub-score).
- Cash flow +8.1/30.0
- ARV discount +7.5/15.0
- Livability +4.0/5.0
- Rent growth +3.4/5.0
- Condition / age +2.5/5.0
- 1% rule +2.2/10.0
- DSCR +2.1/10.0
- Schools +1.7/10.0
- Appreciation +0.0/10.0
$75,000
🖨 Deal sheet 📄 Offer letter ✓ Due diligence
Listing remarks MLS
ONLINE AUCTION, the RESERVE (Minimum Bid) is $75,000. The auction ends at 7:00 PM, Thursday, May 21st, 2026. BUYERS MUST SIGN ACKNOWLEDGEMENT OF TERMS to bid. Agents, please see 'A2A'. This 3-bedroom, 1-bath home sits on approximately 0.12± acres. Built in 1938, the home offers approximately 1,523 square feet of living space. The property includes off-street parking located behind the home.
Key facts
- Off-street parking
- 5,227 sq ft lot
- Built 1938
Tags
Neighborhood map
What this means for you Summary
Snapshot
- This is a 3-bed/1.0-bath single-family listed at $75k.
Deal economics
- At list price, monthly cash flow is $-255 ($-3k/yr) — negative.
- The deal already cash-flows at list — no discount required.
- Meets the 1% rule at list price ($2k rent vs $75k).
- Recommended offer: $73k (3.0% below list) — sets the bar for market timing.
- Cap rate 5.1% vs local median 3.8% in Columbus — top-decile yield for the area; either an underpriced asset or a hidden risk that comps aren't pricing in. Stress-test before assuming the spread holds.
Location & tenants
- Location reads 81/100 on livability (#97 in OH, #1,491 nationally) — a professional / high-income tenant draw. Strengths: commute A+, cost of living A+, housing A+; Watch: employment C-, crime F.
- Columbus City School District (urban): math 15% / reading 26% proficiency, ranked #626 of 656 in OH (top 95%) — low school quality limits family demand, transient renter base, plan for 1-2y turnover; 72% free/reduced lunch — lower-income household profile, screen leases tightly.
- Market conditions: Rents rising (+3.5%/yr); 193 active listings in the ZIP; 40 comparable units currently listed for rent nearby; rentals at typical pace (median 24d on market — plan ~3-4 weeks tenant-placement turnaround); 48% of comp listings sitting > 30 days — soft ceiling on asking rent; solid renter incomes; 8,139 units permitted in Franklin County in 2024 (5,940 in 5+ unit buildings).
Forward outlook
- Local home prices are declining (-3.0%/yr); year-one equity from $2k of loan paydown is wiped out by about $8k of value loss. Plan a longer hold.
- Franklin County population projected at +34% by 2050 — long-run rental-demand tailwind backs the buy-and-hold thesis.
Negotiation context
- It's been on market 31 days — a 3% lower offer ($73k) is reasonable based on typical stale-listing flexibility.
- 5 sale attempts since 22y ago with the ask held roughly flat each time — persistent listings suggest the price (not the market) is what's stuck; bring a comps-based counter.
- Current owner paid $11k; list at $75k implies a 582% gain — meaningful room to come down on a strong offer.
Risks & watch-outs
- Watch-outs: property tax is 4.3% of price; built in 1938 — expect roof / HVAC / electrical / plumbing capex.
Questions for the listing agent
- What do current leases actually rent for vs. the listed asking? Can we see a recent rent roll and the last 12 months of T-12 income?
- It's been on market 31 days. Have you received any prior offers? Is the seller open to a 3% concession, seller financing, or rate buy-down credit?
- Built in 1938 — when were the roof, HVAC, electrical panel, plumbing, and water heater last replaced?
- Property tax is high relative to price — has the assessment been appealed recently, and will the sale trigger a re-assessment?
- Is there a deadline driving the sale (1031 exchange, divorce, estate, relocation)? That informs how much negotiation room exists.
- Crime grade is F in this area — have there been break-ins, vandalism, or insurance claims at this property in the last 3 years? What carrier currently insures it and at what premium?
- The area grade is low — what's the realistic commute time and amenity access for the typical tenant pool here? Any planned neighborhood developments (good or bad) we should know about?
- What's the average days-on-market for RENTAL listings here right now (not sales)? A rising rental-DOM trend means longer vacancies and softer asking-rent achievability than the comps imply.
- What's the recent tenant-quality profile in this submarket — average credit score on applications, eviction rate, late-payment / NSF rate, and stable-employment percentage? A property-management company in the area should have these aggregated.
- How much new for-sale + rental construction is in the pipeline within 1–3 miles? Heavy new supply typically softens prices + rents 12–24 months out; constrained supply supports both.
Investment metrics
- 1% rule
- 0.72% ✗
- Cap rate
- 5.10%
- Cash-on-cash
- -4.25%
- DSCR
- 0.81
- GRM
- 11.5
CMA / ARV
- ARV (median comp)
- $256,603
- List price
- $75,000
- Delta
- -70.77%
- Verdict
- UNDERPRICED
- Comps
- 20 within 1.0 mi
Show comp detail 12 sales within ~0.75 mi
| Address | Dist | Beds/Ba | Sqft | Sold | Price | $/sf | Match |
|---|---|---|---|---|---|---|---|
| 1343 Linwood Ave | 0.28mi | 3/1.5 | 1,520 (-0%) | 0mo | $315,000 | $207 | 84 |
| 1129 Oakwood Ave | 0.37mi | 3/2.5 | 1,540 (+1%) | 2mo | $327,500 | $213 | 74 |
| 760 Siebert St | 0.40mi | 3/1.0 | 1,596 (+5%) | 2mo | $178,900 | $112 | 72 |
| 605 Frebis Ave | 0.43mi | 3/2.5 | 1,459 (-4%) | 1mo | $345,000 | $236 | 66 |
| 601 Frebis Ave | 0.43mi | 3/2.5 | 1,459 (-4%) | 2mo | $349,000 | $239 | 66 |
| 792 Thurman Ave | 0.18mi | 3/1.5 | 1,307 (-14%) | 1mo | $280,000 | $214 | 65 |
| 1005 Studer Ave | 0.67mi | 3/2.5 | 1,544 (+1%) | 2mo | $272,900 | $177 | 59 |
| 1742 Oakwood Ave | 0.55mi | 4/2.0 (+1) | 1,659 (+9%) | 1mo | $255,000 | $154 | 49 |
| 1532 Parsons Ave | 0.71mi | 2/1.5 (-1) | 1,402 (-8%) | 1mo | $185,500 | $132 | 46 |
| 674 Stanley Ave | 0.65mi | 3/1.5 | 1,315 (-14%) | 2mo | $324,900 | $247 | 44 |
| 1079 Ellsworth Ave | 0.75mi | 4/1.0 (+1) | 1,336 (-12%) | 1mo | $82,500 | $62 | 39 |
| 935 S Ohio Ave | 0.60mi | 4/2.5 (+1) | 1,735 (+14%) | 1mo | $330,000 | $190 | 37 |
Match score weights: distance 35% · size 25% · config 20% · recency 20%. Top-matched comps best support the ARV.
Projected returns pro-forma
-3.0% appreciation · 3.51% rent growth · sell at horizon
- IRR
- -22.9%
- Equity multiple
- 0.21×
- Total profit
- $-56,848
- Equity at exit
- $38,260
- IRR
- -16.2%
- Equity multiple
- 0.08×
- Total profit
- $-66,425
- Equity at exit
- $22,186
Cash invested: $71,849 (down + closing). Projections, not guarantees.
Landlord ↔ Tenant lean methodology
- Overall (STATE)
- 73 Landlord-Friendly
- State Ohio
- 73 Landlord-Friendly · R+6
- County
- — inherits STATE
- City
- — inherits STATE
ZIP-level market 43206
- Rents YoY
- 3.5%
- Active inventory
- 193
- Price-to-rent
- 3.4×
Monthly cashflow live
- Estimated rent
- $1,860 high interval (Pro) →
- Mortgage (P&I)
- −$1,346
- Tax from tax record
- −$271 /mo · $3,256/yr
- Insurance
- −$107
- HOA
- −$0
- Vacancy / Maint / Mgmt
- −$391
- Net cashflow
- $-255
Break-even live
UW: 25.0% down · 7.5% · 30yr · 1.5% tax · 5.0% vac · 8.0% maint · 8.0% mgmt
Financing live
Cash to close
- Down payment
- $64,151
- Closing costs
- $7,698
- Reserves months
- —
- Total cash needed
- —
Loan-product check · same deal, 3 products live
Conventional
25% down · 7.5% · 30yr
- Down + closing
- —
- Monthly P&I
- —
- Monthly cashflow
- —
- DSCR
- —
- Eligible?
- —
Personal DTI + credit; lowest rate.
DSCR
20% down · 8.5% · 30yr
- Down + closing
- —
- Monthly P&I
- —
- Monthly cashflow
- —
- DSCR
- —
- Eligible?
- —
No personal income docs; deal must DSCR.
Hard money
10% down · 12.0% · 12mo
- Down + closing
- —
- Monthly P&I
- —
- Monthly cashflow
- —
- DSCR
- —
- Eligible?
- —
Short-term bridge; refi at stabilization.
Rent comps 40 comps
| Address | Beds | Baths | Sqft | Rent | $/sqft | DOM | Units | Dist |
|---|---|---|---|---|---|---|---|---|
| 1416 S Ohio Ave Columbus, OH | 3.0 | 1.5 | 1056 | $1,595 | $1.51 | 21d | 1 | 0.09mi |
| 1239-1241 S Champion Ave Columbus, OH | 3.0 | 1.0 | 1134 | $1,275 | $1.12 | 15d | 1 | 0.19mi |
| 1227 S Champion Ave Unit 1227 Columbus, OH | 3.0 | 1.0 | 1110 | $1,195 | $1.08 | 3d | 1 | 0.21mi |
| 1225 S Champion Ave Unit 1225 Columbus, OH | 3.0 | 1.0 | 1110 | $1,095 | $0.99 | 3d | 1 | 0.21mi |
| 1288 Linwood Ave Columbus, OH | 3.0 | 1.0 | 1344 | $1,900 | $1.41 | 43d | 1 | 0.34mi |
| 1118 S Ohio Ave Columbus, OH | 3.0 | 1.5 | 1232 | $1,750 | $1.42 | 43d | 1 | 0.36mi |
| 761 Siebert St Columbus, OH | 2.0 | 2.0 | 1050 | $2,350 | $2.24 | 3d | 1 | 0.40mi |
| 573 E Mithoff St Columbus, OH | 3.0 | 1.5 | 1300 | $2,100 | $1.62 | 43d | 1 | 0.45mi |
| 662 Southwood Ave Columbus, OH | 3.0 | 2.0 | 1183 | $1,950 | $1.65 | 19d | 1 | 0.46mi |
| 880 E Whittier St Columbus, OH | 2.0 | 1.5 | 1064 | $1,100 | $1.03 | 43d | 1 | 0.47mi |
| 850 E Whittier St Columbus, OH | 3.0 | 2.0 | 1200 | $1,949 | $1.62 | 23d | 1 | 0.49mi |
| 530 Hanford St Unit 1496117P Columbus, OH | 4.0 | 3.0 | 1862 | $7,310 | $3.93 | 1d | 1 | 0.49mi |
| 1056 Wilson Ave Unit A Columbus, OH | 2.0 | 1.0 | 1100 | $1,225 | $1.11 | 43d | 1 | 0.53mi |
| 1056 Wilson Ave Unit B Columbus, OH | 2.0 | 1.0 | 1100 | $1,195 | $1.09 | 17d | 1 | 0.53mi |
| 1165-1167 E Whittier St Columbus, OH | 3.0 | 1.5 | 1300 | $1,950 | $1.50 | 43d | 1 | 0.55mi |
| 1167 E Whittier St Columbus, OH | 3.0 | 1.5 | 1300 | $1,950 | $1.50 | 43d | 1 | 0.55mi |
| 977 S Ohio Ave Columbus, OH | 3.0 | 2.5 | 1650 | $2,500 | $1.52 | 43d | 1 | 0.55mi |
| 997 Oakwood Ave Columbus, OH | 3.0 | 1.5 | 1260 | $1,800 | $1.43 | 12d | 1 | 0.56mi |
| 963 S 22nd St Columbus, OH | 3.0 | 2.0 | 1188 | $3,200 | $2.69 | 7d | 1 | 0.56mi |
| 506 Thurman Ave Columbus, OH | 3.0 | 1.0 | 1500 | $1,600 | $1.07 | 1d | 1 | 0.57mi |
| 966 S 18th St Columbus, OH | 3.0 | 1.5 | 1428 | $2,400 | $1.68 | 43d | 1 | 0.60mi |
| 936 Wagner St Columbus, OH | 3.0 | 3.0 | 1560 | $2,750 | $1.76 | 23d | 1 | 0.60mi |
| 490-492 E Jenkins Ave Unit 490 Columbus, OH | 3.0 | 1.0 | 1050 | $1,325 | $1.26 | 43d | 1 | 0.63mi |
| 928 S 18th St Columbus, OH | 3.0 | 2.0 | 1216 | $1,995 | $1.64 | 43d | 1 | 0.65mi |
| 476 Southwood Ave Columbus, OH | 2.0 | 1.0 | 1219 | $1,400 | $1.15 | 43d | 1 | 0.67mi |
| 988 Linwood Ave Columbus, OH | 4.0 | 3.0 | 1800 | $2,750 | $1.53 | 17d | 1 | 0.67mi |
| 1061 Parsons Ave Columbus, OH | 2.0 | 2.0 | 1408 | $1,950 | $1.38 | 43d | 1 | 0.69mi |
| 630 Stanley Ave Columbus, OH | 3.0 | 1.0 | 1300 | $1,949 | $1.50 | 23d | 1 | 0.70mi |
| 877 Heyl Ave Columbus, OH | 2.0 | 1.0 | 1200 | $1,750 | $1.46 | 43d | 1 | 0.71mi |
| 396 E Mithoff St Columbus, OH | 3.0 | 1.5 | 1380 | $2,295 | $1.66 | 10d | 1 | 0.71mi |
| 1836 Lockbourne Rd Columbus, OH | 2.0–3.0 | 1.0–1.5 | 997 | $1,059 | $1.06 | 2d | 4 | 0.72mi |
| 705 E Columbus St Columbus, OH | 3.0 | 1.0 | 1436 | $2,300 | $1.60 | 43d | 1 | 0.73mi |
| 1275-1279 E Kossuth St Columbus, OH | 2.0 | 2.0 | 1160 | $1,350 | $1.16 | 43d | 1 | 0.73mi |
| 529 E Morrill Ave Columbus, OH | 3.0 | 1.0 | 1318 | $1,600 | $1.21 | 3d | 1 | 0.74mi |
| 932 Linwood Ave Columbus, OH | 4.0 | 1.5 | 1663 | $2,045 | $1.23 | 43d | 1 | 0.74mi |
| 1106 Ellsworth Ave Columbus, OH | 3.0 | 1.0 | 1150 | $1,495 | $1.30 | 7d | 1 | 0.75mi |
| 357 Frebis Ave #5 Columbus, OH | 3.0 | 3.5 | 1748 | $2,750 | $1.57 | 43d | 1 | 0.77mi |
| 357 Frebis Ave #6 Columbus, OH | 3.0 | 3.5 | 2160 | $2,950 | $1.37 | 43d | 1 | 0.77mi |
| 461-463 Reinhard Ave Columbus, OH | 3.0 | 1.0 | 1134 | $1,450 | $1.28 | 2d | 1 | 0.78mi |
| 461-463 Reinhard Ave Unit 461 Columbus, OH | 3.0 | 1.0 | 1134 | $1,450 | $1.28 | 2d | 1 | 0.78mi |
Listing history 14 events
-
2026-04-21$75,000 Active 402-char remark
Show marketing remark (402 chars)
ONLINE AUCTION, the RESERVE (Minimum Bid) is $75,000. The auction ends at 7:00 PM, Thursday, May 21st, 2026. BUYERS MUST SIGN ACKNOWLEDGEMENT OF TERMS to bid. Agents, please see 'A2A'. This 3-bedroom, 1-bath home sits on approximately 0.12± acres. Built in 1938, the home offers approximately 1,523 square feet of living space. The property includes off-street parking located behind the home.
-
2010-09-19historical
-
2010-05-25$68,730
-
2010-01-30soldstatus $11,000
-
2010-01-07historical
-
2009-12-14$13,000
-
2006-03-22soldstatus $85,000
-
2005-12-28soldstatus $36,000
-
2005-12-20soldstatus $36,000
-
2005-12-06historical
-
2005-11-09$45,150
-
2005-01-08historical
-
2004-10-07$58,000
-
1989-02-03soldstatus $37,900
ⓘ Source: listings_history table (triggers on properties + properties_extension) + one-shot
backfill from property_details.listing_events for pre-trigger history.
Tax reassessment forecast OH · Partial reset (capped growth)
- Current annual tax
- $3,256 · $271/mo
- Projected year-2 tax
- $3,256 · $271/mo
- Expected delta
- $0/yr ($0/mo · 0.0%)
ⓘ Screening estimate from a state-policy table — verify with the county assessor before closing.
Climate risk First Street
- Flood 1/10 Low FEMA zone X (unshaded) · 0% chance over 30 yrs
- Wildfire 1/10 Low
- Heat 4/10 Moderate 7 d/yr ≥100°F today · 18 d/yr by 30 yrs out
- Wind 2/10 Low 100% chance of damaging wind over 30 yrs
- Air quality 3/10 Moderate 2 unhealthy d/yr today · 3 by 30 yrs out
Nearby sold comps map
Loading sold comps map…
Walkable amenities ~0.75 mi
Loading nearby amenities…
Taxation est. · year 1
- Rental income
- $22,317
- − Mortgage interest
- −$14,374
- − Property taxes
- −$3,256
- − Insurance
- −$1,283
- − Repairs & maintenance
- −$1,785
- − Management
- −$1,785
- − Depreciation
- −$7,465
- Taxable loss
- −$7,632
- Est. tax savings @ 24.0%
- +$1,832
- After-tax cash flow
- $-1,225/yr
For passive investors: Depreciation is non-cash, so a rental often shows a tax loss while cash-flowing — sheltering income. Rental losses are passive: they offset passive income freely, and up to $25,000/yr can offset ordinary (W-2) income if you actively participate and your MAGI is under $100k (phasing out to $0 by $150k); unused losses carry forward. On sale, claimed depreciation is recaptured at up to 25%, and gains may owe capital-gains tax (a 1031 exchange can defer both). Figures are a year-1 estimate at your 24.0% rate — not tax advice; consult a CPA.
Schools (NCES district)
- District
- Columbus City School District
- NCES district ID
- 3904380
- Math proficiency
- 15% ▼ -17.00%
- Reading proficiency
- 26% ▼ -12.00%
- Median HH income
- $38,483
- Composite
- 17.19/100
- National rank
- #9105
- State rank
- #626 of 656 in OH
Livability — Columbus
- Score
- 81/100
- State rank
- #97
- US rank
- #1491
Category grades
Schools grade is shown separately in the Schools card above.
Census & demographics
- Census place
- Columbus, OH
- County
- Franklin County · 1,351,780 people
- City population
- 612,189
- Metro
- Columbus, OH
- Population (ZIP)
- 21,996
- Household income
- $75,806
- Rent vs Own
- Severe rent burden
- 846.0
Population outlook (Franklin County) Hauer SSP2
- Today (2025)
- 1,456,139 people
- By 2030
- 1,556,890 · +6.9%
- By 2040
- 1,757,349 · +20.7%
- By 2050
- 1,950,539 · +34.0%
- By 2075
- 2,376,171 · +63.2%
- By 2100
- 2,636,796 · +81.1%
Race, ethnicity, and origin ACS 2023
- Neighborhood character
- Diverse neighborhood (Simpson 0.59)
- Race & ethnicity
- White 56% Black 31% Two or more races 9% Hispanic / Latino 4% Asian 1% Native American 1%
- Common ancestry
- Romanian 3% Slovak 2% Lithuanian 1%
- Foreign-born
- 4% · Canada
- Languages at home
- 96% English-only · Spanish 2% Other Indo-European 1%
Political lean MEDSL · Franklin
- 2024 margin
- Strong D (+28.4) · D 63.7% · R 35.3% · Other 1.0%
- 2008→2024 swing
- +7.7pp toward D · 2008: 20.7pp · 2024: 28.4pp
- All cycles
- 2024: D+28.4 2020: D+31.4 2016: D+25.9 2012: D+21.7 2008: D+20.7
Not yet ingested
- Civics
- —
Market trends
- HPI YoY
- ▼ -576.73%
- Current HPI
- 173.8569
- Rent YoY
- ▲ 3.51%
- Metro
- Columbus, OH
- State GDP YoY
- ▲ 1.98%
- F500 in state
- 48
Industry mix (Fortune 500 HQ in OH)
| Industry | F500 HQs | Revenue |
|---|---|---|
| Insurance | 3 | $145B |
|
||
| Industrial Machinery | 3 | $49B |
|
||
| Financial Services | 3 | $24B |
|
||
| Consumer Goods | 2 | $93B |
|
||
| Aerospace / Defense | 2 | $47B |
|
||
| Utilities | 2 | $33B |
|
||
Price history
+97.9% since first listed14 events — show timeline
- 2026-04-21 Listed $75,000 CBRMLS
- 2010-09-19 Listing Removed — CBRMLS
- 2010-05-25 Listed $68,730 CBRMLS
- 2010-01-30 Sold (MLS) $11,000 CBRMLS
- 2010-01-07 Listing Removed — CBRMLS
- 2009-12-14 Listed $13,000 CBRMLS
- 2006-03-22 Sold (Public Records) $85,000 Public Records
- 2005-12-28 Sold (Public Records) $36,000 Public Records
- 2005-12-20 Sold (MLS) $36,000 CBRMLS
- 2005-12-06 Listing Removed — CBRMLS
- 2005-11-09 Listed $45,150 CBRMLS
- 2005-01-08 Listing Removed — CBRMLS
- 2004-10-07 Listed $58,000 CBRMLS
- 1989-02-03 Sold (Public Records) $37,900 Public Records
Property tax history
+11.1%/yrLatest (2024): $3,256 · -1.4% YoY. Source: county tax records.
Cash-flow waterfall
monthlySold comps — $/sqft
last 12 mo · ≤1 miLoading sold comps…