8304 25th St · Lubbock, TX
Flood risk No data
- FEMA flood zone
- —
- Chance of flooding over 30 yrs
- —
- Est. flood insurance / yr
- —
Fire risk No data
- Est. fire insurance / yr
- —
Heat risk No data
- Hot days now (above threshold)
- —
- Hot days in 30 yrs
- —
Wind risk No data
- Chance of severe wind over 30 yrs
- —
Air-quality risk No data
- Unhealthy air days now
- —
- Unhealthy air days in 30 yrs
- —
Risk factors via First Street. Map © Google.
Why this score? — see what drove the D- grade
The composite is a weighted blend of 9 inputs, each scored 0–100. Each bar is that input's sub-score; the figure is the points it added to the 100-point composite (weight × sub-score).
- Cash flow +12.1/30.0
- ARV discount +7.5/15.0
- Schools +4.4/10.0
- Livability +4.0/5.0
- DSCR +3.6/10.0
- 1% rule +3.5/10.0
- Rent growth +2.5/5.0
- Condition / age +2.2/5.0
- Appreciation +0.0/10.0
$190,840
🖨 Deal sheet (PDF) 📄 Offer letter ✓ Due diligence
Listing remarks
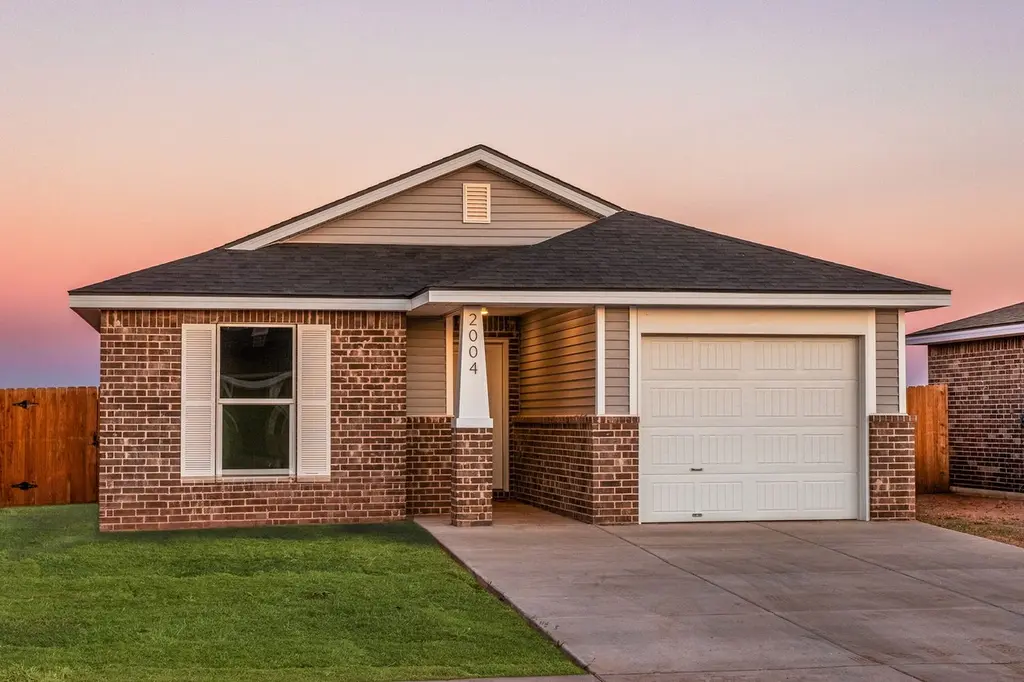
The 1,000 square-foot Victoria floor plan is a smart, comfortable start to homeownership with features that make everyday living easy. Brick and vinyl exterior with covered entryLuxury vinyl plank flooring in main areasGranite or quartz countertopsKitchen island with bar seatingStainless steel appliancesPrivate primary suite with walk-in closet
Key facts
- Covered entry
- Kitchen island
- Parking
Tags
Property features AI
Finance
- Other: Address: 8304 25th St, Lubbock TX 79407; Listing status: Active
- Financial info: List price $190,840
Exterior
- Parking: 1 parking space
- Utilities: Has heating; Has cooling
- Home design: Spec home — "Victoria" plan; Single-family property
- Exterior features: Living area approximately 1005
Interior
- Kitchen: Dishwasher; Disposal; Microwave
- Bedrooms: 2 bedrooms
- Bathrooms: 2 full bathrooms
- Heating & cooling: Forced air heating; Central air; Ceiling fan(s)
- Interior features: Dishwasher; Disposal; Microwave
Neighborhood map
What this means for you Summary
Snapshot
- This is a 2-bed/2.0-bath single-family listed at $191k. Condition is rated fair.
Deal economics
- At list price, monthly cash flow is $-42 ($-502/yr) — negative.
- To cash-flow at today's rent, offer at most $185k (3.2% below list).
- To meet the 1% rule (rent ≥ 1% of price), the offer needs to be $162k (15.3% below list).
- Recommended offer: $162k (15.3% below list) — sets the bar for 1% rule.
Location & tenants
- Location reads 80/100 on livability (#37 in TX, #1,749 nationally) — a professional / high-income tenant draw. Strengths: commute A+, cost of living A+, housing A+; Watch: employment C-, crime F.
- Frenship ISD (urban): math 47% / reading 54% proficiency, ranked #162 of 826 in TX (top 20%) — acceptable for families but not a draw, mixed tenant base, ~2y average lease.
- Zoned schools: Willow Bend El (math 34% / reading 41%, grade F, #1,744 of 4,322 statewide, top 41%, 730 students, 74% FRL); Terra Vista Middle (math 37% / reading 44%, grade F, #637 of 1,662 statewide, top 39%, 891 students, 66% FRL); Frenship H S (math 44% / reading 65%, grade C-, #379 of 1,632 statewide, top 26%, 3,247 students, 46% FRL) — zoned schools average 62% FRL vs 36% district-wide (25 pts higher); higher-poverty schools than district average — tighter screening recommended.
- Market conditions: Rents soft (-0.1%/yr); 613 active listings in the ZIP; 37 comparable units currently listed for rent nearby; rentals at typical pace (median 23d on market — plan ~3-4 weeks tenant-placement turnaround); 41% of comp listings sitting > 30 days — soft ceiling on asking rent; 2,219 units permitted in Lubbock County in 2024 (252 in 5+ unit buildings).
- This rent runs 32% of the median local income ($62k/yr) — at the standard rent-burdened threshold; future hikes will face affordability resistance.
Forward outlook
- Local home prices are declining (-3.0%/yr); year-one equity from $1k of loan paydown is wiped out by about $6k of value loss. Plan a longer hold.
- Lubbock County population projected at +39% by 2050 — long-run rental-demand tailwind backs the buy-and-hold thesis.
Negotiation context
- It's been on market 39 days — a 3% lower offer ($185k) is reasonable based on typical stale-listing flexibility.
Questions for the listing agent
- What do current leases actually rent for vs. the listed asking? Can we see a recent rent roll and the last 12 months of T-12 income?
- It's been on market 39 days. Have you received any prior offers? Is the seller open to a 15% concession, seller financing, or rate buy-down credit?
- Have any recent inspections been done? Can we get a copy of the seller's disclosures and any deferred-maintenance estimates?
- Is there a deadline driving the sale (1031 exchange, divorce, estate, relocation)? That informs how much negotiation room exists.
- Schools are D-rated, which usually means shorter tenancies and higher turnover. Who's the typical renter profile here, and what's been the actual vacancy rate?
- Crime grade is F in this area — have there been break-ins, vandalism, or insurance claims at this property in the last 3 years? What carrier currently insures it and at what premium?
- The area grade is low — what's the realistic commute time and amenity access for the typical tenant pool here? Any planned neighborhood developments (good or bad) we should know about?
- What's the average days-on-market for RENTAL listings here right now (not sales)? A rising rental-DOM trend means longer vacancies and softer asking-rent achievability than the comps imply.
- What's the recent tenant-quality profile in this submarket — average credit score on applications, eviction rate, late-payment / NSF rate, and stable-employment percentage? A property-management company in the area should have these aggregated.
- How much new for-sale + rental construction is in the pipeline within 1–3 miles? Heavy new supply typically softens prices + rents 12–24 months out; constrained supply supports both.
Investment metrics
- 1% rule
- 0.85% ✗
- Cap rate
- 6.03%
- Cash-on-cash
- -0.94%
- DSCR
- 0.96
- GRM
- 9.8
CMA / ARV
No comps found within radius.
Projected returns pro-forma
-3.0% appreciation · 0.0% rent growth · sell at horizon
- IRR
- -21.3%
- Equity multiple
- 0.28×
- Total profit
- $-38,302
- Equity at exit
- $28,455
- IRR
- -23.9%
- Equity multiple
- -0.03×
- Total profit
- $-54,994
- Equity at exit
- $16,500
Cash invested: $53,435 (down + closing). Projections, not guarantees.
Landlord ↔ Tenant lean methodology
- Overall (STATE)
- 87 Strongly Landlord-Friendly
- State Texas
- 87 Strongly Landlord-Friendly · R+5
- County
- — inherits STATE
- City
- — inherits STATE
ZIP-level market 79407
- Home prices YoY
- -16.3%
- Rents YoY
- -0.1%
- Active inventory
- 613
- Price-to-rent
- 9.8×
Monthly cashflow live
- Estimated rent
- $1,616 high interval (Pro) →
- Mortgage (P&I)
- −$1,001
- Tax est. 1.5%
- −$239 /mo · $2,863/yr
- Insurance
- −$80
- HOA
- −$0
- Vacancy / Maint / Mgmt
- −$339
- Net cashflow
- $-42
Break-even live
Sensitivity live
| Price | -10% $90 | -5% $24 | +0% $-42 | +5% $-108 | +10% $-174 |
|---|---|---|---|---|---|
| Rent | -10% $-170 | -5% $-106 | +0% $-42 | +5% $22 | +10% $86 |
| Rate | -1.0pp $54 | -0.5pp $7 | base $-42 | +0.5pp $-91 | +1.0pp $-142 |
UW: 25.0% down · 7.5% · 30yr · 1.5% tax · 5.0% vac · 8.0% maint · 8.0% mgmt
Financing live
Cash to close
- Down payment
- $47,710
- Closing costs
- $5,725
- Reserves months
- —
- Total cash needed
- —
Loan-product check · same deal, 3 products live
Conventional
25% down · 7.5% · 30yr
- Down + closing
- —
- Monthly P&I
- —
- Monthly cashflow
- —
- DSCR
- —
- Eligible?
- —
Personal DTI + credit; lowest rate.
DSCR
20% down · 8.5% · 30yr
- Down + closing
- —
- Monthly P&I
- —
- Monthly cashflow
- —
- DSCR
- —
- Eligible?
- —
No personal income docs; deal must DSCR.
Hard money
10% down · 12.0% · 12mo
- Down + closing
- —
- Monthly P&I
- —
- Monthly cashflow
- —
- DSCR
- —
- Eligible?
- —
Short-term bridge; refi at stabilization.
Rent comps 37 comps
| Address | Beds | Baths | Sqft | Rent | $/sqft | DOM | Units | Dist |
|---|---|---|---|---|---|---|---|---|
| 2603 Harmony Ave Lubbock, TX | 3.0 | 2.0 | 1450 | $1,749 | $1.21 | 15d | 1 | 0.28mi |
| 2603 Harmony Ave Lubbock, TX | 3.0 | 2.0 | 1450 | $1,749 | $1.21 | 23d | 1 | 0.28mi |
| 8607 29th St Lubbock, TX | 3.0 | 2.0 | 1350 | $1,749 | $1.30 | 45d | 1 | 0.30mi |
| 2511 Kenwood Ave Lubbock, TX | 3.0 | 2.0 | 1450 | $2,099 | $1.45 | 23d | 1 | 0.67mi |
| 2509 Kenwood Ave Lubbock, TX | 3.0 | 2.0 | 1450 | $1,699 | $1.17 | 23d | 1 | 0.67mi |
| 2055 Kenwood Ave Lubbock, TX | 3.0 | 2.0 | 1450 | $1,649 | $1.14 | 15d | 1 | 0.68mi |
| 2154 Kokomo Ave Lubbock, TX | 3.0 | 2.0 | 1450 | $1,799 | $1.24 | 23d | 1 | 0.72mi |
| 2028 Kenwood Ave Lubbock, TX | 3.0 | 2.0 | 1450 | $1,650 | $1.14 | 15d | 1 | 0.74mi |
| 2168 Langford Ave Lubbock, TX | 3.0 | 2.0 | 1450 | $1,699 | $1.17 | 45d | 1 | 0.74mi |
| 2125 Kirksey Ave Lubbock, TX | 3.0 | 2.0 | 1450 | $1,650 | $1.14 | 15d | 1 | 0.75mi |
| 2162 Langford Ave Lubbock, TX | 3.0 | 2.0 | 1450 | $1,699 | $1.17 | 45d | 1 | 0.78mi |
| 2131 Kokomo Ave Unit A Lubbock, TX | 3.0 | 2.0 | 1360 | $1,500 | $1.10 | 23d | 1 | 0.79mi |
| 2147 Langford Ave Lubbock, TX | 3.0 | 2.0 | 1450 | $1,699 | $1.17 | 23d | 1 | 0.79mi |
| 2143 Langford Ave Lubbock, TX | 3.0 | 2.0 | 1450 | $1,750 | $1.21 | 45d | 1 | 0.81mi |
| 2152 Langford Ave Unit Labs Lubbock, TX | 3.0 | 2.0 | 1450 | $1,660 | $1.14 | 23d | 1 | 0.82mi |
| 2139 Langford Ave Lubbock, TX | 3.0 | 2.0 | 1450 | $1,899 | $1.31 | 23d | 1 | 0.83mi |
| 2137 Langford Ave Lubbock, TX | 3.0 | 2.0 | 1450 | $1,700 | $1.17 | 23d | 1 | 0.83mi |
| 2148 Langford Ave Lubbock, TX | 3.0 | 2.0 | 1450 | $1,699 | $1.17 | 45d | 1 | 0.84mi |
| 2123 Langford Ave Lubbock, TX | 3.0 | 2.0 | 1450 | $1,799 | $1.24 | 23d | 1 | 0.85mi |
| 2138 Langford Ave Lubbock, TX | 3.0 | 2.0 | 1450 | $1,699 | $1.17 | 45d | 1 | 0.87mi |
| 2132 Langford Ave Lubbock, TX | 3.0 | 2.0 | 1450 | $1,699 | $1.17 | 15d | 1 | 0.88mi |
| 2128 Langford Ave Lubbock, TX | 3.0 | 2.0 | 1450 | $1,699 | $1.17 | 15d | 1 | 0.88mi |
| 2101 Langford Ave Lubbock, TX | 3.0 | 2.0 | 1500 | $1,400 | $0.93 | 45d | 1 | 0.89mi |
| 2122 Langford Ave Lubbock, TX | 3.0 | 2.0 | 1450 | $1,699 | $1.17 | 15d | 1 | 0.89mi |
| 1919 Langford Ave Unit A Lubbock, TX | 3.0 | 2.0 | 1500 | $1,399 | $0.93 | 45d | 1 | 0.90mi |
| 1919 Langford Ave Lubbock, TX | 3.0 | 2.0 | 1500 | $1,350 | $0.90 | 45d | 1 | 0.90mi |
| 1918 Langford Ave Unit B Lubbock, TX | 3.0 | 2.0 | 1500 | $1,399 | $0.93 | 15d | 1 | 0.94mi |
| 1903 Langford Ave Unit A Lubbock, TX | 3.0 | 2.0 | 1500 | $1,575 | $1.05 | 45d | 1 | 0.94mi |
| 1903 Langford Ave Unit A Lubbock, TX | 3.0 | 2.0 | 1500 | $1,575 | $1.05 | 15d | 1 | 0.94mi |
| 1903 Langford Ave Unit B Lubbock, TX | 3.0 | 2.0 | 1500 | $1,300 | $0.87 | 45d | 1 | 0.94mi |
| 7535 32nd St Lubbock, TX | 3.0 | 2.0 | 1120 | $1,395 | $1.25 | 45d | 1 | 1.02mi |
| 7541 33rd St Lubbock, TX | 3.0 | 2.0 | 1296 | $1,500 | $1.16 | 23d | 1 | 1.02mi |
| 8704 10th St Lubbock, TX | 3.0 | 2.0 | 1423 | $1,450 | $1.02 | 45d | 1 | 1.18mi |
| 7420 35th St Lubbock, TX | 3.0 | 2.0 | 1247 | $1,500 | $1.20 | 45d | 1 | 1.40mi |
| 7413 35th St Lubbock, TX | 3.0 | 2.0 | 1247 | $1,475 | $1.18 | 23d | 1 | 1.44mi |
| 7324 26th St Lubbock, TX | 2.0 | 1.0 | 936 | $850 | $0.91 | 45d | 1 | 1.46mi |
| 2911 Urbana Pl Lubbock, TX | 3.0 | 2.0 | 1452 | $1,800 | $1.24 | 23d | 1 | 1.48mi |
Listing history 17 events
-
2026-06-22days on market $190,840 Active 39 DOM
-
2026-06-18days on market $190,840 Active 36 DOM
-
2026-06-17days on market $190,840 Active 35 DOM
-
2026-06-16days on market $190,840 Active 34 DOM
-
2026-06-15days on market $190,840 Active 33 DOM
-
2026-06-13days on market $190,840 Active 30 DOM
-
2026-06-10days on market $190,840 Active 28 DOM
-
2026-06-09days on market $190,840 Active 27 DOM
-
2026-06-08days on market $190,840 Active 26 DOM
-
2026-06-07days on market $190,840 Active 25 DOM
-
2026-06-05days on market $190,840 Active 22 DOM
-
2026-06-03days on market $190,840 Active 21 DOM
-
2026-06-02days on market $190,840 Active 20 DOM
-
2026-06-01days on market $190,840 Active 19 DOM
-
2026-05-31days on market $190,840 Active 18 DOM
-
2026-05-30days on market $190,840 Active 17 DOM
-
2026-05-04$190,840 Active 346-char remark
ⓘ Source: listings_history table (triggers on properties + properties_extension) + one-shot
backfill from property_details.listing_events for pre-trigger history.
Nearby sold comps map
Loading sold comps map…
Walkable amenities ~0.75 mi
Loading nearby amenities…
Taxation est. · year 1
- Rental income
- $19,398
- − Mortgage interest
- −$10,690
- − Property taxes
- −$2,863
- − Insurance
- −$954
- − Repairs & maintenance
- −$1,552
- − Management
- −$1,552
- − Depreciation
- −$5,552
- Taxable loss
- −$3,765
- Est. tax savings @ 24.0%
- +$904
- After-tax cash flow
- $401/yr
For passive investors: Depreciation is non-cash, so a rental often shows a tax loss while cash-flowing — sheltering income. Rental losses are passive: they offset passive income freely, and up to $25,000/yr can offset ordinary (W-2) income if you actively participate and your MAGI is under $100k (phasing out to $0 by $150k); unused losses carry forward. On sale, claimed depreciation is recaptured at up to 25%, and gains may owe capital-gains tax (a 1031 exchange can defer both). Figures are a year-1 estimate at your 24.0% rate — not tax advice; consult a CPA.
Condition & rehab AI · 2 photos
The home is in fair condition with some minor repairs needed, particularly on the interior walls and paint. Painting and landscaping would significantly enhance its value.
Repairs flagged
- Minor Interior walls/paint — Some wear is visible on the interior walls and paint, indicating minor repairs are needed.
Value-add opportunities
- Resale Paint interior walls — Painting interior walls can improve the home's appearance and make it more appealing to potential buyers.
- Both Landscaping — Landscaping can enhance curb appeal and add value to the property, both for resale and rental.
Renovation cost estimate screening
| Repair item | Severity | Est. cost |
|---|---|---|
| Interior walls/paint · Some wear is visible on the interior walls and paint, indicating minor repairs are needed. | Minor | $500–3,000 |
| Total estimated repair cost · 1 items | $500–3,000 |
Value-add ROI direction
- Resale Paint interior walls — Painting interior walls can improve the home's appearance and make it more appealing to potential buyers. ↑
- Both Landscaping — Landscaping can enhance curb appeal and add value to the property, both for resale and rental. ↑
ⓘ Cost ranges are severity-bucket heuristics (US national rule-of-thumb). Get contractor quotes + a written scope before underwriting a rehab budget.
Schools (NCES district)
- District
- Frenship ISD
- NCES district ID
- 4819830
- Math proficiency
- 47% ▼ -8.00%
- Reading proficiency
- 54% ▬ 0.00%
- Median HH income
- $54,376
- Composite
- 43.59/100
- National rank
- #2976
- State rank
- #162 of 826 in TX
Livability — Lubbock
- Score
- 80/100
- State rank
- #37
- US rank
- #1749
Category grades
Schools grade is shown separately in the Schools card above.
Census & demographics
- Census place
- Lubbock, TX
- County
- Lubbock County · 293,542 people
- City population
- 283,030
- Metro
- Lubbock, TX
- Population (ZIP)
- 24,000
- Household income
- $61,509
- Rent vs Own
- Severe rent burden
- 1914.0
Population outlook (Lubbock County) Hauer SSP2
- Today (2025)
- 345,960 people
- By 2030
- 371,449 · +7.4%
- By 2040
- 424,539 · +22.7%
- By 2050
- 481,150 · +39.1%
- By 2075
- 633,467 · +83.1%
- By 2100
- 746,853 · +115.9%
Race, ethnicity, and origin ACS 2023
- Neighborhood character
- Diverse neighborhood (Simpson 0.56)
- Race & ethnicity
- White 58% Hispanic / Latino 31% Two or more races 17% Black 4% Asian 3%
- Hispanic origin (detail)
- Mexican 27%
- Common ancestry
- Italian 2% Lithuanian 1% Slovak 1%
- Foreign-born
- 5% · Canada, South Korea, China
- Languages at home
- 83% English-only · Spanish 13% Other Asian/Pacific 1% Chinese 1%
Political lean MEDSL · Lubbock
- 2024 margin
- Solid R (+39.5) · D 29.7% · R 69.2% · Other 1.0%
- 2008→2024 swing
- -2.8pp toward R · 2008: -36.7pp · 2024: -39.5pp
- All cycles
- 2024: R+39.5 2020: R+32.2 2016: R+38.4 2012: R+40.9 2008: R+36.7
Not yet ingested
- Civics
- —
Market trends
- HPI YoY
- ▼ -44.87%
- Current HPI
- 229.9895
- Rent YoY
- ▼ -0.07%
- Metro
- Lubbock, TX
- State GDP YoY
- ▲ 3.95%
- F500 in state
- 110
Industry mix (Fortune 500 HQ in TX)
| Industry | F500 HQs | Revenue |
|---|---|---|
| Energy | 16 | $1,198B |
|
||
| Technology | 5 | $198B |
|
||
| Engineering / Construction | 4 | $72B |
|
||
| Energy Services | 3 | $60B |
|
||
| Utilities | 3 | $41B |
|
||
| Healthcare | 2 | $330B |
|
||
Cash-flow waterfall
monthlySold comps — $/sqft
last 12 mo · ≤1 miLoading sold comps…