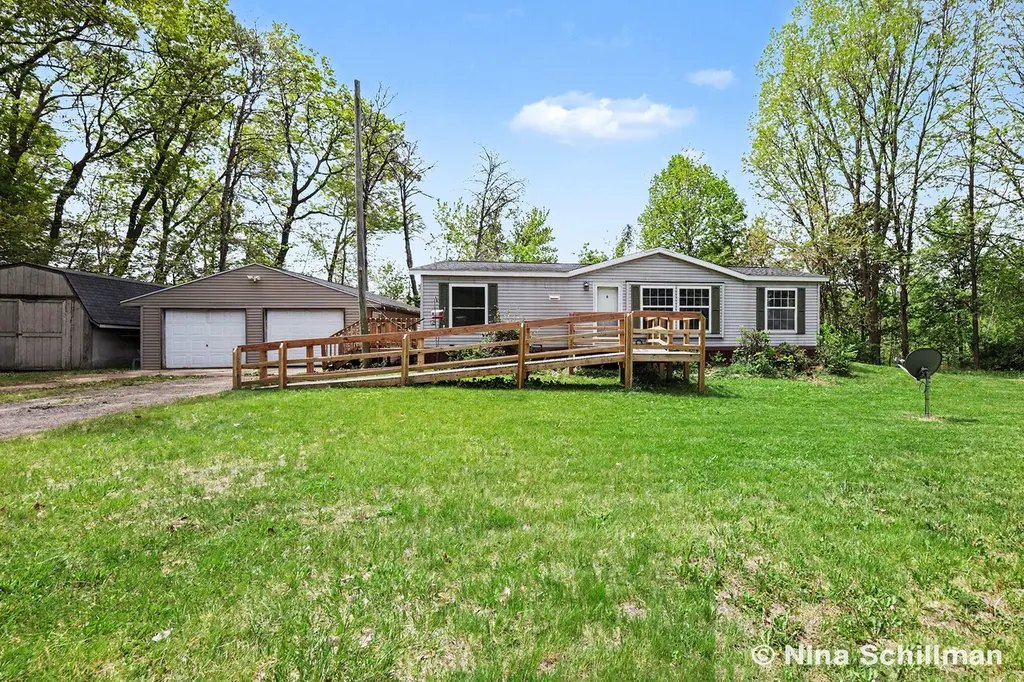
12150 Woodland Park Dr NE · Belding, MI
Flood risk 1/10 · Minimal
- FEMA flood zone
- X (unshaded)
- Chance of flooding over 30 yrs
- 0.0%
- Est. flood insurance / yr
- $507 – $1,088
Fire risk 1/10 · Minimal
- Est. fire insurance / yr
- $784 – $1,456
Heat risk 2/10 · Minimal
- Hot days now (above 98°F)
- 7 days/yr
- Hot days in 30 yrs
- 15 days/yr
Wind risk 2/10 · Minimal
- Chance of severe wind over 30 yrs
- —
Air-quality risk 2/10 · Minimal
- Unhealthy air days now
- 1 days/yr
- Unhealthy air days in 30 yrs
- 2 days/yr
Risk factors via First Street. Map © Google.
Why this score? — see what drove the D grade
The composite is a weighted blend of 9 inputs, each scored 0–100. Each bar is that input's sub-score; the figure is the points it added to the 100-point composite (weight × sub-score).
- Appreciation +10.0/10.0
- ARV discount +9.6/15.0
- Cash flow +9.1/30.0
- Livability +3.7/5.0
- DSCR +2.5/10.0
- Rent growth +2.5/5.0
- Condition / age +2.5/5.0
- Schools +2.3/10.0
- 1% rule +1.6/10.0
$245,000
🖨 Deal sheet (PDF) 📄 Offer letter ✓ Due diligence
Listing remarks MLS
Welcome home to this charming 3 bedroom , 2 bath home in Belding, just steps from beautiful Big Pine Island Lake! This property offers the perfect blend of comfort and convenience. Enjoy extra storage and workspace with the two stall detached garage and additional shed. Whether you're looking for year round home or a peaceful getaway near a lake, this could be the one for you.
Key facts
- Additional shed
- 2.25 acre lot
- 2 garage spots
Tags
Property features AI
Exterior
- Parking: Detached garage; Two-car garage
- Utilities: Well water; Electricity available
- Home design: Ranch-style residence; Residential property
- Construction: Built in 1994; Vinyl siding; Composition roof; Crawl space foundation
- Exterior features: Wooded lot; Shed on the property; Paved road access
Interior
- Kitchen: Range; Microwave; Refrigerator; Dishwasher
- Bathrooms: Two full bathrooms
- Heating & cooling: Forced air heating
- Interior features: Eight total rooms; Crawl space basement
- Laundry & utility: Washer; Dryer
Neighborhood map
What this means for you Summary
Snapshot
- This is a 3-bed/2.0-bath single-family listed at $245k.
Deal economics
- At list price, monthly cash flow is $-189 ($-2k/yr) — negative.
- To cash-flow at today's rent, offer at most $212k (13.7% below list).
- To meet the 1% rule (rent ≥ 1% of price), the offer needs to be $161k (34.1% below list).
- Recommended offer: $161k (34.1% below list) — sets the bar for 1% rule.
Location & tenants
- Location reads 74/100 on livability (#169 in MI, #4,436 nationally) — a middle-class / working-renter tenant base. Strengths: cost of living A+, housing A+, health & safety A+; Watch: employment D, amenities F, commute F.
- Belding Area School District (town): math 23% / reading 31% proficiency, ranked #398 of 540 in MI (top 74%) — low school quality limits family demand, transient renter base, plan for 1-2y turnover.
- Zoned schools: Ellis Elementary School (394 students, 59% FRL); Belding Middle School (math 20% / reading 34%, grade F, #372 of 493 statewide, top 77%, 325 students, 50% FRL); Belding High School (math 17% / reading 37%, grade F, #462 of 713 statewide, top 66%, 557 students, 48% FRL) — zoned schools at 53% FRL track the district average.
- Market conditions: 73 active listings in the ZIP; 2,253 units permitted in Kent County in 2024 (969 in 5+ unit buildings).
Forward outlook
- In year one you build about $26k of equity ($2k loan paydown + $24k appreciation (10.0% local appreciation)).
- Kent County population projected at +22% by 2050 — long-run rental-demand tailwind backs the buy-and-hold thesis.
- By year 2, paydown + projected appreciation supports a ~$42k cash-out refi (75% LTV) — recoverable capital for the next deal without selling this one.
Negotiation context
- Only 7 days on market — expect competitive offers; lowballing is unlikely to land.
- 7 sale attempts since 28y ago with the ask held roughly flat each time — persistent listings suggest the price (not the market) is what's stuck; bring a comps-based counter.
- Current owner paid $83k; list at $245k implies a 194% gain — meaningful room to come down on a strong offer.
Questions for the listing agent
- What do current leases actually rent for vs. the listed asking? Can we see a recent rent roll and the last 12 months of T-12 income?
- Is there a deadline driving the sale (1031 exchange, divorce, estate, relocation)? That informs how much negotiation room exists.
- Schools are D-rated, which usually means shorter tenancies and higher turnover. Who's the typical renter profile here, and what's been the actual vacancy rate?
- The area grade is low — what's the realistic commute time and amenity access for the typical tenant pool here? Any planned neighborhood developments (good or bad) we should know about?
- What's the average days-on-market for RENTAL listings here right now (not sales)? A rising rental-DOM trend means longer vacancies and softer asking-rent achievability than the comps imply.
- What's the recent tenant-quality profile in this submarket — average credit score on applications, eviction rate, late-payment / NSF rate, and stable-employment percentage? A property-management company in the area should have these aggregated.
- How much new for-sale + rental construction is in the pipeline within 1–3 miles? Heavy new supply typically softens prices + rents 12–24 months out; constrained supply supports both.
Investment metrics
- 1% rule
- 0.66% ✗
- Cap rate
- 5.37%
- Cash-on-cash
- -3.31%
- DSCR
- 0.85
- GRM
- 12.6
CMA / ARV
- ARV (on-the-fly)
- $256,704
- Comps found
- 2
Show comp detail 2 sales within ~0.75 mi
| Address | Dist | Beds/Ba | Sqft | Sold | Price | $/sf | Match |
|---|---|---|---|---|---|---|---|
| 12500 Woodland Park Dr NE | 0.24mi | 4/2.0 (+1) | 1,532 (+14%) | 20mo | $292,000 | $191 | 43 |
| 7105 Lessiter Rd NE | 0.62mi | 3/1.5 | 1,485 (+10%) | 12mo | $275,000 | $185 | 42 |
Match score weights: distance 35% · size 25% · config 20% · recency 20%. Top-matched comps best support the ARV.
Projected returns pro-forma
10.0% appreciation · 3.0% rent growth · sell at horizon
- IRR
- 21.9%
- Equity multiple
- 2.77×
- Total profit
- $121,253
- Equity at exit
- $220,715
- IRR
- 19.7%
- Equity multiple
- 6.34×
- Total profit
- $366,327
- Equity at exit
- $475,981
Cash invested: $68,600 (down + closing). Projections, not guarantees.
Landlord ↔ Tenant lean methodology
- Overall (STATE)
- 62 Landlord-Friendly
- State Michigan
- 62 Landlord-Friendly · EVEN
- County
- — inherits STATE
- City
- — inherits STATE
ZIP-level market 48809
- Home prices YoY
- 3.3%
- Active inventory
- 73
- Price-to-rent
- 12.6×
Monthly cashflow live
- Estimated rent
- $1,614 medium interval (Pro) →
- Mortgage (P&I)
- −$1,285
- Tax from tax record
- −$78 /mo · $936/yr
- Insurance
- −$102
- HOA
- −$0
- Vacancy / Maint / Mgmt
- −$339
- Net cashflow
- $-189
Break-even live
Sensitivity live
| Price | -10% $-51 | -5% $-120 | +0% $-189 | +5% $-259 | +10% $-328 |
|---|---|---|---|---|---|
| Rent | -10% $-317 | -5% $-253 | +0% $-189 | +5% $-126 | +10% $-62 |
| Rate | -1.0pp $-66 | -0.5pp $-127 | base $-189 | +0.5pp $-253 | +1.0pp $-317 |
UW: 25.0% down · 7.5% · 30yr · 1.5% tax · 5.0% vac · 8.0% maint · 8.0% mgmt
Financing live
Cash to close
- Down payment
- $61,250
- Closing costs
- $7,350
- Reserves months
- —
- Total cash needed
- —
Loan-product check · same deal, 3 products live
Conventional
25% down · 7.5% · 30yr
- Down + closing
- —
- Monthly P&I
- —
- Monthly cashflow
- —
- DSCR
- —
- Eligible?
- —
Personal DTI + credit; lowest rate.
DSCR
20% down · 8.5% · 30yr
- Down + closing
- —
- Monthly P&I
- —
- Monthly cashflow
- —
- DSCR
- —
- Eligible?
- —
No personal income docs; deal must DSCR.
Hard money
10% down · 12.0% · 12mo
- Down + closing
- —
- Monthly P&I
- —
- Monthly cashflow
- —
- DSCR
- —
- Eligible?
- —
Short-term bridge; refi at stabilization.
Listing history 11 events
-
2026-05-22$245,000 Active
Show marketing remark (379 chars)
Welcome home to this charming 3 bedroom , 2 bath home in Belding, just steps from beautiful Big Pine Island Lake! This property offers the perfect blend of comfort and convenience. Enjoy extra storage and workspace with the two stall detached garage and additional shed. Whether you're looking for year round home or a peaceful getaway near a lake, this could be the one for you.
-
2026-05-22$245,000 Active 428-char remark
Show marketing remark (379 chars)
Welcome home to this charming 3 bedroom , 2 bath home in Belding, just steps from beautiful Big Pine Island Lake! This property offers the perfect blend of comfort and convenience. Enjoy extra storage and workspace with the two stall detached garage and additional shed. Whether you're looking for year round home or a peaceful getaway near a lake, this could be the one for you.
-
2014-09-16historical
-
1999-09-22soldstatus $83,400
-
1999-09-22soldstatus $83,400
-
1999-05-24$84,900
-
1999-05-24$84,900
-
1999-04-14historical
-
1998-12-14$84,900
-
1998-12-14$84,900
ⓘ Source: listings_history table (triggers on properties + properties_extension) + one-shot
backfill from property_details.listing_events for pre-trigger history.
Tax reassessment forecast MI · Partial reset (capped growth)
- Current annual tax
- $936 · $78/mo
- Projected year-2 tax
- $2,354 · $196/mo
- Expected delta
- +$1,419/yr (+$118/mo · 151.6%)
ⓘ Screening estimate from a state-policy table — verify with the county assessor before closing.
Climate risk First Street
- Flood 1/10 Low FEMA zone X (unshaded) · 0% chance over 30 yrs
- Wildfire 1/10 Low
- Heat 2/10 Low 7 d/yr ≥98°F today · 15 d/yr by 30 yrs out
- Wind 2/10 Low
- Air quality 2/10 Low 1 unhealthy d/yr today · 2 by 30 yrs out
Nearby sold comps map
Loading sold comps map…
Walkable amenities ~0.75 mi
Loading nearby amenities…
Taxation est. · year 1
- Rental income
- $19,374
- − Mortgage interest
- −$13,724
- − Property taxes
- −$936
- − Insurance
- −$1,225
- − Repairs & maintenance
- −$1,550
- − Management
- −$1,550
- − Depreciation
- −$7,127
- Taxable loss
- −$6,738
- Est. tax savings @ 24.0%
- +$1,617
- After-tax cash flow
- $-656/yr
For passive investors: Depreciation is non-cash, so a rental often shows a tax loss while cash-flowing — sheltering income. Rental losses are passive: they offset passive income freely, and up to $25,000/yr can offset ordinary (W-2) income if you actively participate and your MAGI is under $100k (phasing out to $0 by $150k); unused losses carry forward. On sale, claimed depreciation is recaptured at up to 25%, and gains may owe capital-gains tax (a 1031 exchange can defer both). Figures are a year-1 estimate at your 24.0% rate — not tax advice; consult a CPA.
Schools (NCES district)
- District
- Belding Area School District
- NCES district ID
- 2604530
- Math proficiency
- 23% ▼ -9.00%
- Reading proficiency
- 31% ▼ -8.00%
- Median HH income
- $46,310
- Composite
- 23.33/100
- National rank
- #7915
- State rank
- #398 of 540 in MI
Livability — Belding
- Score
- 74/100
- State rank
- #169
- US rank
- #4436
Category grades
Schools grade is shown separately in the Schools card above.
Census & demographics
- Population (ZIP)
- 11,292
Population outlook (Kent County) Hauer SSP2
- Today (2025)
- 712,484 people
- By 2030
- 748,618 · +5.1%
- By 2040
- 814,777 · +14.4%
- By 2050
- 868,556 · +21.9%
- By 2075
- 966,487 · +35.7%
- By 2100
- 967,975 · +35.9%
Race, ethnicity, and origin ACS 2023
- Neighborhood character
- Predominantly White (91%)
- Race & ethnicity
- White 91% Hispanic / Latino 4% Two or more races 4%
- Common ancestry
- Iranian 7% Romanian 4% Lithuanian 3%
- Foreign-born
- 1% · Canada, China
- Languages at home
- 95% English-only · Spanish 3% Russian/Polish/Slavic 1%
Political lean MEDSL · Kent
- 2024 margin
- Lean D (+5.4) · D 51.8% · R 46.5% · Other 1.7%
- 2008→2024 swing
- +4.8pp toward D · 2008: 0.5pp · 2024: 5.4pp
- All cycles
- 2024: D+5.4 2020: D+6.1 2016: R+3.1 2012: R+7.9 2008: D+0.5
Not yet ingested
- Civics
- —
Market trends
- HPI YoY
- ▲ 13.30%
- Current HPI
- 412.5108
- Rent YoY
- —
- Metro
- —
- State GDP YoY
- ▲ 1.37%
- F500 in state
- 28
Industry mix (Fortune 500 HQ in MI)
| Industry | F500 HQs | Revenue |
|---|---|---|
| Automotive Parts | 3 | $48B |
|
||
| Automotive | 2 | $372B |
|
||
| Chemicals | 1 | $45B |
|
||
| Automotive Retail | 1 | $29B |
|
||
| Healthcare / Medical Devices | 1 | $23B |
|
||
| Automotive Technology | 1 | $20B |
|
||
Price history
+188.6% since first listed16 events — show timeline
- 2026-06-09 Pending — MiRealSource-MiMLS
- 2026-06-01 Listing Removed — MiRealSource-MiMLS
- 2026-05-29 Pending — REALCOMP
- 2026-05-29 Pending — MiRealSource-MiMLS
- 2026-05-29 Pending — SW Michigan MLS
- 2026-05-22 Listed $245,000 SW Michigan MLS
- 2026-05-22 Listed $245,000 REALCOMP
- 2026-05-22 Listed $245,000 MiRealSource-MiMLS
- 2014-09-16 Listing Removed — SW Michigan MLS
- 1999-09-22 Sold (MLS) $83,400 REALCOMP
- 1999-09-22 Sold (MLS) $83,400 SW Michigan MLS
- 1999-05-24 Listed $84,900 REALCOMP
- 1999-05-24 Listed $84,900 SW Michigan MLS
- 1999-04-14 Listing Removed — REALCOMP
- 1998-12-14 Listed $84,900 REALCOMP
- 1998-12-14 Listed $84,900 SW Michigan MLS
Cash-flow waterfall
monthlySold comps — $/sqft
last 12 mo · ≤1 miLoading sold comps…