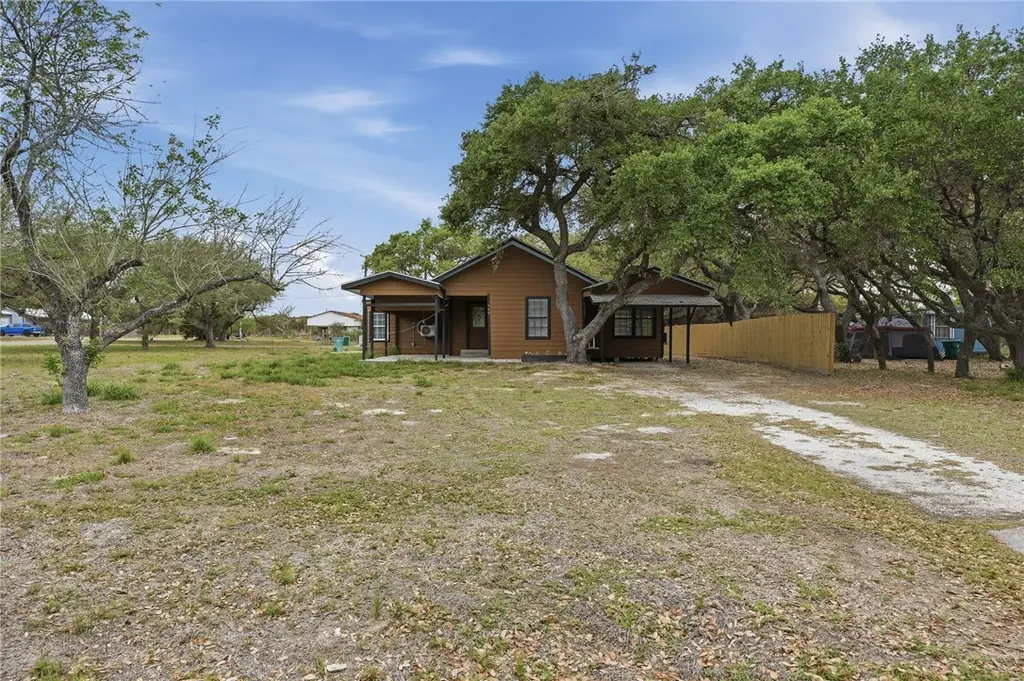
944 S Lamont St · Aransas Pass, TX
Flood risk 6/10 · Moderate
- FEMA flood zone
- X (unshaded)
- Chance of flooding over 30 yrs
- 0.69%
- Est. flood insurance / yr
- $507 – $1,088
Fire risk 3/10 · Minor
- Est. fire insurance / yr
- $1,222 – $2,270
Heat risk 10/10 · Severe
- Hot days now (above 106°F)
- 7 days/yr
- Hot days in 30 yrs
- 28 days/yr
Wind risk 9/10 · Severe
- Chance of severe wind over 30 yrs
- 99.0%
Air-quality risk 1/10 · Minimal
- Unhealthy air days now
- 0 days/yr
- Unhealthy air days in 30 yrs
- 0 days/yr
Risk factors via First Street. Map © Google.
Why this score? — see what drove the C+ grade
The composite is a weighted blend of 9 inputs, each scored 0–100. Each bar is that input's sub-score; the figure is the points it added to the 100-point composite (weight × sub-score).
- Cash flow +29.3/30.0
- DSCR +10.0/10.0
- 1% rule +8.1/10.0
- ARV discount +5.6/15.0
- Livability +3.6/5.0
- Schools +2.7/10.0
- Rent growth +2.5/5.0
- Condition / age +2.5/5.0
- Appreciation +0.0/10.0
$215,000
🖨 Deal sheet (PDF) 📄 Offer letter ✓ Due diligence
Listing remarks MLS
Newly Renovated 3-Bed, 2-Bath Home in Aransas Pass Townsite. Move-in ready and completely updated, this charming 3-bedroom, 2-bath home offers 1,208 sq. ft. of modern living space in the heart of Aransas Pass, often referred as the "Shrimp Capital of Texas". Features Include: Open-concept living and dining area with fresh paint and flooring; modern kitchen with new appliances, countertops, and cabinetry; updated bathrooms with contemporary fixtures; spacious bedrooms with plenty of natural light; partially fenced yard perfect for outdoor entertaining or gardening; convenient location near schools, shopping, and local amenities. Easy access to Conn Brown Harbor Point Park with a public boat ramp and city docks. Experience coastal Texas living at its finest in this beautifully renovated home. Don’t miss this incredible opportunity!
Key facts
- New appliances
- Updated bathrooms
- Convenient location
Tags
Neighborhood map
What this means for you Summary
Snapshot
- This is a 3-bed/2.0-bath single-family listed at $215k.
Deal economics
- At list price, monthly cash flow is $759 ($9k/yr) — positive.
- The deal already cash-flows at list — no discount required.
- Meets the 1% rule at list price ($3k rent vs $215k).
- Recommended offer: $202k (6.0% below list) — sets the bar for market timing.
- Cap rate 10.5% vs local median 4.6% in Aransas Pass — top-decile yield for the area; either an underpriced asset or a hidden risk that comps aren't pricing in. Stress-test before assuming the spread holds.
Location & tenants
- Location reads 72/100 on livability (#253 in TX) — a middle-class / working-renter tenant base. Strengths: cost of living A+, housing A+, health & safety A+; Watch: schools D, amenities F, commute F.
- Aransas Pass ISD (town): math 28% / reading 35% proficiency, ranked #597 of 826 in TX (top 72%) — families likely to look elsewhere, expect single-tenant / working-renter base with shorter leases; 64% free/reduced lunch — lower-income household profile, screen leases tightly.
- Market conditions: 275 active listings in the ZIP; 5 comparable units currently listed for rent nearby; rentals at typical pace (median 22d on market — plan ~3-4 weeks tenant-placement turnaround); 40% of comp listings sitting > 30 days — soft ceiling on asking rent; 344 units permitted in San Patricio County in 2024 (0 in 5+ unit buildings).
Forward outlook
- Local home prices are declining (-3.0%/yr); year-one equity from $1k of loan paydown is wiped out by about $6k of value loss. Plan a longer hold.
- San Patricio County population projected at +27% by 2050 — long-run rental-demand tailwind backs the buy-and-hold thesis.
- At projected returns (-3.0% appreciation + 3.0% rent growth), your $60k cash investment doubles in ~8 years — after that, you're playing with house money.
Negotiation context
- It's been on market 66 days — a 6% lower offer ($202k) is reasonable based on typical stale-listing flexibility.
- 3 sale attempts since 8y ago with the ask held roughly flat each time — persistent listings suggest the price (not the market) is what's stuck; bring a comps-based counter.
Risks & watch-outs
- Watch-outs: built in 1953 — expect roof / HVAC / electrical / plumbing capex.
- Climate carrying-cost: major flood risk; severe wind risk, 99% chance of damaging wind over 30y; extreme-heat days projected 7→28/yr by 2055 (HVAC capex compounding) — expect insurance premiums to compound above CPI over the hold.
Questions for the listing agent
- It's been on market 66 days. Have you received any prior offers? Is the seller open to a 6% concession, seller financing, or rate buy-down credit?
- Built in 1953 — when were the roof, HVAC, electrical panel, plumbing, and water heater last replaced?
- Why hasn't it sold? Are there any deal-killer items the seller is aware of (foundation, flood, title, zoning, code violations)?
- Is there a deadline driving the sale (1031 exchange, divorce, estate, relocation)? That informs how much negotiation room exists.
- Schools are D-rated, which usually means shorter tenancies and higher turnover. Who's the typical renter profile here, and what's been the actual vacancy rate?
- What's the average days-on-market for RENTAL listings here right now (not sales)? A rising rental-DOM trend means longer vacancies and softer asking-rent achievability than the comps imply.
- What's the recent tenant-quality profile in this submarket — average credit score on applications, eviction rate, late-payment / NSF rate, and stable-employment percentage? A property-management company in the area should have these aggregated.
- How much new for-sale + rental construction is in the pipeline within 1–3 miles? Heavy new supply typically softens prices + rents 12–24 months out; constrained supply supports both.
Investment metrics
- 1% rule
- 1.31% ✓
- Cap rate
- 10.53%
- Cash-on-cash
- 15.13%
- DSCR
- 1.67
- GRM
- 6.4
CMA / ARV
- ARV (median comp)
- $206,349
- List price
- $215,000
- Delta
- 4.19%
- Verdict
- FAIR
- Comps
- 20 within 1.0 mi
Show comp detail 12 sales within ~0.75 mi
| Address | Dist | Beds/Ba | Sqft | Sold | Price | $/sf | Match |
|---|---|---|---|---|---|---|---|
| 101 Saunders Ln | 0.24mi | 3/2.0 | 1,206 (-0%) | 9mo | $220,000 | $182 | 81 |
| 630 S Lamont | 0.29mi | 3/2.0 | 1,269 (+5%) | 1mo | $229,000 | $180 | 77 |
| 114 Spoonbill Ave | 0.30mi | 3/1.5 | 1,120 (-7%) | 4mo | $175,000 | $156 | 69 |
| 936 S Houston St | 0.31mi | 3/2.0 | 1,330 (+10%) | 1mo | $229,900 | $173 | 68 |
| 348 S Whitney St | 0.55mi | 2/2.5 (-1) | 1,220 (+1%) | 2mo | $199,000 | $163 | 64 |
| 119 Misty Ln | 0.56mi | 3/2.0 | 1,264 (+5%) | 4mo | $249,500 | $197 | 63 |
| 612 S 9th St | 0.46mi | 3/1.0 | 1,131 (-6%) | 7mo | $127,900 | $113 | 58 |
| 243 E Magnolia Ave | 0.54mi | 3/2.0 | 1,325 (+10%) | 2mo | $249,000 | $188 | 57 |
| 1034 S 10th St | 0.42mi | 2/2.0 (-1) | 1,312 (+9%) | 5mo | $179,900 | $137 | 57 |
| 109 Misty | 0.52mi | 3/2.0 | 1,339 (+11%) | 4mo | $210,000 | $157 | 54 |
| 553 S 12th St | 0.64mi | 3/2.0 | 1,108 (-8%) | 6mo | $175,000 | $158 | 51 |
| 423 S 12th St | 0.71mi | 2/2.0 (-1) | 1,372 (+14%) | 6mo | $290,000 | $211 | 34 |
Match score weights: distance 35% · size 25% · config 20% · recency 20%. Top-matched comps best support the ARV.
Projected returns pro-forma
-3.0% appreciation · 3.0% rent growth · sell at horizon
- IRR
- 5.8%
- Equity multiple
- 1.22×
- Total profit
- $13,536
- Equity at exit
- $32,057
- IRR
- 15.2%
- Equity multiple
- 2.23×
- Total profit
- $74,156
- Equity at exit
- $18,589
Cash invested: $60,200 (down + closing). Projections, not guarantees.
Landlord ↔ Tenant lean methodology
- Overall (STATE)
- 87 Strongly Landlord-Friendly
- State Texas
- 87 Strongly Landlord-Friendly · R+5
- County
- — inherits STATE
- City
- — inherits STATE
ZIP-level market 78336
- Home prices YoY
- -29.5%
- Active inventory
- 275
- Price-to-rent
- 6.4×
Monthly cashflow live
- Estimated rent
- $2,812 high interval (Pro) →
- Mortgage (P&I)
- −$1,127
- Tax from tax record
- −$246 /mo · $2,946/yr
- Insurance
- −$90
- HOA
- −$0
- Vacancy / Maint / Mgmt
- −$591
- Net cashflow
- $759
Break-even live
Sensitivity live
| Price | -10% $881 | -5% $820 | +0% $759 | +5% $698 | +10% $637 |
|---|---|---|---|---|---|
| Rent | -10% $537 | -5% $648 | +0% $759 | +5% $870 | +10% $981 |
| Rate | -1.0pp $867 | -0.5pp $814 | base $759 | +0.5pp $703 | +1.0pp $647 |
UW: 25.0% down · 7.5% · 30yr · 1.5% tax · 5.0% vac · 8.0% maint · 8.0% mgmt
Financing live
Cash to close
- Down payment
- $53,750
- Closing costs
- $6,450
- Reserves months
- —
- Total cash needed
- —
Loan-product check · same deal, 3 products live
Conventional
25% down · 7.5% · 30yr
- Down + closing
- —
- Monthly P&I
- —
- Monthly cashflow
- —
- DSCR
- —
- Eligible?
- —
Personal DTI + credit; lowest rate.
DSCR
20% down · 8.5% · 30yr
- Down + closing
- —
- Monthly P&I
- —
- Monthly cashflow
- —
- DSCR
- —
- Eligible?
- —
No personal income docs; deal must DSCR.
Hard money
10% down · 12.0% · 12mo
- Down + closing
- —
- Monthly P&I
- —
- Monthly cashflow
- —
- DSCR
- —
- Eligible?
- —
Short-term bridge; refi at stabilization.
Rent comps 5 comps
| Address | Beds | Baths | Sqft | Rent | $/sqft | DOM | Units | Dist |
|---|---|---|---|---|---|---|---|---|
| 1131 S 8th St Unit 1268400P Aransas Pass, TX | 3.0 | 2.0 | 1280 | $4,105 | $3.21 | 44d | 1 | 0.30mi |
| 1109 W Nelson Ave Aransas Pass, TX | 2.0 | 2.0 | 1304 | $1,800 | $1.38 | 44d | 1 | 0.59mi |
| 203 E Ransom Rd Aransas Pass, TX | 2.0 | 1.0 | 625 | $1,145 | $1.83 | 14d | 5 | 0.67mi |
| 2255 McMullen Ln Aransas Pass, TX | 2.0–4.0 | 2.5 | 1581 | $1,569 | $0.99 | 14d | 9 | 1.30mi |
| 633 N Commercial St Aransas Pass, TX | 2.0 | 1.0 | 900 | $1,850 | $2.06 | 21d | 1 | 1.39mi |
Listing history 20 events
-
2026-06-19days on market $215,000 Active 66 DOM
-
2026-06-18days on market $215,000 Active 65 DOM
-
2026-06-17days on market $215,000 Active 64 DOM
-
2026-06-16days on market $215,000 Active 63 DOM
-
2026-06-15days on market $215,000 Active 62 DOM
-
2026-06-14days on market $215,000 Active 60 DOM
-
2026-06-12days on market $215,000 Active 59 DOM
-
2026-06-09days on market $215,000 Active 56 DOM
-
2026-06-08days on market $215,000 Active 55 DOM
-
2026-06-07days on market $215,000 Active 54 DOM
-
2026-06-07days on market $215,000 Active 53 DOM
-
2026-06-04days on market $215,000 Active 50 DOM
-
2026-06-02days on market $215,000 Active 49 DOM
-
2026-06-01days on market $215,000 Active 48 DOM
-
2026-05-31days on market $215,000 Active 47 DOM
-
2026-05-31days on market $215,000 Active 46 DOM
-
2026-04-14$215,000 Active 857-char remark
Show marketing remark (857 chars)
Newly Renovated 3-Bed, 2-Bath Home in Aransas Pass Townsite. Move-in ready and completely updated, this charming 3-bedroom, 2-bath home offers 1,208 sq. ft. of modern living space in the heart of Aransas Pass, often referred as the "Shrimp Capital of Texas". Features Include: Open-concept living and dining area with fresh paint and flooring; modern kitchen with new appliances, countertops, and cabinetry; updated bathrooms with contemporary fixtures; spacious bedrooms with plenty of natural light; partially fenced yard perfect for outdoor entertaining or gardening; convenient location near schools, shopping, and local amenities. Easy access to Conn Brown Harbor Point Park with a public boat ramp and city docks. Experience coastal Texas living at its finest in this beautifully renovated home. Don’t miss this incredible opportunity!
-
2026-04-13$215,000 Active 851-char remark
Show marketing remark (851 chars)
Newly Renovated 3-Bed, 2-Bath Home in Aransas Pass Townsite. Move-in ready and completely updated, this charming 3-bedroom, 2-bath home offers 1,208 sq. ft. of modern living space in the heart of Aransas Pass, often referred as the "Shrimp Capital of Texas". Features Include: Open-concept living and dining area with fresh paint and flooring; modern kitchen with new appliances, countertops, and cabinetry; updated bathrooms with contemporary fixtures; spacious bedrooms with plenty of natural light; partially fenced yard perfect for outdoor entertaining or gardening; convenient location near schools, shopping, and local amenities. Easy access to Conn Brown Harbor Point Park with a public boat ramp and city docks. Experience coastal Texas living at its finest in this beautifully renovated home. Don't miss this incredible opportunity!
-
2019-02-25soldstatus
-
2018-06-28$95,000
ⓘ Source: listings_history table (triggers on properties + properties_extension) + one-shot
backfill from property_details.listing_events for pre-trigger history.
Tax reassessment forecast TX · Resets to sale price
- Current annual tax
- $2,946 · $246/mo
- Projected year-2 tax
- $3,934 · $328/mo
- Expected delta
- +$988/yr (+$82/mo · 33.5%)
ⓘ Screening estimate from a state-policy table — verify with the county assessor before closing.
Climate risk First Street
- Flood 6/10 Major FEMA zone X (unshaded) · 69% chance over 30 yrs
- Wildfire 3/10 Moderate
- Heat 10/10 Extreme 7 d/yr ≥106°F today · 28 d/yr by 30 yrs out
- Wind 9/10 Extreme 99% chance of damaging wind over 30 yrs
- Air quality 1/10 Low 0 unhealthy d/yr today · 0 by 30 yrs out
Nearby sold comps map
Loading sold comps map…
Walkable amenities ~0.75 mi
Loading nearby amenities…
Taxation est. · year 1
- Rental income
- $33,747
- − Mortgage interest
- −$12,043
- − Property taxes
- −$2,946
- − Insurance
- −$1,075
- − Repairs & maintenance
- −$2,700
- − Management
- −$2,700
- − Depreciation
- −$6,255
- Taxable income
- $6,028
- Est. tax owed @ 24.0%
- −$1,447
- After-tax cash flow
- $7,662/yr
For passive investors: Depreciation is non-cash, so a rental often shows a tax loss while cash-flowing — sheltering income. Rental losses are passive: they offset passive income freely, and up to $25,000/yr can offset ordinary (W-2) income if you actively participate and your MAGI is under $100k (phasing out to $0 by $150k); unused losses carry forward. On sale, claimed depreciation is recaptured at up to 25%, and gains may owe capital-gains tax (a 1031 exchange can defer both). Figures are a year-1 estimate at your 24.0% rate — not tax advice; consult a CPA.
Schools (NCES district)
- District
- Aransas Pass ISD
- NCES district ID
- 4808580
- Math proficiency
- 28% ▼ -16.00%
- Reading proficiency
- 35% ▼ -4.00%
- Median HH income
- $40,869
- Composite
- 26.55/100
- National rank
- #7191
- State rank
- #597 of 826 in TX
Livability — Aransas Pass
- Score
- 72/100
- State rank
- #253
- US rank
- #5980
Category grades
Schools grade is shown separately in the Schools card above.
Census & demographics
- Census place
- Aransas Pass, TX
- Population (ZIP)
- 12,146
Population outlook (San Patricio County) Hauer SSP2
- Today (2025)
- 75,538 people
- By 2030
- 79,575 · +5.3%
- By 2040
- 87,670 · +16.1%
- By 2050
- 96,107 · +27.2%
- By 2075
- 117,984 · +56.2%
- By 2100
- 130,010 · +72.1%
Race, ethnicity, and origin ACS 2023
- Neighborhood character
- Diverse neighborhood (Simpson 0.58)
- Race & ethnicity
- White 49% Hispanic / Latino 43% Two or more races 21% Asian 2% Native American 2% Black 2%
- Hispanic origin (detail)
- Mexican 36% Puerto Rican 2%
- Common ancestry
- Italian 2% Lithuanian 2% Slovak 1%
- Foreign-born
- 9% · Canada, Jamaica, China
- Languages at home
- 77% English-only · Spanish 21% Tagalog/Filipino 1%
Political lean MEDSL · San Patricio
- 2024 margin
- Solid R (+36.4) · D 31.4% · R 67.8%
- 2008→2024 swing
- -19.8pp toward R · 2008: -16.6pp · 2024: -36.4pp
- All cycles
- 2024: R+36.4 2020: R+29.1 2016: R+24.1 2012: R+20.6 2008: R+16.6
Not yet ingested
- Civics
- —
Market trends
- HPI YoY
- ▼ -78.56%
- Current HPI
- 187.8443
- Rent YoY
- —
- Metro
- —
- State GDP YoY
- ▲ 3.95%
- F500 in state
- 110
Industry mix (Fortune 500 HQ in TX)
| Industry | F500 HQs | Revenue |
|---|---|---|
| Energy | 16 | $1,198B |
|
||
| Technology | 5 | $198B |
|
||
| Engineering / Construction | 4 | $72B |
|
||
| Energy Services | 3 | $60B |
|
||
| Utilities | 3 | $41B |
|
||
| Healthcare | 2 | $330B |
|
||
Price history
+126.3% since first listed4 events — show timeline
- 2026-04-14 Listed $215,000 CBMLS
- 2026-04-13 Listed $215,000 RAAR
- 2019-02-25 Sold (MLS) — RAAR
- 2018-06-28 Listed $95,000 RAAR
Property tax history
+7.2%/yrLatest (2025): $2,946 · -7.7% YoY. Source: county tax records.
Cash-flow waterfall
monthlySold comps — $/sqft
last 12 mo · ≤1 miLoading sold comps…