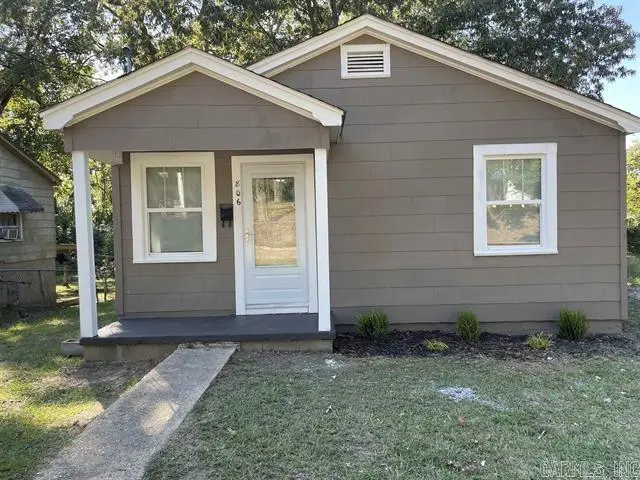
806 S Goodwin St · El Dorado, AR
Flood risk 1/10 · Minimal
- FEMA flood zone
- X (unshaded)
- Chance of flooding over 30 yrs
- 0.0%
- Est. flood insurance / yr
- $507 – $1,088
Fire risk 3/10 · Minor
- Est. fire insurance / yr
- $1,499 – $2,785
Heat risk 7/10 · Major
- Hot days now (above 111°F)
- 7 days/yr
- Hot days in 30 yrs
- 21 days/yr
Wind risk 6/10 · Moderate
- Chance of severe wind over 30 yrs
- 36.0%
Air-quality risk 1/10 · Minimal
- Unhealthy air days now
- 0 days/yr
- Unhealthy air days in 30 yrs
- 0 days/yr
Risk factors via First Street. Map © Google.
Why this score? — see what drove the C+ grade
The composite is a weighted blend of 9 inputs, each scored 0–100. Each bar is that input's sub-score; the figure is the points it added to the 100-point composite (weight × sub-score).
- Cash flow +30.0/30.0
- 1% rule +10.0/10.0
- DSCR +10.0/10.0
- Livability +3.5/5.0
- Schools +2.7/10.0
- Rent growth +2.5/5.0
- Condition / age +2.5/5.0
- ARV discount +0.3/15.0
- Appreciation +0.0/10.0
$56,000
🖨 Deal sheet 📄 Offer letter ✓ Due diligence
Listing remarks MLS
Move-in ready New windows 2022, New roof and sewer system in 2023, new water service, bathroom renovation, new vinyl plank flooring throughout, new quartz countertops in bath and kitchen and new paint in interior and exterior. Property being sold "As Is"
Key facts
- Quartz countertops
- Recently renovated
- New sewer system
Tags
Property features AI
Finance
- Other: Approximate lot dimensions 50 x 140 (about 0.16 acre); Source of lot and square footage: courthouse/tax records; Termite company on file: Wilsons; Annual taxes reported
- Financial info: Financing options include FHA, conventional, cash, Rural Development, or in-house financing
Exterior
- Utilities: Public sewer; Public water; Municipal electric (Entergy); Natural gas
- Home design: Inside city limits; Subdivision: CRAIGS WEST END
- Construction: Composition roof; Piers foundation
- Exterior features: Asbestos exterior; Paved road access; Sloped lot
Interior
- Kitchen: Free-standing stove; Refrigerator included
- Flooring: Vinyl flooring
- Bathrooms: 1 full bathroom
- Heating & cooling: Central heat; Central cooling
- Interior features: Kitchen counters finished in quartz; Sheetrock walls and ceilings
Neighborhood map
What this means for you Summary
Snapshot
- This is a 1-bed/1.0-bath single-family listed at $56k.
Deal economics
- At list price, monthly cash flow is $333 ($4k/yr) — positive.
- The deal already cash-flows at list — no discount required.
- Meets the 1% rule at list price ($838 rent vs $56k).
- Recommended offer: $55k (1.5% below list) — sets the bar for market timing.
- Cap rate 13.4% vs local median 4.1% in El Dorado — top-decile yield for the area; either an underpriced asset or a hidden risk that comps aren't pricing in. Stress-test before assuming the spread holds.
Location & tenants
- Location reads 69/100 on livability (#65 in AR) — a middle-class / working-renter tenant base. Strengths: cost of living A+, housing A+, health & safety A+; Watch: commute C-, schools D, employment D.
- El Dorado School District (town): math 32% / reading 34% proficiency, ranked #134 of 238 in AR (top 56%) — families likely to look elsewhere, expect single-tenant / working-renter base with shorter leases; 61% free/reduced lunch — lower-income household profile, screen leases tightly.
- Market conditions: 125 active listings in the ZIP; 20 units permitted in Union County in 2024 (0 in 5+ unit buildings).
Forward outlook
- Local home prices are declining (-3.0%/yr); year-one equity from $387 of loan paydown is wiped out by about $2k of value loss. Plan a longer hold.
- Union County population projected at -21% by 2050 — secular population decline; favor cash flow + early exit over multi-decade hold.
- At projected returns (-3.0% appreciation + 3.0% rent growth), your $16k cash investment doubles in ~5 years — after that, you're playing with house money.
Negotiation context
- It's been on market 24 days — a 2% lower offer ($55k) is reasonable based on typical stale-listing flexibility.
- 2 sale attempts with the ask held roughly flat each time — persistent listings suggest the price (not the market) is what's stuck; bring a comps-based counter.
- Current owner paid $48k; 17% above their basis — modest negotiation headroom, anchor on the comps not their cost.
Risks & watch-outs
- Climate carrying-cost: major wind risk, 36% chance of damaging wind over 30y; extreme-heat days projected 7→21/yr by 2055 (HVAC capex compounding) — expect insurance premiums to compound above CPI over the hold.
Questions for the listing agent
- Built in 1960 — when were the roof, HVAC, electrical panel, plumbing, and water heater last replaced?
- Is there a deadline driving the sale (1031 exchange, divorce, estate, relocation)? That informs how much negotiation room exists.
- Schools are D-rated, which usually means shorter tenancies and higher turnover. Who's the typical renter profile here, and what's been the actual vacancy rate?
- Crime grade is F in this area — have there been break-ins, vandalism, or insurance claims at this property in the last 3 years? What carrier currently insures it and at what premium?
- What's the average days-on-market for RENTAL listings here right now (not sales)? A rising rental-DOM trend means longer vacancies and softer asking-rent achievability than the comps imply.
- What's the recent tenant-quality profile in this submarket — average credit score on applications, eviction rate, late-payment / NSF rate, and stable-employment percentage? A property-management company in the area should have these aggregated.
- How much new for-sale + rental construction is in the pipeline within 1–3 miles? Heavy new supply typically softens prices + rents 12–24 months out; constrained supply supports both.
Investment metrics
- 1% rule
- 1.50% ✓
- Cap rate
- 13.43%
- Cash-on-cash
- 25.50%
- DSCR
- 2.13
- GRM
- 5.6
CMA / ARV
- ARV (on-the-fly)
- $48,300
- Comps found
- 1
Show comp detail 1 sale within ~0.75 mi
| Address | Dist | Beds/Ba | Sqft | Sold | Price | $/sf | Match |
|---|---|---|---|---|---|---|---|
| 806 S Goodwin St | 0.00mi | 1/1.0 | 700 (0%) | 5mo | $48,000 | $69 | 96 |
Match score weights: distance 35% · size 25% · config 20% · recency 20%. Top-matched comps best support the ARV.
Projected returns pro-forma
-3.0% appreciation · 3.0% rent growth · sell at horizon
- IRR
- 19.0%
- Equity multiple
- 1.77×
- Total profit
- $12,120
- Equity at exit
- $8,350
- IRR
- 27.4%
- Equity multiple
- 3.41×
- Total profit
- $37,782
- Equity at exit
- $4,842
Cash invested: $15,680 (down + closing). Projections, not guarantees.
Landlord ↔ Tenant lean methodology
- Overall (STATE)
- 92 Strongly Landlord-Friendly
- State Arkansas
- 92 Strongly Landlord-Friendly · R+14
- County
- — inherits STATE
- City
- — inherits STATE
ZIP-level market 71730
- Home prices YoY
- -18.5%
- Active inventory
- 125
- Price-to-rent
- 5.6×
Monthly cashflow live
- Estimated rent
- $838 medium interval (Pro) →
- Mortgage (P&I)
- −$294
- Tax from tax record
- −$12 /mo · $142/yr
- Insurance
- −$23
- HOA
- −$0
- Vacancy / Maint / Mgmt
- −$176
- Net cashflow
- $333
Break-even live
UW: 25.0% down · 7.5% · 30yr · 1.5% tax · 5.0% vac · 8.0% maint · 8.0% mgmt
Financing live
Cash to close
- Down payment
- $14,000
- Closing costs
- $1,680
- Reserves months
- —
- Total cash needed
- —
Loan-product check · same deal, 3 products live
Conventional
25% down · 7.5% · 30yr
- Down + closing
- —
- Monthly P&I
- —
- Monthly cashflow
- —
- DSCR
- —
- Eligible?
- —
Personal DTI + credit; lowest rate.
DSCR
20% down · 8.5% · 30yr
- Down + closing
- —
- Monthly P&I
- —
- Monthly cashflow
- —
- DSCR
- —
- Eligible?
- —
No personal income docs; deal must DSCR.
Hard money
10% down · 12.0% · 12mo
- Down + closing
- —
- Monthly P&I
- —
- Monthly cashflow
- —
- DSCR
- —
- Eligible?
- —
Short-term bridge; refi at stabilization.
Listing history 17 events
-
2026-06-12statusdays on market $56,000 Under Contract 24 DOM
-
2026-06-09days on market $56,000 Active 22 DOM
-
2026-06-08days on market $56,000 Active 21 DOM
-
2026-06-07days on market $56,000 Active 20 DOM
-
2026-06-07days on market $56,000 Active 19 DOM
-
2026-06-04days on market $56,000 Active 16 DOM
-
2026-06-02days on market $56,000 Active 15 DOM
-
2026-06-01days on market $56,000 Active 14 DOM
-
2026-05-31days on market $56,000 Active 13 DOM
-
2026-05-31days on market $56,000 Active 12 DOM
-
2026-05-18$56,000 New Listing
-
2026-01-16soldstatus $48,000 Sold 265-char remark
Show marketing remark (265 chars)
Move-in ready New windows 2022, New roof and sewer system in 2023, new water service, bathroom renovation, new vinyl plank flooring throughout, new quartz countertops in bath and kitchen and new paint in interior and exterior. Property being sold "As Is"
-
2026-01-16soldstatus $48,000
Show marketing remark (265 chars)
Move-in ready New windows 2022, New roof and sewer system in 2023, new water service, bathroom renovation, new vinyl plank flooring throughout, new quartz countertops in bath and kitchen and new paint in interior and exterior. Property being sold "As Is"
-
2025-12-10status Under Contract 265-char remark
Show marketing remark (265 chars)
Move-in ready New windows 2022, New roof and sewer system in 2023, new water service, bathroom renovation, new vinyl plank flooring throughout, new quartz countertops in bath and kitchen and new paint in interior and exterior. Property being sold "As Is"
-
2025-09-30$45,000 New Listing 265-char remark
Show marketing remark (265 chars)
Move-in ready New windows 2022, New roof and sewer system in 2023, new water service, bathroom renovation, new vinyl plank flooring throughout, new quartz countertops in bath and kitchen and new paint in interior and exterior. Property being sold "As Is"
-
2005-02-14soldstatus $14,000
-
2001-01-30soldstatus $15,000
ⓘ Source: listings_history table (triggers on properties + properties_extension) + one-shot
backfill from property_details.listing_events for pre-trigger history.
Tax reassessment forecast AR · Resets to sale price
- Current annual tax
- $142 · $12/mo
- Projected year-2 tax
- $358 · $30/mo
- Expected delta
- +$217/yr (+$18/mo · 152.6%)
ⓘ Screening estimate from a state-policy table — verify with the county assessor before closing.
Climate risk First Street
- Flood 1/10 Low FEMA zone X (unshaded) · 0% chance over 30 yrs
- Wildfire 3/10 Moderate
- Heat 7/10 Severe 7 d/yr ≥111°F today · 21 d/yr by 30 yrs out
- Wind 6/10 Major 36% chance of damaging wind over 30 yrs
- Air quality 1/10 Low 0 unhealthy d/yr today · 0 by 30 yrs out
Nearby sold comps map
Loading sold comps map…
Walkable amenities ~0.75 mi
Loading nearby amenities…
Taxation est. · year 1
- Rental income
- $10,055
- − Mortgage interest
- −$3,137
- − Property taxes
- −$142
- − Insurance
- −$280
- − Repairs & maintenance
- −$804
- − Management
- −$804
- − Depreciation
- −$1,629
- Taxable income
- $3,259
- Est. tax owed @ 24.0%
- −$782
- After-tax cash flow
- $3,216/yr
For passive investors: Depreciation is non-cash, so a rental often shows a tax loss while cash-flowing — sheltering income. Rental losses are passive: they offset passive income freely, and up to $25,000/yr can offset ordinary (W-2) income if you actively participate and your MAGI is under $100k (phasing out to $0 by $150k); unused losses carry forward. On sale, claimed depreciation is recaptured at up to 25%, and gains may owe capital-gains tax (a 1031 exchange can defer both). Figures are a year-1 estimate at your 24.0% rate — not tax advice; consult a CPA.
Schools (NCES district)
- District
- El Dorado School District
- NCES district ID
- 0505680
- Math proficiency
- 32% ▼ -6.00%
- Reading proficiency
- 34% ▼ -6.00%
- Median HH income
- $36,122
- Composite
- 27.36/100
- National rank
- #6979
- State rank
- #134 of 238 in AR
Livability — El Dorado
- Score
- 69/100
- State rank
- #65
- US rank
- #8444
Category grades
Schools grade is shown separately in the Schools card above.
Census & demographics
- Census place
- El Dorado, AR
- Population (ZIP)
- 29,187
Population outlook (Union County) Hauer SSP2
- Today (2025)
- 37,422 people
- By 2030
- 35,808 · -4.3%
- By 2040
- 32,605 · -12.9%
- By 2050
- 29,688 · -20.7%
- By 2075
- 23,691 · -36.7%
- By 2100
- 17,950 · -52.0%
Race, ethnicity, and origin ACS 2023
- Neighborhood character
- Diverse neighborhood (Simpson 0.55)
- Race & ethnicity
- White 58% Black 32% Hispanic / Latino 6% Two or more races 4% Asian 1%
- Hispanic origin (detail)
- Mexican 5%
- Common ancestry
- Lithuanian 1% Italian 1% Serbian 1%
- Foreign-born
- 4% · Canada, China
- Languages at home
- 95% English-only · Spanish 4% Chinese 1%
Political lean MEDSL · Union
- 2024 margin
- Solid R (+33.5) · D 32.5% · R 66.0% · Other 1.5%
- 2008→2024 swing
- -7.4pp toward R · 2008: -26.1pp · 2024: -33.5pp
- All cycles
- 2024: R+33.5 2020: R+29.5 2016: R+27.8 2012: R+26.3 2008: R+26.1
Not yet ingested
- Civics
- —
Market trends
- HPI YoY
- ▼ -35.36%
- Current HPI
- 155.8786
- Rent YoY
- —
- Metro
- —
- State GDP YoY
- ▲ 3.80%
- F500 in state
- 10
Industry mix (Fortune 500 HQ in AR)
| Industry | F500 HQs | Revenue |
|---|---|---|
| Retail | 1 | $681B |
|
||
| Food / Agriculture | 1 | $53B |
|
||
| Retail / Energy | 1 | $22B |
|
||
| Transportation / Logistics | 1 | $12B |
|
||
| Energy | 1 | $4B |
|
||
Price history
+273.3% since first listed7 events — show timeline
- 2026-05-18 Listed $56,000 CARMLS
- 2026-01-16 Sold (Public Records) $48,000 Public Records
- 2026-01-16 Sold (MLS) $48,000 CARMLS
- 2025-12-10 Pending — CARMLS
- 2025-09-30 Listed $45,000 CARMLS
- 2005-02-14 Sold (Public Records) $14,000 Public Records
- 2001-01-30 Sold (Public Records) $15,000 Public Records
Property tax history
+2.8%/yrLatest (2025): $142 · +0.0% YoY. Source: county tax records.
Cash-flow waterfall
monthlySold comps — $/sqft
last 12 mo · ≤1 miLoading sold comps…