1924 NE 25th St · Oklahoma City, OK
Flood risk 1/10 · Minimal
- FEMA flood zone
- X (unshaded)
- Chance of flooding over 30 yrs
- 0.0%
- Est. flood insurance / yr
- $507 – $1,088
Fire risk 1/10 · Minimal
- Est. fire insurance / yr
- $2,463 – $4,575
Heat risk 5/10 · Moderate
- Hot days now (above 107°F)
- 6 days/yr
- Hot days in 30 yrs
- 16 days/yr
Wind risk 2/10 · Minimal
- Chance of severe wind over 30 yrs
- 3.0%
Air-quality risk 2/10 · Minimal
- Unhealthy air days now
- 1 days/yr
- Unhealthy air days in 30 yrs
- 2 days/yr
Risk factors via First Street. Map © Google.
Why this score? — see what drove the D- grade
The composite is a weighted blend of 9 inputs, each scored 0–100. Each bar is that input's sub-score; the figure is the points it added to the 100-point composite (weight × sub-score).
- ARV discount +15.0/15.0
- Cash flow +8.3/30.0
- Livability +4.0/5.0
- Rent growth +3.0/5.0
- 1% rule +2.6/10.0
- Condition / age +2.5/5.0
- DSCR +2.3/10.0
- Schools +0.7/10.0
- Appreciation +0.0/10.0
$162,500
🖨 Deal sheet (PDF) 📄 Offer letter ✓ Due diligence
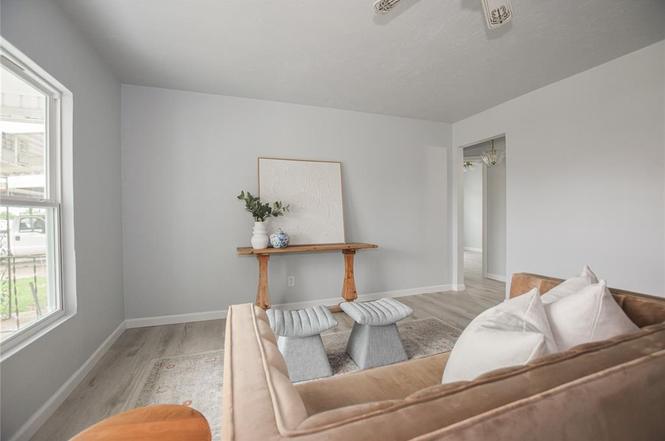
Listing remarks
Modern Perfection Meets Spacious Comfort – Fully Remodeled & Move-In Ready! Welcome home to this breathtaking, fully reimagined 4-bedroom, 2-bathroom gem. This isn’t just a house; it’s the peace-of-mind sanctuary you’ve been waiting for. Every detail has been meticulously updated, combining modern sophistication with the reliable quality of a fresh start. Why You’ll Fall in Love. .. Enjoy the luxury of worry-free living! This home features a brand-new roof, a high-efficiency AC, a modern furnace, and a new hot water tank. We’ve even upgraded the plumbing and electrical systems throughout, so you can move in with absolute confidence. Space to Live,
Key facts
- Fully remodeled
- Upgraded plumbing
- Brand new roof
Tags
Property features AI
Finance
- Other: Taxes listed (amount available); Located in Wallace Adkins addition; Directions: Addition is on the west side of MLK and NE 25th St; Not historically designated; Unoccupied
- Financial info: Current list price available; Assumability and loan qualifying status unknown
- HOA & community: No mandatory association dues
Exterior
- Utilities: Homestead exempt (yes)
- Home design: Single family residence; One story; Residential property; Existing construction
- Construction: Frame construction with vinyl siding; Composition roof; Conventional foundation; Built from plans
- Exterior features: Covered porch; Interior lot
Interior
- Bedrooms: Four bedrooms (one-level property)
- Bathrooms: Two full bathrooms
- Interior features: Two living areas; No fireplace
Neighborhood map
What this means for you Summary
Snapshot
- This is a 2-bed/2.0-bath single-family listed at $162k.
Deal economics
- At list price, monthly cash flow is $-148 ($-2k/yr) — negative.
- To cash-flow at today's rent, offer at most $141k (13.2% below list).
- To meet the 1% rule (rent ≥ 1% of price), the offer needs to be $123k (24.1% below list).
- Recommended offer: $123k (24.1% below list) — sets the bar for 1% rule.
- Cap rate 5.2% vs local median 3.7% in Oklahoma City — top-decile yield for the area; either an underpriced asset or a hidden risk that comps aren't pricing in. Stress-test before assuming the spread holds.
Location & tenants
- Location reads 80/100 on livability (#3 in OK, #1,635 nationally) — a professional / high-income tenant draw. Strengths: amenities A+, commute A+, cost of living A+; Watch: crime F.
- Oklahoma City (urban): math 7% / reading 10% proficiency, ranked #254 of 270 in OK (top 94%) — low school quality limits family demand, transient renter base, plan for 1-2y turnover; 82% free/reduced lunch — lower-income household profile, screen leases tightly.
- Zoned schools: Thelma R. Parks Es (math 2% / reading 2%, grade F, #802 of 845 statewide, top 100%, 472 students, 0% FRL); Classen Ms of Advanced Studies (math 35% / reading 46%, grade F, #6 of 345 statewide, top 1%, 855 students, 0% FRL); Douglass Hs (math 2% / reading 2%, grade F, #445 of 447 statewide, top 100%, 556 students, 0% FRL) — zoned schools average 0% FRL vs 82% district-wide (82 pts lower); this property's tenant base skews higher-income than the district average.
- Market conditions: Rents rising (+2.1%/yr); 83 active listings in the ZIP; 33 comparable units currently listed for rent nearby; rentals at typical pace (median 26d on market — plan ~3-4 weeks tenant-placement turnaround); 45% of comp listings sitting > 30 days — soft ceiling on asking rent; lower-income renter base — watch delinquency; 5,365 units permitted in Oklahoma County in 2024 (569 in 5+ unit buildings).
- This rent runs 37% of the median local income ($40k/yr) — at the standard rent-burdened threshold; future hikes will face affordability resistance.
Forward outlook
- Local home prices are declining (-3.0%/yr); year-one equity from $1k of loan paydown is wiped out by about $5k of value loss. Plan a longer hold.
- Oklahoma County population projected at +41% by 2050 — long-run rental-demand tailwind backs the buy-and-hold thesis.
Negotiation context
- Only 3 days on market — expect competitive offers; lowballing is unlikely to land.
- Current owner paid $80k; list at $162k implies a 103% gain — meaningful room to come down on a strong offer.
Risks & watch-outs
- Watch-outs: built in 1950 — expect roof / HVAC / electrical / plumbing capex.
- Climate carrying-cost: extreme-heat days projected 6→16/yr by 2055 (HVAC capex compounding) — expect insurance premiums to compound above CPI over the hold.
Questions for the listing agent
- What do current leases actually rent for vs. the listed asking? Can we see a recent rent roll and the last 12 months of T-12 income?
- Built in 1950 — when were the roof, HVAC, electrical panel, plumbing, and water heater last replaced?
- Is there a deadline driving the sale (1031 exchange, divorce, estate, relocation)? That informs how much negotiation room exists.
- Schools are F-rated, which usually means shorter tenancies and higher turnover. Who's the typical renter profile here, and what's been the actual vacancy rate?
- Crime grade is F in this area — have there been break-ins, vandalism, or insurance claims at this property in the last 3 years? What carrier currently insures it and at what premium?
- The area grade is low — what's the realistic commute time and amenity access for the typical tenant pool here? Any planned neighborhood developments (good or bad) we should know about?
- What's the average days-on-market for RENTAL listings here right now (not sales)? A rising rental-DOM trend means longer vacancies and softer asking-rent achievability than the comps imply.
- What's the recent tenant-quality profile in this submarket — average credit score on applications, eviction rate, late-payment / NSF rate, and stable-employment percentage? A property-management company in the area should have these aggregated.
- How much new for-sale + rental construction is in the pipeline within 1–3 miles? Heavy new supply typically softens prices + rents 12–24 months out; constrained supply supports both.
Investment metrics
- 1% rule
- 0.76% ✗
- Cap rate
- 5.20%
- Cash-on-cash
- -3.90%
- DSCR
- 0.83
- GRM
- 11.0
CMA / ARV
- ARV (on-the-fly)
- $249,280
- Comps found
- 12
Show comp detail 12 sales within ~0.75 mi
| Address | Dist | Beds/Ba | Sqft | Sold | Price | $/sf | Match |
|---|---|---|---|---|---|---|---|
| 2213 E Madison St | 0.39mi | 3/2.5 (+1) | 1,435 (-6%) | 4mo | $165,000 | $115 | 62 |
| 2918 N Prospect Ave | 0.50mi | 3/2.0 (+1) | 1,590 (+5%) | 10mo | $70,000 | $44 | 56 |
| 2217 N Fonshill Ave | 0.61mi | 3/2.0 (+1) | 1,429 (-6%) | 2mo | $239,000 | $167 | 55 |
| 1600 NE 20th St | 0.54mi | 3/2.0 (+1) | 1,386 (-9%) | 4mo | $232,000 | $167 | 52 |
| 1744 NE 20th St | 0.46mi | 2/1.0 | 1,308 (-14%) | 2mo | $114,999 | $88 | 50 |
| 1501 NE 21st St | 0.51mi | 3/2.0 (+1) | 1,400 (-8%) | 10mo | $230,000 | $164 | 49 |
| 1748 NE 20th St | 0.46mi | 3/2.0 (+1) | 1,375 (-10%) | 12mo | $135,000 | $98 | 48 |
| 2216 N Kate Ave | 0.64mi | 3/2.0 (+1) | 1,429 (-6%) | 9mo | $250,000 | $175 | 48 |
| 2124 Sherman Ave | 0.62mi | 3/2.0 (+1) | 1,678 (+10%) | 2mo | $240,002 | $143 | 47 |
| 1508 NE 18th St | 0.70mi | 3/2.0 (+1) | 1,624 (+7%) | 5mo | $298,500 | $184 | 47 |
| 2605 N Kate Ave | 0.62mi | 3/1.0 (+1) | 1,320 (-13%) | 2mo | $93,500 | $71 | 38 |
| 2133 NE 16th Ter | 0.74mi | 3/2.0 (+1) | 1,386 (-9%) | 14mo | $245,000 | $177 | 34 |
Match score weights: distance 35% · size 25% · config 20% · recency 20%. Top-matched comps best support the ARV.
Projected returns pro-forma
-3.0% appreciation · 2.13% rent growth · sell at horizon
- IRR
- -23.8%
- Equity multiple
- 0.19×
- Total profit
- $-36,813
- Equity at exit
- $24,229
- IRR
- -21.4%
- Equity multiple
- -0.06×
- Total profit
- $-48,439
- Equity at exit
- $14,050
Cash invested: $45,500 (down + closing). Projections, not guarantees.
Landlord ↔ Tenant lean methodology
- Overall (STATE)
- 83 Strongly Landlord-Friendly
- State Oklahoma
- 83 Strongly Landlord-Friendly · R+20
- County
- — inherits STATE
- City
- — inherits STATE
ZIP-level market 73111
- Home prices YoY
- -13.6%
- Rents YoY
- 2.1%
- Active inventory
- 83
- Price-to-rent
- 11.0×
Monthly cashflow live
- Estimated rent
- $1,234 high interval (Pro) →
- Mortgage (P&I)
- −$852
- Tax est. 1.5%
- −$203 /mo · $2,438/yr
- Insurance
- −$68
- HOA
- −$0
- Vacancy / Maint / Mgmt
- −$259
- Net cashflow
- $-148
Break-even live
Sensitivity live
| Price | -10% $-36 | -5% $-92 | +0% $-148 | +5% $-204 | +10% $-260 |
|---|---|---|---|---|---|
| Rent | -10% $-246 | -5% $-197 | +0% $-148 | +5% $-99 | +10% $-51 |
| Rate | -1.0pp $-66 | -0.5pp $-107 | base $-148 | +0.5pp $-190 | +1.0pp $-233 |
UW: 25.0% down · 7.5% · 30yr · 1.5% tax · 5.0% vac · 8.0% maint · 8.0% mgmt
Financing live
Cash to close
- Down payment
- $40,625
- Closing costs
- $4,875
- Reserves months
- —
- Total cash needed
- —
Loan-product check · same deal, 3 products live
Conventional
25% down · 7.5% · 30yr
- Down + closing
- —
- Monthly P&I
- —
- Monthly cashflow
- —
- DSCR
- —
- Eligible?
- —
Personal DTI + credit; lowest rate.
DSCR
20% down · 8.5% · 30yr
- Down + closing
- —
- Monthly P&I
- —
- Monthly cashflow
- —
- DSCR
- —
- Eligible?
- —
No personal income docs; deal must DSCR.
Hard money
10% down · 12.0% · 12mo
- Down + closing
- —
- Monthly P&I
- —
- Monthly cashflow
- —
- DSCR
- —
- Eligible?
- —
Short-term bridge; refi at stabilization.
Rent comps 33 comps
| Address | Beds | Baths | Sqft | Rent | $/sqft | DOM | Units | Dist |
|---|---|---|---|---|---|---|---|---|
| 1812 NE 24th St Oklahoma City, OK | 3.0 | 1.0 | 1071 | $1,175 | $1.10 | 4d | 1 | 0.16mi |
| 2020 NE 30th St Oklahoma City, OK | 3.0 | 1.0 | 1056 | $1,150 | $1.09 | 45d | 1 | 0.32mi |
| 2112 NE 23rd St Oklahoma City, OK | 3.0 | 1.0 | 1117 | $1,070 | $0.96 | 18d | 1 | 0.33mi |
| 2313 NE 23rd St Oklahoma City, OK | 3.0 | 2.5 | 1500 | $1,095 | $0.73 | 45d | 1 | 0.48mi |
| 2200 Hardin Dr Oklahoma City, OK | 3.0 | 1.0 | 1091 | $1,025 | $0.94 | 45d | 1 | 0.50mi |
| 2908 N Fonshill Ave Oklahoma City, OK | 3.0 | 2.0 | 1325 | $1,225 | $0.92 | 45d | 1 | 0.51mi |
| 2308 NE 21st St Oklahoma City, OK | 3.0 | 1.0 | 1400 | $1,250 | $0.89 | 4d | 1 | 0.55mi |
| 2143 NE 19th St Oklahoma City, OK | 2.0 | 1.0 | 1265 | $945 | $0.75 | 45d | 1 | 0.56mi |
| 1621 NE 33rd St Oklahoma City, OK | 3.0 | 2.0 | 1500 | $1,975 | $1.32 | 45d | 1 | 0.62mi |
| 1801 N Jordan Ave Oklahoma City, OK | 2.0 | 1.0 | 1080 | $1,000 | $0.93 | 16d | 1 | 0.69mi |
| 2312 N Everest Ave Oklahoma City, OK | 3.0 | 1.0 | 1100 | $1,299 | $1.18 | 45d | 1 | 0.73mi |
| 2135 N Lottie Ave Oklahoma City, OK | 3.0 | 2.0 | 1602 | $1,600 | $1.00 | 45d | 1 | 0.76mi |
| 2604 NE 21st St Oklahoma City, OK | 3.0 | 1.0 | 1260 | $995 | $0.79 | 25d | 1 | 0.82mi |
| 2225 Glen Ellyn St Oklahoma City, OK | 2.0 | 1.0 | 1095 | $925 | $0.84 | 45d | 1 | 0.83mi |
| 2036 NE Grand Blvd Oklahoma City, OK | 2.0 | 1.0 | 1092 | $995 | $0.91 | 4d | 1 | 0.85mi |
| 1450 NE 16th Ter Oklahoma City, OK | 3.0 | 1.0 | 1096 | $1,295 | $1.18 | 45d | 1 | 0.86mi |
| 2148 N Stonewall Ave Oklahoma City, OK | 2.0 | 1.0 | 1055 | $875 | $0.83 | 5d | 1 | 0.88mi |
| 2616 NE Success St Oklahoma City, OK | 3.0 | 2.0 | 1312 | $1,350 | $1.03 | 25d | 1 | 0.91mi |
| 1220 NE 17th St Oklahoma City, OK | 2.0 | 1.0 | 1100 | $1,195 | $1.09 | 45d | 1 | 0.95mi |
| 2705 NE 18th St Oklahoma City, OK | 3.0 | 2.0 | 1399 | $1,000 | $0.71 | 23d | 1 | 1.00mi |
| 2105 NE 12th St Oklahoma City, OK | 3.0 | 2.0 | 1180 | $1,650 | $1.40 | 23d | 1 | 1.00mi |
| 1444 NE 13th St Unit 1446 Oklahoma City, OK | 2.0 | 2.0 | 1167 | $1,199 | $1.03 | 18d | 1 | 1.01mi |
| 2520 NE 14th St Oklahoma City, OK | 3.0 | 1.0 | 1070 | $1,099 | $1.03 | 45d | 1 | 1.07mi |
| 1501 NE Grand Blvd Oklahoma City, OK | 3.0 | 1.0 | 1204 | $1,200 | $1.00 | 5d | 1 | 1.07mi |
| 912 NE 21st St Oklahoma City, OK | 2.0 | 1.0 | 1521 | $1,350 | $0.89 | 23d | 1 | 1.10mi |
| 1633 NE 11th St Oklahoma City, OK | 3.0 | 2.0 | 1284 | $1,945 | $1.51 | 3d | 1 | 1.11mi |
| 1217 Carverdale Dr Oklahoma City, OK | 2.0 | 2.0 | 1323 | $1,300 | $0.98 | 45d | 1 | 1.12mi |
| 1516 Park Cir Oklahoma City, OK | 3.0 | 1.0 | 1118 | $1,250 | $1.12 | 25d | 1 | 1.25mi |
| 1615 NE 9th St Oklahoma City, OK | 3.0 | 2.0 | 1724 | $2,700 | $1.57 | 3d | 1 | 1.32mi |
| 1428 NE 10th St Oklahoma City, OK | 3.0 | 2.0 | 1487 | $1,600 | $1.08 | 45d | 1 | 1.34mi |
| 1706 NE 8th St Oklahoma City, OK | 3.0 | 2.0 | 1389 | $1,345 | $0.97 | 4d | 1 | 1.40mi |
| 735 NE 14th St Oklahoma City, OK | 2.0 | 1.0 | 1216 | $1,299 | $1.07 | 5d | 1 | 1.46mi |
| 737 NE 14th St Oklahoma City, OK | 2.0 | 2.0 | 1216 | $1,299 | $1.07 | 45d | 1 | 1.46mi |
Listing history 3 events
-
2026-06-21days on market $162,500 Active 3 DOM
-
2026-06-19remarks 659-char remark
-
2026-06-19$162,500 Active 1 DOM
ⓘ Source: listings_history table (triggers on properties + properties_extension) + one-shot
backfill from property_details.listing_events for pre-trigger history.
Climate risk First Street
- Flood 1/10 Low FEMA zone X (unshaded) · 0% chance over 30 yrs
- Wildfire 1/10 Low
- Heat 5/10 Major 6 d/yr ≥107°F today · 16 d/yr by 30 yrs out
- Wind 2/10 Low 3% chance of damaging wind over 30 yrs
- Air quality 2/10 Low 1 unhealthy d/yr today · 2 by 30 yrs out
Nearby sold comps map
Loading sold comps map…
Walkable amenities ~0.75 mi
Loading nearby amenities…
Taxation est. · year 1
- Rental income
- $14,810
- − Mortgage interest
- −$9,103
- − Property taxes
- −$2,438
- − Insurance
- −$812
- − Repairs & maintenance
- −$1,185
- − Management
- −$1,185
- − Depreciation
- −$4,727
- Taxable loss
- −$4,640
- Est. tax savings @ 24.0%
- +$1,114
- After-tax cash flow
- $-663/yr
For passive investors: Depreciation is non-cash, so a rental often shows a tax loss while cash-flowing — sheltering income. Rental losses are passive: they offset passive income freely, and up to $25,000/yr can offset ordinary (W-2) income if you actively participate and your MAGI is under $100k (phasing out to $0 by $150k); unused losses carry forward. On sale, claimed depreciation is recaptured at up to 25%, and gains may owe capital-gains tax (a 1031 exchange can defer both). Figures are a year-1 estimate at your 24.0% rate — not tax advice; consult a CPA.
Schools (NCES district)
- District
- Oklahoma City
- NCES district ID
- 4022770
- Math proficiency
- 7% ▼ -5.00%
- Reading proficiency
- 10% ▼ -6.00%
- Median HH income
- $35,606
- Composite
- 7.0/100
- National rank
- #9970
- State rank
- #254 of 270 in OK
Livability — Oklahoma City
- Score
- 80/100
- State rank
- #3
- US rank
- #1635
Category grades
Schools grade is shown separately in the Schools card above.
Census & demographics
- Census place
- Oklahoma City, OK
- County
- Oklahoma County · 771,644 people
- City population
- 498,656
- Metro
- Oklahoma City, OK
- Population (ZIP)
- 10,727
- Household income
- $40,340
- Rent vs Own
- Severe rent burden
- 804.0
Population outlook (Oklahoma County) Hauer SSP2
- Today (2025)
- 911,875 people
- By 2030
- 982,413 · +7.7%
- By 2040
- 1,130,468 · +24.0%
- By 2050
- 1,288,422 · +41.3%
- By 2075
- 1,711,482 · +87.7%
- By 2100
- 2,088,448 · +129.0%
Race, ethnicity, and origin ACS 2023
- Neighborhood character
- Predominantly Black (76%)
- Race & ethnicity
- Black 76% White 13% Two or more races 7% Hispanic / Latino 6% Native American 2%
- Hispanic origin (detail)
- Mexican 4%
- Foreign-born
- 2% · Canada
- Languages at home
- 94% English-only · Spanish 6%
Political lean MEDSL · Oklahoma
- 2024 margin
- Toss-up / Even · D 48.0% · R 49.7% · Other 2.3%
- 2008→2024 swing
- +15.1pp toward D · 2008: -16.8pp · 2024: -1.7pp
- All cycles
- 2024: R+1.7 2020: R+1.1 2016: R+10.5 2012: R+16.7 2008: R+16.8
Not yet ingested
- Civics
- —
Market trends
- HPI YoY
- ▼ -34.64%
- Current HPI
- 220.6395
- Rent YoY
- ▲ 2.13%
- Metro
- Oklahoma City, OK
- State GDP YoY
- ▲ 1.55%
- F500 in state
- 6
Industry mix (Fortune 500 HQ in OK)
| Industry | F500 HQs | Revenue |
|---|---|---|
| Energy | 3 | $48B |
|
||
Price history
+828.6% since first listed3 events — show timeline
- 2026-06-18 Listed $162,500 MLSOK
- 2026-04-15 Sold (Public Records) $80,000 Public Records
- 1999-02-25 Sold (Public Records) $17,500 Public Records
Cash-flow waterfall
monthlySold comps — $/sqft
last 12 mo · ≤1 miLoading sold comps…